
Eurosystem staff macroeconomic projections for the euro area, June 2023
1 Overview
Euro area economic activity slightly declined at the turn of the year, but has remained relatively resilient to the large negative supply shocks that have been hitting the economy. The economy is expected to return to growth in the coming quarters as energy prices moderate, foreign demand strengthens and supply bottlenecks are resolved, allowing firms to continue to work through their significant order backlogs, and as uncertainty – including that related to the recent banking sector stress – continues to recede. Furthermore, real incomes are set to improve, underpinned by a robust labour market, with unemployment hitting new historical lows. Although the ECB’s monetary policy tightening will increasingly feed through to the real economy, the dampening effects from tighter credit supply conditions are expected to be limited. Together with the gradual withdrawal of fiscal support, this will weigh on economic growth in the medium term. Overall, annual average real GDP growth is expected to slow down to 0.9% in 2023 (from 3.5% in 2022), before rebounding to 1.5% in 2024 and 1.6% in 2025.[1] Compared with the March 2023 ECB staff projections, the outlook for GDP growth has been revised down by 0.1 percentage points for 2023 and 2024, reflecting mainly tighter financing conditions. GDP growth in 2025 remains unchanged, as these effects are expected to be partly offset by the impact of higher real disposable income and lower uncertainty.
Inflation, as measured by the Harmonised Index of Consumer Prices (HICP), is proving to be more persistent than previously expected, despite falling energy prices and easing supply bottlenecks. With energy inflation set to become increasingly negative throughout 2023 and food inflation moderating sharply, headline inflation is expected to continue its decline to stand at around 3% in the last quarter of the year. Nevertheless, HICP inflation excluding energy and food is projected to overtake headline inflation in the near term and to remain above it until early 2024, though following a gradual downward path from the second half of this year. As indirect effects from the past energy price shocks and other pipeline price pressures gradually fade, driving the expected decline, labour costs will become the dominant driver of HICP inflation excluding energy and food. Wage growth is expected to remain over double its historical average for most of the projection horizon, driven by inflation compensation and the tight labour market, as well as increases in minimum wages. Nevertheless, profit margins, which expanded notably in 2022, are expected to act as a buffer against some of the pass-through of these costs in the medium term. In addition, monetary policy should further dampen underlying inflation in the coming years. Overall, headline inflation is expected to decrease from 8.4% in 2022 to an average of 5.4% in 2023, 3.0% in 2024 and 2.2% in 2025. Compared with the March 2023 projections, headline inflation has been revised up slightly over the entire projection horizon. This is mainly due to a significant upward revision to HICP inflation excluding energy and food, reflecting revisions owing to higher than expected recent inflation outcomes and somewhat stronger unit labour costs, which more than offset the effect of the lower energy price assumptions and tighter financing conditions.
Table
Growth and inflation projections for the euro area
(annual percentage changes)
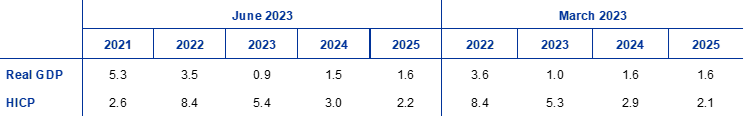
Notes: Real GDP figures refer to seasonally and working day-adjusted data. Historical data may differ from the latest Eurostat publications owing to data releases after the cut-off date for the projections.
The uncertainty surrounding the staff projections continues to be high, which is reflected by the uncertainty bands surrounding the projections for growth and inflation (Charts 1 and 4).
2 Real economy
Economic activity in the euro area slightly declined in the first quarter of 2023,[2] with consumption declining and net exports making a positive contribution amid declining energy imports (Chart 1). Industrial production started the year strongly, on the back of historically high order backlogs and the easing of supply bottlenecks, but fell sharply in March. Amid negative carry-over effects from the monthly dynamics in the fourth quarter of 2022, survey indicators suggest that services supported growth in the first quarter of 2023. Across the final use components of GDP, private consumption declined, reflecting weak dynamics of real disposable income amid high inflation, and tightening financing conditions, and despite robust employment growth. In contrast, net exports made a positive contribution to GDP growth in the first quarter, mostly reflecting a drop in imports owing to weaker domestic demand and lower energy consumption.
Chart 1
(quarter-on-quarter percentage changes, seasonally and working day-adjusted quarterly data)
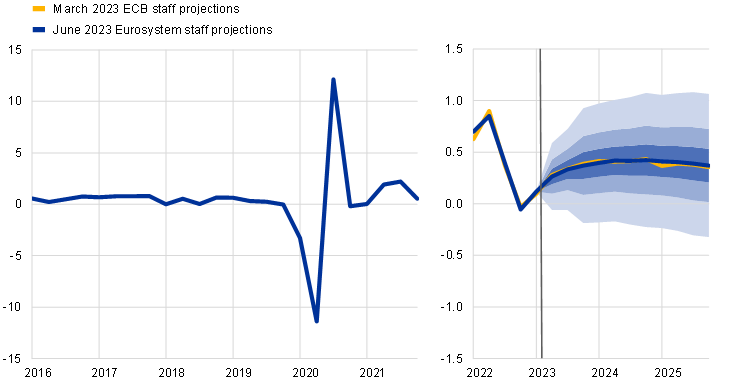
Notes: Historical data may differ from the latest Eurostat publications (see footnote 2). The vertical line indicates the start of the current projection horizon. The ranges shown around the central projections provide a measure of the degree of uncertainty and are symmetric by construction. They are based on past projection errors, after adjustment for outliers. The bands, from darkest to lightest, depict the 30%, 60% and 90% probabilities that the outcome of real GDP growth will fall within the respective intervals. For more information, see Box 6 of the March 2023 ECB staff macroeconomic projections for the euro area.
GDP growth is projected to pick up from the second quarter of 2023 and to remain solid in the second half of the year, as the impact of supply bottlenecks and energy shocks wanes and real income recovers, despite a worsening outlook for manufacturing. As inflation declines and wages rise in the context of a buoyant labour market, real disposable income is set to grow again in the second quarter. Together with declining uncertainty and increasing confidence, this sets the stage for a recovery in private consumption. The positive contribution of net trade in the first quarter will likely have diminished in the second quarter, as import growth picks up in line with improving domestic demand. Most indicators of business and consumer confidence, as well as expectations, are consistent with this assessment. The results of the Purchasing Managers’ Index survey in May suggest a recovery driven by services, but with manufacturing in contractionary territory. Economic activity will also be constrained in 2023 by the impact of tightening financing conditions. Overall, real GDP is expected to increase by 0.3% in both the second and third quarters of 2023, in line with the March 2023 projections.
Over the medium term GDP growth is projected to increase further, supported by further increases in real income and strengthening foreign demand, albeit with headwinds from tighter financing conditions and a tighter fiscal stance. Real GDP growth is set to strengthen throughout 2023 and to broadly stabilise in 2024-25 at rates around 0.4%, quarter on quarter. In addition to the unwinding of supply shocks and uncertainty-related precautionary behaviour, growth is also expected to be strongly supported by the abating inflationary pressures, in the context of solid employment and labour income growth, allowing a continued recovery in real disposable income and consumption. However, the impetus from these tailwinds will be mitigated by the tightening of financing conditions, the past appreciation of the euro and the gradual withdrawal of fiscal support.
Tighter credit supply conditions are expected to constrain growth to a limited extent, while the normalisation of monetary policy is expected to have a more marked negative impact. Past changes in interest rates and market-based expectations at the cut-off date for the projections (as reflected in the technical assumptions for the projections – see Box 1) will have a negative impact on GDP growth, particularly in 2023 and 2024.[3] In addition, credit supply conditions, as reported in the ECB’s latest euro area bank lending survey, have tightened significantly since December 2022. However, mitigating factors – such as the overall favourable state of household and corporate balance sheets, for example owing to pandemic-related excess savings and high profitability – are expected to partly offset the impact.
Compared with the March 2023 projections, real GDP growth has been revised down by 0.1 percentage points for 2023 and 2024, but remains unchanged for 2025. The tightening of credit supply conditions is assessed to weigh somewhat more on growth in 2023 than assumed in the March 2023 projections, while the impacts in 2024-25 are broadly unchanged. The contribution from inventories is also assumed to be weaker in 2023, compared with the March projections. Beyond the short term a weaker contribution from net exports, especially in 2024, is seen to be offset by stronger domestic demand supported by more robust real disposable income growth and lower uncertainty.
Table 1
Macroeconomic projections for the euro area
(annual percentage changes, unless otherwise indicated)
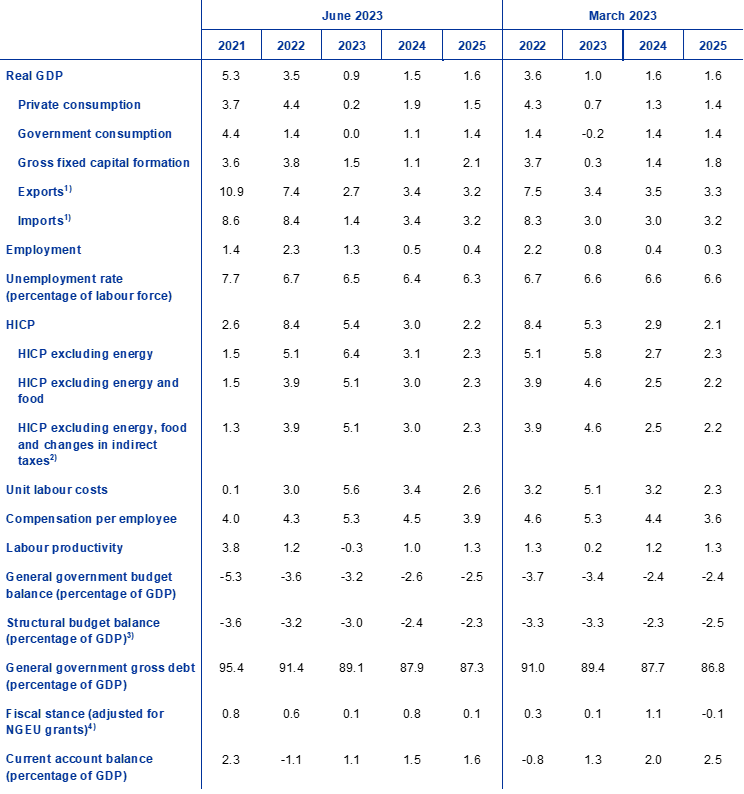
Notes: Real GDP and components, unit labour costs, compensation per employee and labour productivity refer to seasonally and working day-adjusted data. Historical data may differ from the latest Eurostat publications owing to data releases after the cut-off date for the projections.
1) This includes intra-euro area trade.
2) The sub-index is based on estimates of actual impacts of indirect taxes. This may differ from Eurostat data, which assume a full and immediate pass-through of indirect tax impacts to the HICP.
3) Calculated as the government balance net of transitory effects of the economic cycle and measures classified under the European System of Central Banks definition as temporary.
4) The fiscal policy stance is measured as the change in the cyclically adjusted primary balance net of government support to the financial sector. The figures shown are also adjusted for expected grants under the Next Generation EU (NGEU) programme on the revenue side. A negative figure implies a loosening of the fiscal stance.
Turning to the components of real GDP, household real consumption is expected to gradually recover as uncertainty declines and real incomes and confidence improve. Private consumption is expected to rebound from the second quarter of 2023, in line with the drop in inflation and the recovery in confidence, amid broadly neutral fiscal support. Beyond the short term, as inflation and uncertainty recede further and real incomes improve, consumption will continue to recover, growing slightly faster than real disposable income, as savings normalise further, albeit slowly. Private consumption growth has been revised down for 2023 compared with the March projections, owing to the weaker than expected developments in early 2023. It has been revised up for 2024-25, reflecting stronger income growth supported by both the labour and non-labour components and a more limited withdrawal of the remaining fiscal support in 2024.
After stagnating in 2022, real disposable income is projected to recover, driven by falling inflation and robust wage growth, in the context of a strong labour market. Real disposable income stagnated in 2022 (and declined around the turn of this year) owing to high inflation and an overall negative contribution of fiscal transfers to household income, reflecting the withdrawal of coronavirus (COVID-19) support measures. It is expected to gradually recover during 2023 in the context of declining, albeit still elevated, inflation. Strengthening wage and non-labour income growth and ongoing employment growth are seen to support households’ purchasing power, despite gradually moderating over the projection horizon. Fiscal transfers are seen to make a broadly neutral contribution to real disposable income growth over the full horizon. As inflation is expected to decline further and economic activity is set to strengthen substantially, maintaining strong labour markets, real disposable income is expected to increase in 2024 and 2025 to well above its pre-pandemic level.
The household saving ratio is expected to remain elevated in 2023 and to only slightly decrease thereafter. The saving ratio increased at the end of 2022, largely owing to precautionary motives related to high levels of uncertainty. It is expected to remain heightened in 2023, as higher interest rates counterbalance households’ desire to normalise their saving behaviour after the pandemic. As uncertainty and inflationary pressures recede further over the projection horizon, the household saving ratio should edge down, albeit remaining above its pre-pandemic level. The stock of excess savings, largely accumulated by wealthier households and held in illiquid assets, is not expected to provide a significant boost to consumption growth. Amid higher interest rates and tightening credit supply conditions, households will likely further rebalance their holdings towards assets with higher yields.
Box 1
Technical assumptions about interest rates, commodity prices and exchange rates
Compared with the March 2023 projections, the technical assumptions include slightly higher interest rates, lower oil prices, significantly lower wholesale gas and electricity prices and an appreciation of the euro. The technical assumptions about interest rates and commodity prices are based on market expectations, with a cut-off date of 23 May 2023. Short-term interest rates refer to the three-month EURIBOR and market expectations are derived from futures rates, while ten-year government bond yields are used to proxy long-term interest rates.[4] Both short and long-term rates have risen slightly since the cut-off date for the March 2023 projections and, relative to those projections, their paths have been revised up by around 10 basis points on the back of further rises in the ECB’s policy rates.
Table
Technical assumptions
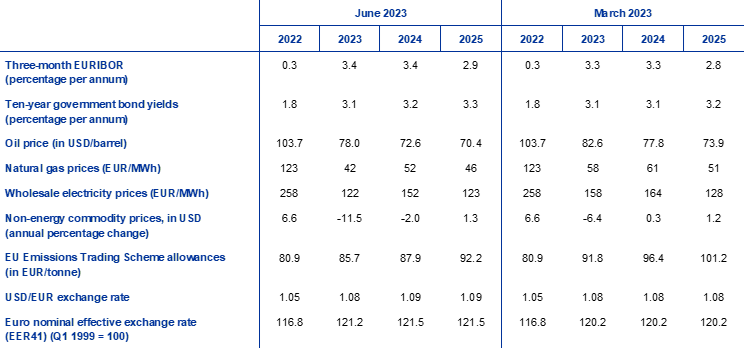
The technical assumptions for oil prices have been revised down as concerns over global oil demand outweighed fears of insufficient oil supply.[5] In particular, since the March projections, changes in oil prices have been driven by concerns over global economic demand in the context of US banking sector stress (exerting downward pressure), on the one hand, and higher Chinese demand, following the reopening of China’s economy, and the OPEC+ decision to cut supply (exerting upward pressure), on the other hand. The oil futures curve has shifted downwards since the March 2023 projections (by 5.5% for 2023, 6.7% for 2024 and 4.8% for 2025) and remains in backwardation. The oil price is assumed to stand at USD 78.0 per barrel in 2023 and to decline to USD 70.4 per barrel in 2025.
Wholesale gas and electricity prices have continued to decline further below the levels prevailing before the war in Ukraine. High inventories have contributed to keeping gas prices low, with the EU on track to achieve its 90% gas storage target by November 2023. Overall, the gas futures curve has shifted downwards since the March projections (by 27% for 2023, 16% for 2024 and 9% for 2025). The European gas price is assumed to stand at €42 per MWh in 2023 and to increase to €46 per MWh in 2025. As regards carbon emissions allowances on the EU Emissions Trading System, the assumed path based on futures has been revised downwards since the March projections (by around 9%) owing to weaker industrial activity, but also on account of the turbulence in financial markets in March and technical factors.
Bilateral exchange rates are assumed to remain unchanged over the projection horizon, at the average levels prevailing in the ten working days ending on the cut-off date. This implies an exchange rate of USD 1.09 per euro over the projection horizon, which is 0.8% higher than assumed in the March 2023 projections. The assumption for the effective exchange rate of the euro implies an appreciation of around 1.1% compared with the assumption in the March projections.
Housing investment is projected to decline substantially in 2023 and 2024 amid tightening financing conditions. Housing investment will decline this year and next year, owing to protracted weakness in affordability (proxied by the ratio of average income to an average mortgage payment on a typical home) and profitability (measured by Tobin’s Q). While typically moving in opposite directions, driven by house price fluctuations, both affordability and profitability have contracted in recent quarters, owing to rising mortgage rates and construction costs respectively, amid subdued house price dynamics and weak disposable income dynamics. These dynamics, together with credit supply restrictions, will continue to weigh heavily on the level of housing investment. Although housing investment growth is estimated to have turned temporarily positive in the first quarter of the year (owing to easing supply bottlenecks and favourable weather conditions in some countries), the protracted decline, which started in the second quarter of 2022, is expected to continue until 2024. Housing investment growth should return to a sustained pace in 2025, with affordability and profitability recovering as both mortgage rates and construction costs stabilise.
Business investment is expected to be dampened by tighter financing costs and credit supply conditions, before recovering more strongly later in the horizon. Following a sharp contraction in the fourth quarter of 2022, business investment growth is expected to recover in 2023. This contrasts with the continued contraction entailed in the March projections. When the very volatile investment in Irish intellectual property products is excluded[6], the contraction in business investment in the fourth quarter of 2022 was much smaller, and this decline is expected to have been fully reversed in the first quarter of 2023. Overall, business investment is expected to record positive growth, but at a subdued pace in 2023 and in 2024 as credit supply effects become increasingly binding, wage costs rise and fiscal support measures are withdrawn. In 2025 investment – in particular related to the green transition and digitalisation, and spurred by the Next Generation EU (NGEU) programme – will again accelerate, in part reflecting increasing domestic and foreign demand as well as profit growth.
Box 2
The international environment
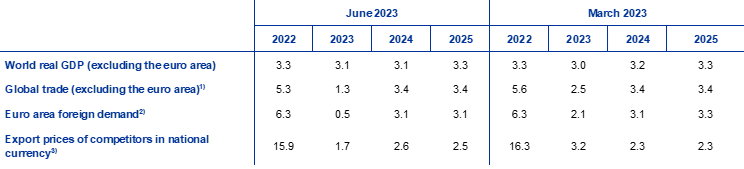
The global economy started this year on a stronger footing and is expected to grow moderately over the projection horizon, with some pick-up in 2025. Global GDP growth (excluding the euro area) surprised on the upside in the first quarter of 2023, with better than expected growth both in China, relating to an earlier and stronger than expected recovery after the lifting of pandemic restrictions, and also in the United States in the context of a resilient labour market. The fallout from the US banking sector woes in early March led to a short period of acute stress in global financial markets. Since then, however, most asset classes have recovered their losses despite lingering uncertainty. The world economy (excluding the euro area) is projected to grow by 3.1% this year and next year. Growth is seen to rise to 3.3% in 2025. The growth outlook is broadly unchanged compared with the March 2023 projections.
Despite positive momentum in economic activity, global trade remains weak as the composition of global demand is turning less trade-intensive, but over the medium term it should develop more in line with real GDP growth. The current low trade intensity of growth reflects an interplay of several factors, such as a post-pandemic shift in consumption patterns towards services and away from goods, and lower investment owing to higher interest rates. As a result, global trade is projected to grow by 1.3% in 2023 – a notably subdued pace compared with its long-term average and also with global growth. As the composition of consumption patterns in advanced economies is expected to gradually normalise over the projection horizon, with investment recovering, world trade should increase at rates only slightly above those of global growth in 2024 and 2025. Euro area foreign demand is seen to follow a similar path, growing by 0.5% this year and picking up to 3.1% in 2024 and 2025. Projections for world trade and euro area foreign demand have been revised down for this year – largely on account of sizeable negative carry-over effects from the weaker than previously estimated trade performance at the turn of the year – and remain broadly unchanged thereafter.
Table
The international environment
(annual percentage changes)
1) Calculated as a weighted average of imports.
2) Calculated as a weighted average of imports of euro area trading partners.
3) Calculated as a weighted average of the export deflators of euro area trading partners.
Price pressures in the global economy remain high, while the export prices of euro area trading partners should grow at subdued rates over the projection horizon. World headline consumer price inflation reached its peak at 8.3% in the third quarter of 2022. It has declined since then, in the context of waning supply disruptions, lower transportation costs, falling energy prices and weaker demand related to the synchronised monetary policy tightening across the globe. However, resilient labour markets and strong wage growth, especially in key advanced economies, suggest that underlying inflation pressures remain strong and the process of disinflation will likely be gradual. Growth of euro area competitor export prices (in national currencies) has been falling rapidly since the peak reached in the second quarter of 2022 on account of negative base effects for commodity prices, and is expected to continue to do so in the near term, reflecting developments in the technical assumptions. Competitors’ prices are expected to grow at rates more in line with historical averages over the rest of the projection horizon as the strong domestic and foreign pipeline pressures are expected to dissipate.
Euro area export growth is expected to recover, supported by improving foreign demand as the impact of supply bottlenecks fades. Following declines in the past two quarters, euro area real exports are estimated to increase in line with the improvements in supply bottlenecks and increased demand for euro area travel services. Those factors are expected to outweigh the recent deterioration in euro area price competitiveness. Nevertheless, price competitiveness is still considerably better than prior to the pandemic. Therefore, overall euro area exporters are projected to gain further export market shares. At the same time, euro area import growth is projected to be weak in the near term amid subdued energy imports and weak domestic demand, but is set to rebound in the medium term as domestic demand recovers. Overall, the combination of weaker imports and export gains implies a positive net trade contribution to GDP growth in 2023 (Chart 2). Falling energy prices have led to an improvement in the euro area terms of trade in the near term, with modest further gains projected over the horizon. The improvement in the terms of trade is expected to contribute to a rise in the euro area current account, which is projected to rebound in 2023 and improve slightly further in 2024 and 2025.
Chart 2
Euro area real GDP – decomposition into the main expenditure components
(annual percentage changes, percentage point contributions)
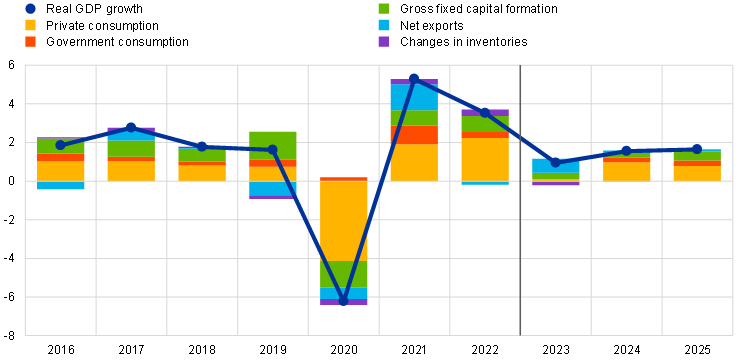
Notes: Data are seasonally and working day-adjusted. Historical data may differ from the latest Eurostat publications owing to data releases after the cut-off date for the projections. The vertical line indicates the start of the projection horizon.
The labour market is projected to remain robust and tight over the projection horizon (Chart 3). Employment increased strongly in the first quarter of 2023, rising by 0.6% compared with the previous quarter, in spite of a slight decline in real GDP. The increase was primarily due to a strong increase in the labour force. Employment is expected to grow by 1.3% in 2023 but to increase at a slower pace over the remainder of the projection horizon, reaching 0.4% by 2025. The unemployment rate is projected to decline further from an already historically low level to stand at 6.3% in 2025. Average hours worked per person employed are projected to further increase over the projection horizon – in contrast to the trend decline in the years prior to the pandemic – but are seen to still remain below the pre-crisis level in the fourth quarter of 2025. Productivity growth, which has been receding sharply in recent quarters and fell by 0.6% in the first quarter of 2023, is projected to bottom out this year before recovering to levels above its historical average in 2024 and 2025.
Chart 3
Euro area labour market
(percentage of labour force (left-hand scale), annual percentage changes (right-hand scale))
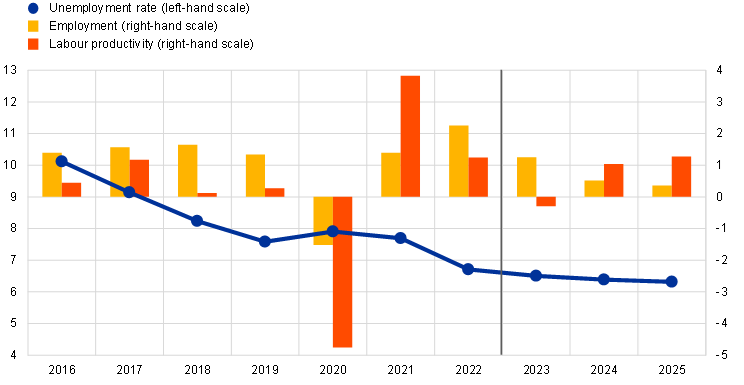
Note: The vertical line indicates the start of the projection horizon.
3 Fiscal outlook
The changes in discretionary fiscal policy measures have been relatively limited at the euro area level since the March 2023 projections. For 2023, the revisions in fiscal assumptions are mostly related to the scaling-down of fiscal support measures in response to the energy crisis and high inflation to about 1.6% of GDP, compared with 1.8% of GDP in the March projections. The rather limited revision at the euro area level is, however, the result of heterogeneity across countries. On the one hand, the further fall in wholesale energy prices entails lower fiscal costs of certain measures, in particular the gas and electricity price caps enacted in several countries. On the other hand, a large share of the fiscal support – primarily those measures offering direct income support or enacted VAT rate cuts – does not depend directly on energy prices. Moreover, for a few countries, the fiscal support has been revised up somewhat compared with the March projections, following the extension of measures into 2023 or updated estimates in the context of the 2023 stability programmes prepared by euro area governments. Unlike for 2023, the revisions in discretionary measures for 2024 entail less fiscal tightening compared with the March projections. Beyond the reversal of the impact from energy-related measures, the revisions stem from higher government investment, partly reflecting some backloading of NGEU-funded projects, and somewhat higher pension expenditure, further cuts in direct taxes and social security contributions, and higher public wage growth in several countries. The euro area fiscal stance, adjusted for NGEU grants, is projected to be broadly balanced in 2023, to tighten considerably in 2024 – as about 70% of the energy and inflation-related support from 2023 is assumed to be withdrawn – and to be broadly balanced in 2025. Substantial fiscal support nonetheless remains in the June 2023 baseline projections compared with 2019, prior to the pandemic.
The euro area fiscal outlook is set to improve over the projection horizon. After the significant decline in 2022, the euro area budget deficit is projected to continue to decline at a slower pace over 2023-24 and only marginally in 2025 (to 2.5% of GDP). The decline in the budget balance at the end of the projection horizon, compared with 2022, is explained by the improvement in the cyclically adjusted primary balance and, to a more limited extent, by a better cyclical fiscal component, while interest payments gradually increase as a share of GDP over the horizon. Euro area debt is projected to continue to decline, albeit more slowly after 2022, to stand at 87.3% of GDP by 2025. This is mainly on account of negative interest rate-growth differentials, which more than offset the persisting primary deficits. Nevertheless, in 2025 both the deficit and debt ratios are expected to remain above pre-pandemic levels. Compared with the March projections, the budget balance remains broadly unchanged at the end of the horizon, while the debt ratio has been revised up somewhat over 2023-25 mainly on account of less favourable interest rate-growth differentials.
4 Prices and costs
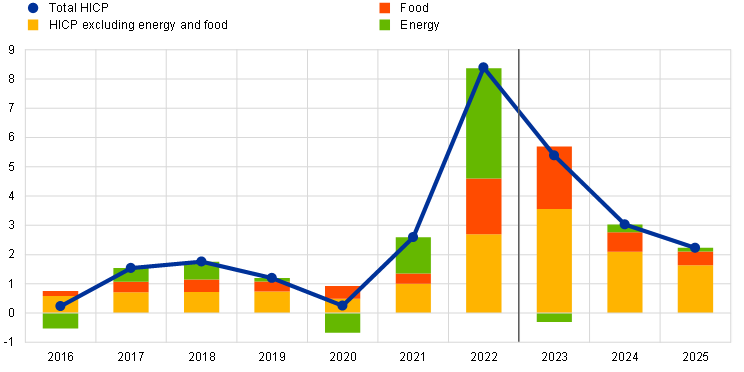
HICP inflation is projected to decrease to an average of 5.4% in 2023 and then to 3.0% in 2024 and 2.2% in 2025. After a sharp decline in the course of 2023 inflation is expected to hover around 3.0% in 2024, before falling gradually further in 2025 (Chart 4). This decline in headline inflation over the projection horizon reflects declines in the annual rates of change of all the main components to varying degrees, with the profile also affected by fiscal policy measures and commodity price assumptions (Chart 5).
Chart 4
Euro area HICP inflation
(annual percentage changes)

Notes: The vertical line indicates the start of the current projection horizon. The ranges shown around the central projections for HICP inflation are based on past projection errors, after adjustment for outliers. The bands, from darkest to lightest, depict the 30%, 60% and 90% probabilities that the outcome of HICP inflation will fall within the respective intervals. For more information, see Box 6 of the March 2023 ECB staff macroeconomic projections for the euro area.
Headline HICP inflation is expected to continue its rapid decline throughout 2023, driven by downward base effects, lower energy prices and easing pipeline pressures. Energy inflation is set to contribute notably to this decline, owing to downward base effects and the assumption of declining energy commodity prices. Food inflation will decline more gradually as downward base effects and assumptions of moderating energy prices and food commodity prices are tempered by the upward impact from increasing profit margins, dynamic labour cost growth and the lagged effects of past adverse weather conditions. HICP inflation excluding energy and food is projected to moderate gradually in the course of 2023 as receding pipeline pressures should outweigh upward pressures from strengthening wage growth. Receding pipeline pressures from the strong past increases in producer prices are expected to be reinforced by downward impacts from the recent appreciation of the euro and easing supply bottlenecks. At the same time, robust tourism demand in the near term and rising labour cost pressures are envisaged to support HICP inflation excluding energy and food, likely keeping it at elevated levels over the summer, before gradually receding thereafter.
Following an uptick in 2024, related to the unwinding of fiscal measures, energy inflation is expected to put downward pressure on headline inflation in 2025. This pattern reflects the downward-sloping profile for the technical assumptions for oil, gas and electricity wholesale prices between 2024 and 2025. An expected rebound in energy inflation in 2024 is mainly due to strong upward base effects and the phasing-out of many government measures to dampen gas and electricity inflation.
Food inflation is expected to decline in the later years of the projection horizon in line with commodity price assumptions. Developments in labour costs are expected to become an important driver of food inflation, as food and energy commodity prices are assumed to continue to decrease until the end of the projection horizon, though remaining above their pre-2022 levels.
Over the medium term HICP inflation excluding energy and food is projected to continue to gradually decline, although it will remain elevated owing to strong wage growth throughout the projection horizon. The expected decline from 5.1% in 2023 to 2.3% in 2025 reflects the unwinding of indirect effects of energy prices, disappearing supply bottlenecks, the dampening impact of monetary policy tightening and the normalising of demand after the strong recovery following the pandemic. At the same time, HICP inflation excluding energy and food will remain well above its historical mean of 1.5% in the medium term on account of strong unit labour cost dynamics, mainly owing to wage growth, which are seen to be partly buffered by a contraction in unit profits in 2024.
Chart 5
Euro area HICP inflation – decomposition into the main components
(annual percentage changes, percentage points)
Note: The vertical line indicates the start of the current projection horizon.
Wages are projected to grow at rates well above the historical average, reflecting inflation compensation and the tight labour market, as well as increases in minimum wages. Growth in compensation per employee is projected to decline from 5.3% in 2023 to 4.5% in 2024 and 3.9% in 2025, with wage increases expected to be well above historical averages in both the public and private sectors. For 2023, the figure is unchanged compared with the March projections, whereas stronger growth is expected for 2024 and 2025 reflecting a tighter labour market. Losses in purchasing power incurred since the surge in inflation are expected to be made up only at the end of the projection horizon. Growth in unit labour costs is expected to peak in 2023 before declining in 2024 and 2025, amid declining wage growth and a recovery in productivity growth.
The unwinding of supply bottlenecks, weak aggregate demand in 2023 and strong wage growth over most of the projection horizon are consistent with declining profit indicators over the horizon. Exceptional factors have supported firms’ margins in 2021 and 2022, and are also likely to do so in 2023 (Chart 6).[7] The fading-out of pandemic-related pent-up demand, easing supply bottlenecks and dampening effects from monetary policy tightening should imply increased pressure on unit profits to absorb strong wage growth and ensuing unit labour cost growth. The normalisation of energy prices, on the other hand, should lead to an improvement in the terms of trade, and thus to some extent should mitigate the negative impact of higher wage growth and weaker domestic demand on unit profits.
Chart 6
Euro area GDP deflator – income side decomposition
(annual percentage changes, percentage points)

Note: The vertical line indicates the start of the current projection horizon.
Following a surge in 2022, the annual growth rate of import prices is expected to turn negative in 2023, leading to improving terms of trade over the projection horizon. Following a 17.2% surge in 2022, the import deflator is expected to drop sharply and contract in 2023, before turning positive in 2024 and 2025 in line with the assumed declines in oil, gas and other commodity prices and vanishing supply bottlenecks for imported inputs.
Compared with the March 2023 projections, the projection for HICP inflation has been revised up by 0.1 percentage points for each year of the projection horizon. The downward revisions to energy components have been outweighed by upward revisions to the non-energy components. Food inflation has been revised up owing to upside data surprises and stronger wage growth, despite weaker technical assumptions for energy and food commodity prices. HICP inflation excluding energy and food has been revised up both in the near term, largely on account of recent data surprises which dominate the expected receding indirect effects related to lower energy prices, and also in the medium term, reflecting greater persistence of underlying inflation and stronger pressure from unit labour cost growth.
Box 3
Sensitivity analysis: alternative energy price paths
Given the significant uncertainty surrounding future energy price developments, alternative paths for energy prices are derived from option-implied oil and gas prices and a constant price path to assess the implications for the outlook for HICP inflation and real GDP growth. In this sensitivity analysis, a synthetic energy price index is used, which combines both oil and gas futures prices. Alternative downside and upside paths are derived from the 25th and 75th percentiles of the option-implied neutral densities for both oil and gas prices on 23 May 2023 (the cut-off date for the technical assumptions). Both distributions point to upside risks to the technical assumptions entailed in the June 2023 projections, which are particularly pronounced for gas futures prices. In addition, a constant price assumption is considered for both oil and gas prices. The impacts of the alternative paths are assessed based on a range of ECB and Eurosystem macroeconomic models used in the projections. The average impacts on real GDP growth and inflation across these models are shown in the table below.
Table
Impacts of alternative energy price paths
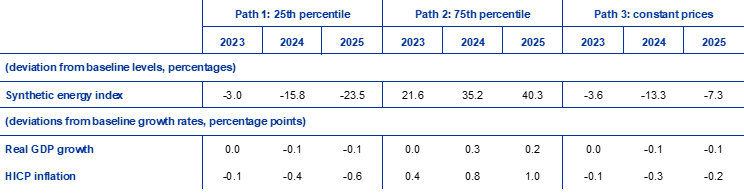
Notes: In this sensitivity analysis, a synthetic energy price index that combines oil and gas futures prices is used. The 25th and 75th percentiles refer to the option-implied neutral densities for the oil and gas prices as at 23 May 2023. The constant oil and gas prices take the respective value as at the same date. The macroeconomic impacts are reported as averages of a number of ECB and Eurosystem staff macroeconomic models.
Box 4
Forecasts by other institutions
Forecasts for the euro area are available from both international organisations and private sector institutions. However, these forecasts are not directly comparable with one another or with the Eurosystem staff macroeconomic projections, as these were finalised at different points in time. Additionally, these projections use different methods to derive assumptions for fiscal, financial and external variables, including oil, gas and other commodity prices. Finally, there are differences in working day adjustment methods across different forecasts.
Table
Comparison of recent forecasts for euro area real GDP growth and HICP inflation
(annual percentage changes)
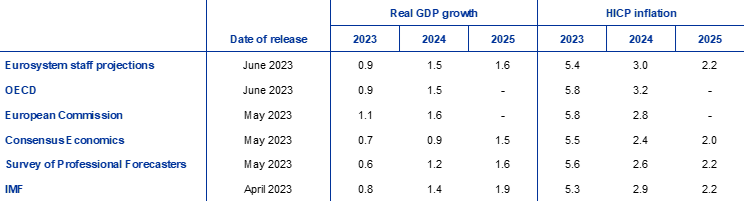
Sources: OECD June 2023 Economic Outlook 113, 7 June 2023; European Commission Spring 2023 Economic Forecast, 15 May 2023; Consensus Economics Forecasts, 11 May 2023 (data for 2025 taken from the April 2023 survey); ECB Survey of Professional Forecasters, 5 May 2023; IMF World Economic Outlook, 11 April 2023.
Notes: The Eurosystem staff macroeconomic projections report working day-adjusted annual growth rates, whereas the European Commission and the IMF report annual growth rates that are not adjusted for the number of working days per annum. Other forecasts do not specify whether they report working day-adjusted or non-working day-adjusted data.
The June 2023 Eurosystem staff projections are within the range of other forecasts for GDP growth and inflation. The Eurosystem staff GDP growth projection is in line with the OECD’s forecast and slightly below the European Commission’s forecast, but higher than the IMF’s forecast and private sector forecasts in 2023-24. As regards HICP inflation, the Eurosystem staff projection for 2024 is among the highest forecasts, but 0.2 percentage points below the OECD’s forecast. For 2025, it is at the upper end of the narrow range of other forecasts, but in line with the forecasts of the IMF and the Survey of Professional Forecasters.
© European Central Bank, 2023
Postal address 60640 Frankfurt am Main, Germany
Telephone +49 69 1344 0
Website www.ecb.europa.eu
All rights reserved. Reproduction for educational and non-commercial purposes is permitted provided that the source is acknowledged.
For specific terminology please refer to the ECB glossary (available in English only).
PDF ISBN 978-92-899-5731-1, ISSN 2529-4687, doi:10.2866/573691, QB-CF-23-001-EN-N
HTML ISBN 978-92-899-5750-2, ISSN 2529-4687, doi:10.2866/960, QB-CF-23-001-EN-Q
The cut-off date for technical assumptions, such as those for oil prices and exchange rates, was 23 May 2023. The projections for the global economy were finalised on 23 May and the macroeconomic projections for the euro area were finalised on 31 May 2023. Although this was one day before the publication of Eurostat’s euro area HICP flash estimate for May 2023, earlier national flash estimate releases covering over 80% of the euro area were included in the projections. The current projection exercise covers the period 2023-25. Projections over such a long horizon are subject to very high uncertainty, and this should be borne in mind when interpreting them. See the article entitled “The performance of the Eurosystem/ECB staff macroeconomic projections since the financial crisis”, Economic Bulletin, Issue 8, ECB, 2019. See also http://www.ecb.europa.eu/pub/projections/html/index.en.html for an accessible version of the data underlying selected tables and charts. A full database of past ECB and Eurosystem staff macroeconomic projections is available at https://sdw.ecb.europa.eu/browseSelection.do?node=5275746.
The June 2023 Eurosystem staff projections entail euro area real GDP growth of 0.1% in the first quarter of 2023, which is 0.2 percentage points above Eurostat’s estimate released on 8 June 2023, after the cut-off date for the projections. This discrepancy largely relates to the fact that the projections for several smaller euro area countries with especially volatile quarterly data, often subject to notable revisions, are conducted at annual frequency and interpolated for the purposes of producing quarterly projections for the euro area. This approach implies a smoother quarterly profile than may be observed in official Eurostat estimates, which are based on quarterly information for all euro area countries. Moreover, some country data became available only after the cut-off date of the June 2023 projections.
See the box entitled “A model-based assessment of the macroeconomic impact of the ECB’s monetary policy tightening since December 2021”, Economic Bulletin, Issue 3, ECB, 2023.
The assumption for euro area ten-year nominal government bond yields is based on the weighted country average of ten-year benchmark bond yields, weighted by annual GDP figures and extended by the forward path derived from the ECB’s euro area all-bonds ten-year par yield, with the initial discrepancy between the two series kept constant over the projection horizon. The spreads between country-specific government bond yields and the corresponding euro area average are assumed to be constant over the projection horizon.
The technical assumptions for commodity prices are based on the path implied by futures markets, taking the average of the two-week period ending on the cut-off date of 23 May 2023.
See the box entitled “Intangible assets of multinational enterprises in Ireland and their impact on euro area GDP”, Economic Bulletin, Issue 3, ECB, 2023.
For more information on the GDP deflator decomposition and the role of unit profits for inflation analysis, see Arce, O., Hahn, E. and Koester, G., “How tit-for-tat inflation can make everyone poorer”, ECB Blog, 30 March 2023, as well as the box by E. Hahn, entitled “How do profits shape domestic price pressures in the euro area?”, Economic Bulletin, Issue 6, ECB, 2019, and the box by E. Hahn entitled “The role of profit margins in the adjustment to the COVID-19 shock”, Economic Bulletin, Issue 2, ECB, 2021.
-
15 June 2023
-
29 June 2023