
Eurosystem staff macroeconomic projections for the euro area, June 2025
1 Overview
The outlook for euro area economic growth is clouded by trade tensions and elevated global uncertainty. For 2025 as a whole, these effects are seen to be partly compensated by stronger than expected economic activity in the first quarter, which likely reflects in part the frontloading of exports in anticipation of higher tariffs. In the medium term economic activity is seen to be supported by the recently announced new fiscal measures. The baseline assumes that US tariffs on EU goods, which have increased to 10%, will remain in place over the entire projection horizon. Together with the elevated trade policy uncertainty and the recent appreciation of the euro, the higher tariffs will weigh on euro area exports and investment, and, to a lesser extent, on consumption. By contrast, new government spending on infrastructure and defence, mainly in Germany, should bolster euro area domestic demand from 2026. Overall, the conditions remain in place for euro area GDP growth to strengthen over the projection horizon. In particular, rising real wages and employment, less restrictive financing conditions – mainly reflecting recent monetary policy decisions – and a rebound in foreign demand later in the horizon should all support a gradual recovery. Annual average real GDP growth is expected to be 0.9% in 2025, 1.1% in 2026 and 1.3% in 2027. Compared with the March 2025 ECB staff macroeconomic projections, the outlook for GDP growth is unrevised for 2025, reflecting better than expected incoming data which are seen to be largely offset by the effects of the trade tensions and the appreciation of the euro exchange rate. The trade tensions and the stronger exchange rate have resulted in a downward revision to growth for 2026, while growth is unrevised for 2027.[1]
While headline inflation, as measured by the Harmonised Index of Consumer Prices (HICP), is likely to stay below 2% in the near term, it is expected to return to target in the medium term. Inflation is projected to decline in the course of 2025 and to reach a trough of 1.4% in the first quarter of 2026, before returning to 2.0% in 2027. The decline in headline inflation over 2025 is seen to be driven in part by negative energy inflation following the recent decline in oil prices and wholesale natural gas prices. Energy inflation is expected to remain negative until 2027 when new climate change mitigation measures come into effect in the context of the new Emissions Trading System (ETS2). Following a temporary increase in the second quarter of 2025, food inflation is expected to fall to rates slightly above 2% in 2027. HICP inflation excluding energy and food (HICPX) is expected to decline, driven by the services component, as the effects of delayed price adjustments for some items fade out, wage pressures recede, and lower energy prices feed through the pricing chain. Wage growth should continue to follow its downward path as pressures to recoup past real wage losses fade. Coupled with a recovery in productivity growth, this is expected to lead to significantly slower unit labour cost growth. External price pressures, as reflected in import prices, are expected to remain moderate assuming that EU tariff policies remain unchanged, with some downward pressure stemming from the stronger euro and the decline in energy commodity prices over recent months. Compared with the March 2025 projections, the outlook for headline HICP inflation is revised down by 0.3 percentage points for both 2025 and 2026 on account of lower energy commodity price assumptions and the appreciation of the euro, while it is unrevised for 2027.
Table 1
Growth and inflation projections for the euro area
(annual percentage changes, revisions in percentage points)
June 2025 | Revisions vs March 2025 | |||||||
|---|---|---|---|---|---|---|---|---|
2024 | 2025 | 2026 | 2027 | 2024 | 2025 | 2026 | 2027 | |
June 2025 baseline | ||||||||
Real GDP | 0.8 | 0.9 | 1.1 | 1.3 | 0.0 | 0.0 | -0.1 | 0.0 |
HICP | 2.4 | 2.0 | 1.6 | 2.0 | 0.0 | -0.3 | -0.3 | 0.0 |
HICP excluding energy and food | 2.8 | 2.4 | 1.9 | 1.9 | 0.0 | 0.2 | -0.1 | 0.0 |
Alternative scenario – mild | ||||||||
Real GDP | 0.8 | 1.2 | 1.5 | 1.4 | 0.0 | 0.3 | 0.3 | 0.1 |
HICP | 2.4 | 2.0 | 1.7 | 2.1 | 0.0 | -0.3 | -0.2 | 0.1 |
Alternative scenario – severe | ||||||||
Real GDP | 0.8 | 0.5 | 0.7 | 1.1 | 0.0 | -0.4 | -0.5 | -0.2 |
HICP | 2.4 | 2.0 | 1.5 | 1.8 | 0.0 | -0.3 | -0.4 | -0.2 |
Notes: Real GDP figures refer to annual averages of seasonally and working day-adjusted data. Historical data may differ from the latest Eurostat publications owing to data releases after the cut-off date for the projections. Revisions are calculated from rounded figures. The alternative scenarios focus on US tariffs and trade policy uncertainty and are described in Box 2. Data for the June 2025 baseline are available for downloading, also at quarterly frequency, from the Macroeconomic Projection Database on the ECB’s website.
To illustrate the risks relating to US tariff policies and the current high uncertainty surrounding the euro area economic outlook, two scenarios have been prepared. A mild scenario foresees the removal of bilateral tariffs between the United States and the EU (i.e. “zero-for-zero” tariffs) and a rapid reduction in trade policy uncertainty to pre-2018 levels. Under such a scenario, growth would be 0.3-0.4 percentage points stronger in 2025-26 than in the baseline, while inflation would be marginally higher in 2026-27. A severe scenario foresees a further increase in US tariffs across the board (in line with the announcement of so-called “reciprocal” tariffs in the United States), symmetric retaliation by the EU and persistently higher trade policy uncertainty. Under such a scenario, the growth outlook would be considerably weaker throughout the projection horizon while inflation would be lower – especially later in the horizon. These scenarios are detailed in Box 2.
2 The international environment
The higher tariffs imposed by the US Administration, together with elevated trade policy uncertainty, are shaping the global economic outlook.[2] Since the finalisation of the March 2025 ECB staff projections, the effective tariff rate on goods and services imports in the United States has increased significantly. The baseline assumes that over the projection horizon US tariffs against the EU remain at the level announced on 9 April, tariffs against China remain at the levels announced on 12 May, and trade policy uncertainty gradually declines but remains elevated. The baseline assumptions for tariffs and trade policy uncertainty are presented in more detail in
Box 2.
The tariffs have a negative impact on the outlook for global growth. Global real GDP is projected to grow by 3.1% in 2025, down from the rate of 3.6% recorded last year. It is expected to decrease further, to 2.9% in 2026, before stabilising at 3.2% in 2027 (Table 2). Compared with the March 2025 projections, the growth outlook has deteriorated across all major economies, particularly the United States and China, as well as countries heavily exposed to the United States in terms of their exports (such as Canada and Mexico).
Table 2
(annual percentage changes, revisions in percentage points)
| June 2025 | Revisions vs March 2025 | ||||||
|---|---|---|---|---|---|---|---|---|
2024 | 2025 | 2026 | 2027 | 2024 | 2025 | 2026 | 2027 | |
World real GDP (excluding the euro area) | 3.6 | 3.1 | 2.9 | 3.2 | 0.2 | -0.3 | -0.3 | 0.0 |
Global trade (excluding the euro area)1) | 4.2 | 3.1 | 1.7 | 3.1 | -0.2 | -0.4 | -1.4 | -0.1 |
Euro area foreign demand2) | 3.5 | 2.8 | 1.7 | 3.1 | 0.1 | -0.4 | -1.4 | 0.0 |
World CPI (excluding the euro area) | 4.0 | 3.3 | 2.8 | 2.5 | -0.2 | 0.0 | 0.1 | 0.0 |
Export prices of competitors in national currency3) | 2.5 | 1.8 | 2.6 | 2.3 | 0.2 | 0.1 | 0.3 | 0.2 |
Note: Revisions are calculated from rounded figures.
1) Calculated as a weighted average of imports.
2) Calculated as a weighted average of imports of euro area trading partners. The downward revisions to euro area foreign demand are smaller (unchanged for 2025, revised down by 1.1 percentage points for 2026), if the estimated impact of lower bilateral trade between the United States and China, owing to changes in tariffs since the March 2025 projections, is considered.
3) Calculated as a weighted average of the export deflators of euro area trading partners.
Global trade growth is projected to decrease to 3.1% this year and to 1.7% in 2026, but is expected to recover thereafter. The figure for 2025 is significantly boosted by strong trade growth in the first quarter, as US imports spiked in anticipation of the imposition of the tariffs. The sharp slowdown thereafter reflects the unwinding of this frontloading, compounded by the negative impact of the tariffs themselves and elevated trade policy uncertainty. The latter is expected to trigger a shift towards a less trade-intensive composition of global demand as it weighs on investment spending that thus affects trade in capital goods. World import growth has been revised down by 0.4 percentage points for 2025 and by 1.4 percentage points for 2026 compared with the March projections, largely owing to the tariffs.
Euro area foreign demand has also been significantly revised down compared with the March projections. Growth in euro area foreign demand is expected to decline to 2.8% in 2025, from 3.5% in 2024, and to weaken further to 1.7% in 2026, before recovering to 3.1% in 2027. Compared with the March 2025 projections, euro area foreign demand growth has been significantly revised down, by 0.4 percentage points for 2025 and by 1.4 percentage points for 2026. These revisions also relate to the impact of trade displacement between the United States and China owing to higher tariffs, which does not accurately reflect potential foreign demand directed to the euro area. When the estimated impact of lower bilateral trade between the United States and China, owing to changes in tariffs since the March 2025 projections, is accounted for, downward revisions to growth in euro area foreign demand are smaller.
Global consumer price inflation is projected to moderate over the projection horizon, notwithstanding the higher projected inflation in the United States reflecting tariffs. Among advanced economies, in addition to the United States, inflation in the United Kingdom has been revised up for 2025, owing to the higher than previously expected outturns in recent months and more dynamic wage growth. Inflation projections for emerging market economies have also been revised up slightly, reflecting in particular adverse structural developments in Russia and the impact of the sharp depreciation of the Turkish lira on inflation in Türkiye. In annual terms, global inflation is projected to remain on a downward trajectory, moderating to 3.3% this year from 4.0% in 2024, and declining further to 2.8% in 2026 and 2.5% in 2027. Compared with the March projections, it has been revised up by 0.1 percentage points for 2026.
Export prices of euro area competitors are projected to increase at a pace that is below, but close to, the historical average level. Growth in euro area competitors’ export prices (in national currencies and in annual terms) was 2.5% in 2024, marking a return to positive territory, as the impact from the past declines in commodity prices and pipeline pressures dissipated. Competitors’ export prices are projected to increase by 1.8% in 2025, 2.6% in 2026 and 2.3% in 2027. Growth in 2025 is comparable to the rate foreseen in the March 2025 projections. The impact of slightly higher than expected outturns in the first quarter of 2025 and the indirect effects of tariffs, owing to increased costs of intermediate inputs, are both seen to contribute to raising the export prices of euro area competitors this year. However, this impact is largely offset by other factors, such as lower commodity price assumptions. Euro area competitors’ export prices have been revised up by 0.3 percentage points for 2026 and 0.2 percentage points for 2027 compared with the March projections.
The risks surrounding the baseline are closely linked to developments in trade policies and the associated uncertainty. If the US tariffs are increased and trading partners retaliate, this could dampen global economic activity, and hence euro area foreign demand, and increase inflation. Conversely, a successful outcome of negotiations between the US Administration and its trading partners could lead to lower tariffs, thereby supporting growth and reducing inflationary pressures in the United States. A recession in the United States would imply negative spillovers to growth in other economies and would also reduce inflationary pressures in the global economy. For further details on the impact of alternative scenarios, see Box 2.
Box 1
Technical assumptions
Compared with the March 2025 projections, the main changes to the technical assumptions are notably lower commodity prices, a significantly stronger exchange rate, and higher long-term interest rates. Oil price assumptions have been revised down by almost 11% for 2025-26, with oil prices declining further in the short term before increasing slightly from the beginning of 2026, implying upward pressures on inflation in 2027. The assumption for wholesale gas prices has been revised down by 24.4% for 2025, by 17.6% in 2026 and by 7.7% in 2027. The euro has appreciated by 8.3% against the US dollar and by 3.9% in nominal effective terms since the previous projections. The assumptions for short-term interest rates are broadly unchanged, whereas those for long-term interest rates have been revised up by around 30-40 basis points on average over 2025-27.
Table
Technical assumptions
| June 2025 | Revisions vs March 2025 | |||||
|---|---|---|---|---|---|---|---|
2024 | 2025 | 2026 | 2027 | 2025 | 2026 | 2027 | |
Commodities: | |||||||
Oil price (USD/barrel) | 82.0 | 66.7 | 62.8 | 64.2 | -10.7 | -10.6 | -6.5 |
Natural gas prices (EUR/MWh) | 34.4 | 38.0 | 33.2 | 29.3 | -24.4 | -17.6 | -7.7 |
Wholesale electricity prices (EUR/MWh) | 77.7 | 82.3 | 77.5 | 71.8 | -18.2 | -10.1 | -5.3 |
EU Emissions Trading System 1 (ETS1) allowances (EUR/tonne) | 65.2 | 71.4 | 73.2 | 75.4 | -11.4 | -12.0 | -11.8 |
EU Emissions Trading System 2 (ETS2) allowances (EUR/tonne) | - | - | - | 59.0 | - | - | 0.0 |
Non-energy commodity prices, in USD (annual percentage change) | 9.2 | 6.8 | -0.4 | 0.6 | -5.2 | 0.9 | 3.4 |
Exchange rates: | |||||||
USD/EUR exchange rate | 1.08 | 1.11 | 1.13 | 1.13 | 6.6 | 8.3 | 8.3 |
Euro nominal effective exchange rate (EER41) (Q1 1999 = 100) | 124.1 | 126.1 | 127.1 | 127.1 | 3.1 | 3.9 | 3.9 |
Financial assumptions: | |||||||
Three-month EURIBOR (percentage per annum) | 3.6 | 2.1 | 1.9 | 2.2 | 0.0 | -0.1 | 0.1 |
Ten-year government bond yields (percentage per annum) | 2.9 | 3.1 | 3.4 | 3.6 | 0.3 | 0.4 | 0.4 |
Notes: Revisions are expressed as percentages for levels and as percentage points for growth rates and percentages per annum. Revisions for growth rates and interest rates are calculated on figures rounded to one decimal place, while revisions reported as percentage changes are calculated on unrounded figures. The technical assumptions about euro area interest rates and commodity prices are based on market expectations, with a cut-off date of 14 May 2025. Oil prices refer to Brent crude oil spot and futures prices. Gas prices refer to the Dutch TTF gas spot and futures prices. Electricity prices refer to the average wholesale spot and futures price for the five largest euro area countries. The “synthetic” future price for ETS1 allowances (EUA) is derived as the end-of-month linearly interpolated value of the two nearest European Energy Exchange EUA futures. Monthly EUA futures prices are then averaged to produce an equivalent to annual frequency. In the absence of trading of ETS2 allowances, the price assumptions were set by staff at the threshold price above which additional allowances will be released, with the price updated to 2027 prices (for further details, see the box entitled “Assessing the impact of climate change transition policies on growth and inflation” in the December 2024 Eurosystem staff projections report). The paths of commodity prices are implied by futures markets in the ten working days ending on the cut-off date. Bilateral exchange rates are assumed to remain unchanged over the projection horizon at the average levels prevailing in the ten working days ending on the cut-off date. The assumptions for euro area ten-year nominal government bond yields are based on the average of countries’ ten-year bond yields, weighted by annual GDP figures. Where the necessary data exist, the country-specific ten-year nominal government bond yields are defined as the ten-year benchmark bond yields prolonged using the forward par yields derived, on the cut-off date, from the corresponding country-specific yield curves. For the other countries, the country-specific ten-year government bond yields are defined as the ten-year benchmark bond yield prolonged using a constant spread (observed on the cut-off date) over the technical euro area risk-free long-term interest rate assumption.
Box 2
US tariffs and trade policy uncertainty
Higher US tariffs, potential retaliatory measures by other countries and trade policy uncertainty pose significant risks to the euro area economic outlook. The June 2025 projections assume that tariffs remain at the May 2025 level over the projection horizon and that uncertainty will remain elevated, though gradually declining. This box reports the macroeconomic impacts of these assumptions on the baseline projections, as well as in two alternative illustrative scenarios: (i) a mild scenario of lower tariffs and a faster unwinding of trade policy uncertainty; and (ii) a severe scenario of higher tariffs and more persistently elevated trade policy uncertainty.
The baseline assumes that US tariffs on goods imports are higher than in the March 2025 projections. All tariff pauses at the time of the finalisation of the projections are assumed to continue. US tariffs for goods imports would increase from almost zero by 10 percentage points for all countries – except China, for which these would increase by about 20 percentage points to an effective tariff rate of approximately 40% (when measured for both goods and services). Additionally, it is assumed that the EU does not retaliate, while China retaliates symmetrically (Chart A, panel a).[3] Trade policy uncertainty is expected to remain elevated throughout the projection horizon, but is assumed to decline to 2018 levels by the end of 2027 (Chart B, panel a).
The mild scenario assumes that as of the third quarter of 2025 the EU and the United States would reach a deal on eliminating bilateral tariffs. In addition, the United States would further reduce its tariffs on China, while China would remove all of its retaliatory tariffs against the United States. Other bilateral tariffs between the United States and the rest of the world would remain unchanged compared with the baseline, leading to an effective US tariff rate of 13% on goods and services (Chart A, panel a). Trade policy uncertainty would decline from the third quarter of 2025 to reach its long-term pre-2018 average in 2027 (Chart B, panel a).
The severe scenario assumes that US tariffs would return to the elevated levels announced on 2 April and that the EU would retaliate by imposing tariffs on imports of US goods (Chart B, panel a). Furthermore, US tariffs against China would remain at the high level observed before the pause from 12 May at almost 120% (Chart A, panel a). Overall, this would imply an effective US tariff rate on goods and services of 28%.[4] Trade policy uncertainty would remain high (Chart B, panel a).
Chart A
Effective tariff rates
a) Effective tariff rates on imports of goods and services | b) Effective tariff rate on US imports from the euro area |
(percentages and percentage point contributions) | (index, quarterly averages) |
 |  |
Sources: Panel a): Conteduca and Mancini (2025), EPII MAcMap-HS6, Fajgelbaum et al. (2024), WITS, CEPII BACI, and ECB staff calculations; panel b): WITS, Trade Data Monitor, ECB balance of payments statistics, and ECB staff calculations
Notes: Panel a) shows the weighted average of product-level tariff rates, using 2023 trade flows. The green bars refer to the mild scenario (China 10%, EU 0%, Canada and Mexico 25% for non-USCMA goods, rest of the world 10% and worldwide sectoral tariffs). The blue (yellow) diamonds represent the baseline tariff level in the June 2025 (March 2025) projections. The delta of the severe scenario to the mild scenario is shown by the red bars. For panel b), the latest observation is for April 2025. Panel b) shows the weighted average of product-level tariff rates, using 2024 trade flows, for each scenario.
Macroeconomic effects of US tariffs
(i) Baseline
Following a pick-up in euro area exports owing to frontloading by firms in anticipation of higher tariffs, the baseline projections expect US tariffs to dampen euro area exports and GDP growth. This uptick in the first quarter of 2025 owing to the frontloading of US imports could extend into the second quarter (Chart B, panel b). However, this is expected to be short-lived as the 10% US tariff on goods imports from the EU, together with lower growth resulting from tariffs on third countries, would dampen euro area export growth over the projection horizon.[5] Moreover, the spike in trade policy uncertainty is expected to dampen exports, especially on account of the negative impact on investment in capital goods abroad, but also domestic investment and, albeit to a lesser extent, consumption. As a result, euro area GDP growth is assessed to be overall almost 0.7 percentage points lower cumulatively over 2025-27, while the impact of US tariffs and uncertainty on euro area HICP inflation is seen as rather contained (Chart C).[6]
Chart B
Assumptions for developments in uncertainty and recent developments in euro area exports
a) Trade policy uncertainty assumptions | b) Euro area goods export volumes |
(index, quarterly averages) | (three-month-on-three-month percentage changes) |
 |  |
Sources: Panel a): Caldara et al. (2019) and ECB staff calculations. Panel b): Eurostat and ECB staff calculations.
Notes: For panel a), the latest observation is for April 2025. For panel b), the underlying data are seasonally adjusted. As data on euro area export volumes for March 2025 were not available at the cut-off date, the latest data point is approximated by deflating March values with industrial export prices. The latest observations are for March 2025.
Chart C
Impact of changes in tariffs and trade policy uncertainty since the cut-off date for the March 2025 projections on the June 2025 baseline projections
a) Total impact on real GDP growth | b) Total impact on HICP inflation |
(percentage points) | (percentage points) |
 |  |
Sources: Eurosystem staff calculations.
Note: The estimates do not include the impact of tariffs and policy uncertainty on the technical assumptions shown in Box 1.
(ii) Mild scenario
Under the mild scenario, there would be a significant improvement in the euro area growth outlook relative to the baseline while the impact on inflation would be limited. The implications for the US economy and the global economy are quantified in both the mild and severe scenarios using the ECB-Global model with endogenous US monetary policy as deviations from the baseline. In the mild scenario, the lower tariffs and lower trade policy uncertainty would have only a small impact on growth and inflation in the United States and China (Chart D). In the euro area, using the ECB-BASE for the simulations, GDP growth would be somewhat stronger, especially in 2025-26, mainly reflecting the drop in trade policy uncertainty. Inflation would be marginally higher than in the baseline in the latter part of the projection horizon, mainly reflecting stronger activity (Chart E).
(iii) Severe scenario
Under the severe scenario, the United States and China would face pronounced macroeconomic effects. Higher tariffs are projected to push up consumer prices, with US inflation rising by about 0.5 percentage points in 2025-26 (Chart D, panel a). There would be no increase in US exports to other countries, but there would be a slight increase in US imports from other countries. Higher trade policy uncertainty would further dampen growth. US real GDP growth would be about 0.7 percentage points lower than in the baseline in 2026. China would also be negatively affected in the severe scenario. The imposition of high US tariffs on China and retaliation by China against the United States would sharply reduce bilateral trade but there would be an increase in Chinese exports to other countries, including the euro area. Chinese real GDP growth would be 0.6 percentage points lower in 2025 and 0.3 percentage points lower in 2026, which would dampen inflation in 2026 (Chart D, panel b).
Chart D
Macroeconomic implications for the United States and China in the mild and severe scenarios
a) United States | b) China |
(percentage point deviation from baseline) | (percentage point deviation from baseline) |
 |  |
Sources: ECB staff calculations based on ECB-Global model simulations with endogenous US monetary policy and a managed exchange rate for China.
Euro area growth would also be weaker, as would inflation, as the upward impact from higher tariffs on US imports would be more than offset by the impact of weaker demand (Chart E, panel a). Weaker euro area foreign demand would dampen euro area growth, despite some positive impact from trade diversion. The tariff escalation would also raise trade policy uncertainty, which would weigh on investment decisions within the euro area. This would further weaken demand, amplifying the direct effects of the tariffs. Overall, the severe scenario would result in a drop in euro area GDP growth to 0.5% in 2025, 0.7% in 2026 and 1.1% in 2027, cumulatively about 1 percentage point below GDP growth in the baseline, with inflation at 1.8% in 2027 compared with 2.0% in the baseline.
Chart E
Macroeconomic implications for the euro area in the mild and severe scenarios and sourcing from China
a) Euro area | b) Existing sourcing from China |
(percentage point deviation from baseline annual growth rate) | (shares) |
 |  |
Sources: Panel a): ECB staff calculations based on ECB-BASE model simulations with exogenous euro area monetary policy and exchange rates. Panel b): Panon et al. (2024) (blue bars), Trade Data Monitor (yellow bars).
Notes: In panel b) the blue bars are calculated using firm-level trade data of exporting firms for 2019 (see Panon et al., 2024). No firm-level data are available for Germany. The yellow bars show the share of products at the six-digit level of the World Customs Organization’s Harmonised System classification that were sourced from China (in addition to other countries) in 2024.
The redirection of Chinese exports to the euro area poses a potential further downside risk to inflation beyond those entailed in the severe scenario. The euro area could be a key destination for any redirected Chinese exports, as the composition of these exports to the euro area is similar to the composition of exports to the United States. Moreover, around 80% of products imported into large euro area countries are already supplied by China, and firm-level data indicate that over two-fifths of firms in the region import Chinese goods (Chart E, panel a). The rapid expansion of Chinese distribution networks in the euro area would further facilitate a redirection. Chinese government support for exporters and the ability to compress profit margins would further underpin a redirection. While EU anti-dumping measures could mitigate this effect, the lengthy period required for their implementation might delay the response. Therefore, these dynamics could potentially amplify the downward pressures on inflation in the euro area in the severe scenario.
3 Real economy
Euro area economic activity increased by 0.3% in the first quarter of 2025, surprising slightly to the upside compared with the March projections (Chart 1) mainly owing to a strong impulse from the frontloading of exports. Domestic demand, driven by private consumption, likely made a positive contribution to growth in the first quarter, as did net trade. Real GDP growth was 0.1 percentage points above the rate foreseen in the March projections, mostly owing to the stronger than expected exports. Across sectors, industrial activity likely picked up in the first quarter, supported by a recovery in demand for goods owing to improving real incomes and frontloading of purchases in anticipation of tariffs, while activity in the services sector likely continued to increase.
Chart 1
a) Real GDP growth | b) Real GDP levels |
|---|---|
(quarter-on-quarter percentage changes, seasonally and working day-adjusted quarterly data) | (chain-linked volumes (2020); EUR billions) |
 |  |
Notes: Historical data may differ from the latest Eurostat publications owing to data releases after the cut-off date for the projections. The vertical line indicates the start of the current projection horizon. In panel a) the ranges shown around the central projections provide a measure of the degree of uncertainty and are symmetric by construction. They are based on past projection errors, after adjustment for outliers. The bands, from darkest to lightest, depict the 30%, 60% and 90% probabilities that the outcome of real GDP growth will fall within the respective intervals. For more information, see the box entitled “Illustrating the uncertainty surrounding the projections” in the March 2023 ECB staff macroeconomic projections for the euro area.
Growth is expected to slow in the second and third quarters of 2025, as the unwinding of the frontloading of exports in the first quarter is compounded by new tariffs and by significant trade policy uncertainty. The composite output Purchasing Managers’ Index (PMI) fell to 50.2 in May and points to a sectoral shift: the industrial sector shows signs of a recovery, with a manufacturing output PMI of 51.5 while the services PMI indicates stagnation. The European Commission’s Economic Sentiment Indicator improved in May following two months of decline, but remains at low levels. The industrial production data for March suggest that frontloading effects in anticipation of tariffs boosted production significantly at the end of the first quarter. The baseline assumes that over the projection horizon US tariffs against the EU remain at the level announced on 9 April, and trade policy uncertainty gradually declines but remains elevated. Box 2 provides further details on the impact of tariffs and trade policy uncertainty in the baseline. Overall, growth is expected to moderate in the second quarter and turn slightly negative in the third quarter, as the effects of the unwinding of the strong export growth in the first quarter are compounded by the impact of tariffs on exports and by policy uncertainty. As a result of these factors, significant volatility is anticipated in quarterly growth dynamics and the path is particularly uncertain. Outturns over recent quarters imply that acquired growth (i.e. the annual average growth rate if GDP were to remain at the level recorded in the first quarter) stands at 0.8% and therefore accounts for most of the projected growth of 0.9% for 2025.
In the medium term real GDP growth is expected to strengthen, supported by improving real disposable income, the gradual decline in uncertainty and a recovery in foreign demand as adverse tariff effects fade (Table 3). A further increase in households’ purchasing power, owing to resilient wage and employment growth as well as easing inflation, and some decline in the household saving rate should sustain private consumption growth. The resilient, albeit cooling, labour market and the assumed gradual recovery in consumer confidence towards its historical norm over the medium term should also support private consumption growth. Investment is projected to gradually strengthen over the projection horizon, mostly reflecting a gradual dissipation of uncertainty, the deployment of Next Generation EU (NGEU) funds and improving demand conditions. In addition to the weakness in foreign demand, trade policy uncertainty (via weaker global investment and an unfavourable composition of foreign demand with respect to euro area exports), together with the appreciation of the euro compounding the protracted euro area competitiveness issues, implies continued losses in export market shares.
Table 3
Real GDP, trade and labour market projections
(annual percentage changes, unless otherwise indicated, revisions in percentage points)
| June 2025 | Revisions vs March 2025 | ||||||
|---|---|---|---|---|---|---|---|---|
2024 | 2025 | 2026 | 2027 | 2024 | 2025 | 2026 | 2027 | |
Real GDP | 0.8 | 0.9 | 1.1 | 1.3 | 0.0 | 0.0 | -0.1 | 0.0 |
Private consumption | 1.0 | 1.2 | 1.2 | 1.2 | 0.0 | -0.2 | 0.0 | 0.0 |
Government consumption | 2.6 | 1.6 | 1.2 | 1.0 | 0.1 | 0.4 | 0.1 | 0.0 |
Investment | -1.8 | 0.7 | 1.7 | 1.9 | 0.0 | -0.5 | 0.0 | 0.5 |
Exports1) | 1.1 | 0.5 | 1.6 | 2.6 | 0.2 | -0.3 | -0.7 | -0.1 |
Imports1) | 0.2 | 1.9 | 2.0 | 2.7 | 0.1 | 0.0 | -0.6 | -0.1 |
Contribution to GDP from: | ||||||||
Domestic demand | 0.7 | 1.2 | 1.3 | 1.3 | 0.0 | 0.0 | 0.0 | 0.1 |
Net exports | 0.4 | -0.6 | -0.1 | 0.1 | 0.0 | -0.1 | -0.1 | 0.0 |
Inventory changes | -0.3 | 0.4 | 0.0 | 0.0 | 0.0 | 0.3 | 0.0 | 0.0 |
Real disposable income | 2.2 | 0.8 | 1.0 | 0.8 | -0.3 | -0.1 | 0.2 | 0.1 |
Household saving ratio (% of disposable income) | 15.0 | 14.7 | 14.5 | 14.1 | -0.1 | 0.0 | 0.1 | 0.1 |
Employment2) | 1.0 | 0.6 | 0.5 | 0.6 | 0.1 | 0.2 | 0.1 | 0.2 |
Unemployment rate | 6.4 | 6.3 | 6.3 | 6.0 | 0.0 | 0.0 | 0.0 | -0.2 |
Current account (% of GDP) | 2.7 | 2.7 | 2.6 | 2.6 | 0.1 | 0.7 | 0.4 | 0.3 |
Notes: Real GDP and components refer to seasonally and working day-adjusted data. Historical data may differ from the latest Eurostat publications owing to data releases after the cut-off date for the projections. Revisions are calculated from rounded data. Data are available for downloading, also at quarterly frequency, from the Macroeconomic Projection Database on the ECB’s website.
1) This includes intra-euro area trade.
2) Persons employed.
Recently announced measures related to defence and infrastructure spending should bolster growth in the medium term. The macroeconomic effects of new defence and infrastructure spending incorporated into the baseline (amounting to almost €120 billion over 2025-27, somewhat above 0.7% of GDP[7]) are expected to boost euro area GDP growth by 0.25 percentage points cumulatively, mainly in the second half of the projection horizon. Germany, contributing around 80% of this spending, will see the most significant effects.[8] In terms of composition, the largest share (above half) of the total additional euro area spending is classified as government investment, followed by government consumption (around 40%, mainly comprising intermediate consumption and compensation of public employees). The high-tech nature of military products implies that defence spending may heavily rely on imports until EU-wide production capacity targets are met.
The impact of past monetary policy tightening on growth is estimated to have peaked in 2024 and is expected to fade over the projection horizon, supported by the decline in policy rates. The impact of the monetary policy measures taken between December 2021 and September 2023 continues to feed through to the real economy. However, most of the downward impact on growth should have already materialised. Following the policy rate cuts since June 2024 and based on market expectations regarding the future path of interest rates at the time of the cut-off date for the projections (Box 1), the dampening impact of monetary policy on economic growth is expected to gradually fade in 2025. However, there is considerable uncertainty surrounding the magnitude and the time profile of this impact.
Compared with the March 2025 projections, real GDP growth is unrevised for 2025 and 2027, but has been revised down slightly for 2026 (Table 3, Chart 2 and Chart 3). The unrevised projection for 2025 reflects the combination of a positive carry-over effect stemming from data outturns up to the first quarter of 2025 and the downward revisions to growth in the second and third quarters of 2025 owing to higher tariffs, the related uncertainty, and the appreciation of the euro. Trade tensions, uncertainty and the appreciation of the euro are also responsible for the 0.1 percentage point downward revision to growth for 2026, to 1.1% (following the 0.2 percentage point downward revision entailed in the March projections), while additional defence and infrastructure spending yielded some positive momentum in terms of within-year quarterly growth. The annual average growth rate for 2027 has remained unrevised at 1.3%.
Chart 2
Euro area real GDP growth – decomposition into the main expenditure components
a) June 2025 projections | b) Revisions vs March 2025 projections |
|---|---|
(annual percentage changes and percentage point contributions) | (percentage points and percentage point contributions) |
 |  |
Notes: Data are seasonally and working day-adjusted. Historical data may differ from the latest Eurostat publications owing to data releases after the cut-off date for the projections. The vertical line indicates the start of the current projection horizon. Revisions are calculated based on unrounded figures.
Chart 3
Revisions to real GDP growth projections compared with the March 2025 projections
(percentage points)

Note: Revisions are calculated based on unrounded figures.
Private consumption is expected to weather the adverse impact from US trade policies, supported by robust increases in income on the back of rising wages and falling inflation. Private consumption growth moderated in the fourth quarter of 2024, owing to the unwinding of temporary factors that had supported its expansion in the summer (e.g. seasonal factors and the Paris 2024 Olympics). Household spending should strengthen from an annual rate of increase of around 0.8% in 2023-24 to stand at 1.2% in 2025-27. Private consumption growth will be mainly driven by rising real disposable income, supported by increases in both wage and non-wage income – in particular, income from self-employment (Chart 4). In addition, private consumption growth should benefit from a moderate decline in the saving ratio as consumer spending and savings gradually normalise. An expected gradual recovery in consumer confidence over the medium term, amid overall favourable labour market prospects and consumption-smoothing behaviour – i.e. a delayed recovery in household spending in line with the increase in purchasing power – may contribute to the gradual decline in the saving ratio. However, the household saving ratio is expected to remain elevated, reflecting the fact that household lending rates remain somewhat above the historical average and access to credit is still tight. Private consumption growth has been revised down by 0.2 percentage points for 2025, relative to the March 2025 projections, amid increasing policy uncertainty.
Chart 4
Household consumption, income and savings
(annual percentage changes and percentage point contributions)
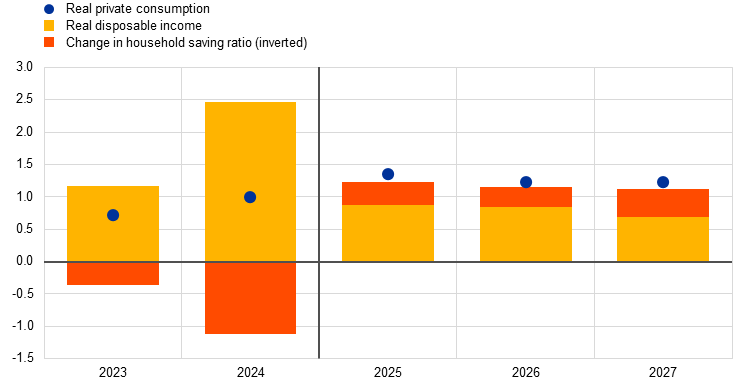
Notes: Data are seasonally and working day-adjusted. An increase in the household saving ratio implies a negative contribution of savings to consumption growth. Historical data may differ from the latest Eurostat publications owing to data releases after the cut-off date for the projections. Statistical discrepancies between the national and sectoral accounts and their different publication schedules result in minor differences between the figures for private consumption growth and the respective contributions from income and the (inverted) change in the household saving ratio. The vertical line indicates the start of the current projection horizon.
Housing investment is estimated to have returned to positive growth in the first quarter of 2025, with momentum expected to strengthen somewhat over the projection horizon on the back of more favourable financing conditions and rising household real incomes. After a prolonged downturn that began in the second quarter of 2022, housing investment is estimated to have picked up again in the first quarter of 2025 and is expected to continue to grow in the coming quarters. The recovery in housing investment reflects improved housing demand, as also evidenced by the recent upturn in the number of building permits granted for residential buildings, and is attributable to the steady decline in mortgage rates since the end of 2023, supported by continued growth in household real income. Against the backdrop of reviving housing demand, housing investment growth is projected to strengthen in 2026 and 2027.
Weakened by high uncertainty in the short run, business investment is seen to gradually recover in the medium term as uncertainty declines, economic activity improves, and national and EU policies take effect. Euro area business investment is estimated to have contracted slightly in the first quarter of 2025 and is seen to fall further in the second quarter, amid elevated trade policy uncertainty, new tariffs and financial volatility. Investment is expected to gradually recover over the projection horizon as domestic and foreign demand picks up, uncertainty diminishes, financing conditions improve and the implementation of new national and EU policies incentivises additional private investment related to defence and infrastructure spending.
Higher tariffs, elevated uncertainty and competitive pressures, in particular stemming from the appreciation of the euro, are expected to weigh on the euro area’s export prospects. Tariffs on euro area exports to the United States, which account for 17% of the euro area’s total exports of goods, cloud the outlook for exports (see Box 2 for more details). In the first quarter exports increased markedly as firms frontloaded orders in anticipation of US tariffs. However, export growth is expected to moderate, with euro area exports struggling to keep pace with global demand and as the frontloading is unwound. This underperformance is also seen to stem from competitive pressures, which are expected to increase owing to higher US tariffs that will make euro area firms less competitive compared with their US counterparts, and owing to the appreciation of the euro. As a result, export growth is expected to remain subdued over the medium term, at rates below historical average levels. While a recovery in foreign demand could provide some support, persistent challenges such as competition from China – mainly in the automotive and machinery sectors – and still relatively high energy costs continue to cloud the outlook. Although the euro area may achieve some competitiveness gains in the United States relative to China, this is not expected to have a strong mitigating effect. Overall, extra-euro area exports have been revised down sharply, owing to US tariffs, trade policy uncertainty and the appreciation of the euro. On the import side, growth is projected to remain below long-term trends, driven in part by subdued exports and investment. Net trade is anticipated to make a negative contribution to euro area growth of -0.6 percentage points in 2025 and -0.1 percentage points in 2026, which is a downward revision of 0.1 percentage points for both years. In 2027 net trade is expected to make a small positive contribution to growth.
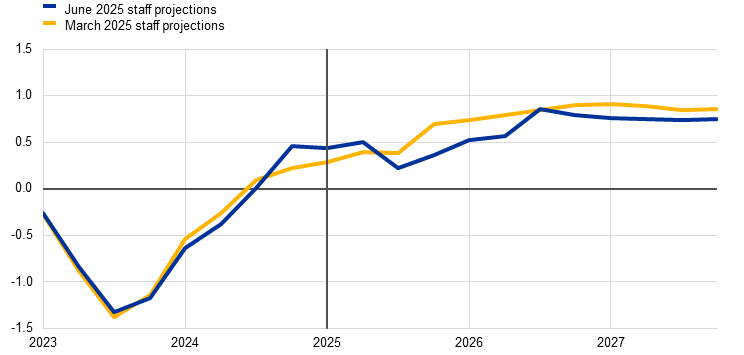
The labour market is set to remain resilient overall, although employment growth should slow in comparison with recent years. Employment grew modestly in the fourth quarter of 2024 but surprised on the upside in the first quarter of 2025. In annual terms, employment growth is expected to decline from 1.0% in 2024 to hover around 0.5-0.6% throughout the projection horizon (0.1-0.2 percentage points higher than foreseen in the March projections). The pattern in employment (Chart 5) reflects the assumption that cyclical factors which have supported employment more than usual over recent years, such as labour hoarding, high profit growth, relatively weak real wage growth, and robust labour force growth, will gradually fade away. Compared with the March projections, the phasing-out of some of these supportive factors is now assessed to become less pronounced. Consequently, employment growth is projected to be somewhat less responsive to GDP growth than was assumed in the previous projection exercise.
Chart 5
(index, Q1 2022 = 100)
Note: The vertical line indicates the start of the current projection horizon.
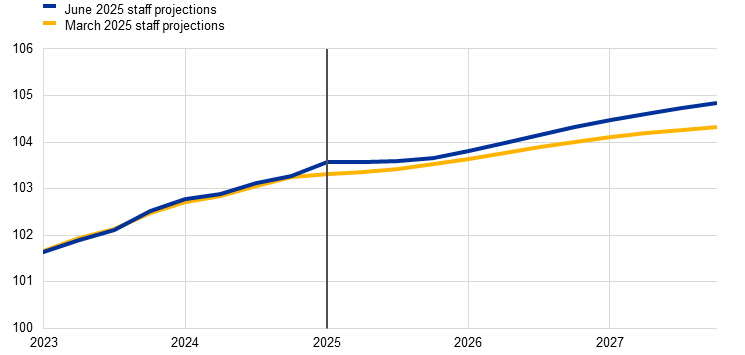
Labour productivity growth is expected to strengthen at a more moderate pace in 2025-27 than foreseen in the March projections. Productivity growth (per person employed) is expected to recover at a slower pace in 2025 than was foreseen in the March projections. It is seen to rise from -0.1% in 2024 to 0.4% in 2025 and 0.7%-0.8% in 2026-27, reflecting strengthening activity and moderating employment dynamics. This compares with historical average annual growth in productivity per person employed of 0.6% in the period 2000-19 (Chart 6). The speed of the recovery is also seen to be limited by structural factors, such as the gradual reallocation of economic activity towards the services sector, transition costs related to the greening of the economy, a lasting adverse impact from the energy price shock, a slow pace of adoption of highly innovative artificial intelligence-based technologies, and population ageing.
Chart 6
Labour productivity per person employed
a) Labour productivity level
(index, Q1 2022 = 100)
b) Labour productivity growth rate
(year-on-year growth)
Note: The vertical lines indicate the start of the current projection horizon.
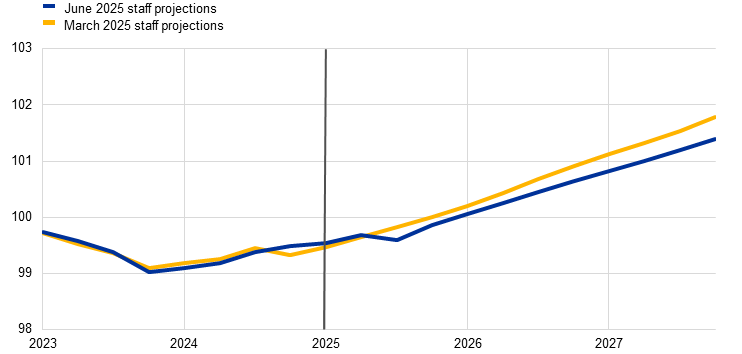
The unemployment rate is expected to decline to historically low levels over the projection horizon (Chart 7). The unemployment rate increased slightly in the first quarter of 2025, in line with the March projections. It is expected to increase marginally by the end of 2025. Thereafter the ongoing economic recovery, though modest, could lead to a renewed decline in the unemployment rate from the first quarter of 2026, reaching 6.0% in 2027. The unemployment rate has been revised down by 0.2 percentage points for 2027. Labour force growth is projected to moderate gradually throughout the horizon to well below the levels seen in recent years.
Chart 7
(percentage of labour force)

Note: The vertical line indicates the start of the current projection horizon.
4 Fiscal outlook
After tightening significantly in 2024, the euro area fiscal stance is projected to tighten only slightly in 2025, to loosen noticeably in 2026 and to tighten once again, somewhat more strongly, in 2027 (Table 4).[9] The strength of the fiscal tightening in 2024 was the result of sizeable non-discretionary factors, as well as the withdrawal of most of the energy and inflation support and other fiscal stimulus measures. The non-discretionary factors reflected strong revenue developments in some countries, mainly on account of composition effects (tax bases growing faster than nominal GDP) that are assessed, however, to be of a largely temporary nature. For 2025, the discretionary fiscal policy measures indicate a continued tightening, albeit at a much slower pace. This tightening reflects increases in social security contributions and indirect taxes, which are, however, largely offset by continued growth in public spending and fiscal loosening relating to non-discretionary factors.[10] For 2026, the fiscal stance is projected to loosen following recent government announcements, mainly on account of higher public investment and consumption, as well as lower direct taxation. For 2027, the tightening in the fiscal stance and discretionary measures primarily reflects lower assumed government spending related to the expiration of the grant financing under the Next Generation EU (NGEU) programme and some tightening of non-discretionary factors.[11]
Compared with the March 2025 projections, the discretionary fiscal policy measures incorporated into the baseline point to a significant cumulative fiscal loosening. This is mostly on account of fiscal policy measures in Germany and is related to higher defence and infrastructure spending, particularly in 2026-27. Moreover, continued support to Ukraine, lower direct and indirect taxation in Germany and, to some degree, higher projected defence spending and support to Ukraine in several other euro area countries, are contributing to this additional loosening. The revisions in discretionary fiscal policy measures broadly translate cumulatively into a looser fiscal stance over the projection horizon (-0.4 percentage points of GDP), with more limited revisions in non-discretionary factors acting in the opposite direction.
Table 4
Fiscal outlook for the euro area
(percentage of GDP; revisions in percentage points)
| June 2025 | Revisions vs March 2025 | ||||||
|---|---|---|---|---|---|---|---|---|
2024 | 2025 | 2026 | 2027 | 2024 | 2025 | 2026 | 2027 | |
Fiscal stance1) | 0.9 | 0.1 | -0.3 | 0.4 | 0.0 | -0.1 | -0.3 | 0.0 |
General government budget balance | -3.1 | -3.1 | -3.4 | -3.5 | 0.1 | 0.1 | -0.1 | -0.2 |
Structural budget balance2) | -3.1 | -3.1 | -3.4 | -3.5 | 0.0 | -0.1 | -0.3 | -0.4 |
General government gross debt | 87.5 | 88.4 | 89.6 | 90.3 | -0.2 | 0.0 | 0.3 | 0.4 |
Notes: Revisions are based on unrounded figures.
1) The fiscal stance is measured as the change in the cyclically adjusted primary balance net of government support to the financial sector. The figures shown are also adjusted for grants under the Next Generation EU (NGEU) programme, which do not have an impact on the economy on the revenue side. A negative (positive) figure implies a loosening (tightening) of the fiscal stance.
2) The structural budget balance is calculated as the government balance net of transitory effects of the economic cycle (or the cyclically adjusted primary balance, referenced above, plus interest payments) and net of measures classified under the European System of Central Banks definition as temporary.
The euro area budget balance is projected to decline to well below the -3% of GDP threshold and the debt ratio to rise above 90% by 2027 (Table 4). The 2024 euro area budget balance outcome, at -3.1% of GDP, was only slightly better than expected in the March projections. The budget balance is projected to remain unchanged in 2025 and to decline substantially in 2026 and to a lesser extent in 2027 (to -3.5% of GDP). The annual developments follow the path of the cyclically adjusted primary balance, which is affected by the fiscal stance developments described above. The cyclical component is estimated to be broadly neutral over the projection horizon. At the end of the projection horizon, the main factor behind the deterioration in the budget balance compared with 2024 is the steady increase in interest payments. Compared with the March projections, the budget balance has been revised down for 2026-27, despite a slightly better starting position in 2024. This revision reflects the additional fiscal policy loosening, mainly stemming from Germany. The euro area debt-to-GDP ratio is seen to be on an increasing path as the continuous primary deficits and positive deficit-debt adjustments more than offset favourable interest rate-growth differentials. Compared with the March projections, the debt ratio at the end of the horizon has been revised up, as higher primary deficits and deficit-debt adjustments more than offset a somewhat better starting position in 2024 and a more favourable interest rate-growth differential projected for 2027.
Euro area fiscal policy assumptions and projections continue to be surrounded by high uncertainty. This has several sources, including the ongoing geopolitical tensions and euro area governments’ concrete policy responses in the broader context of the EU fiscal framework. In many countries, discretionary fiscal policy risks stem from higher defence spending than was included in the baseline (although, in some countries, such risks may be compensated by consolidation measures to meet commitments under the Stability and Growth Pact).
5 Prices and costs
Headline inflation is expected to moderate and to average 2.0% in 2025 and 1.6% in 2026, before returning to 2.0% in 2027 (Chart 8). Headline inflation is seen to fall below 2% in the second quarter of 2025 and to continue to decline into early 2026, with a trough of around 1.4% and some short-term volatility due to energy-related base effects. This decline is driven by all the main components (Chart 9): energy, food and core inflation (the latter driven mainly by services). The increase in headline inflation to 2.0% in 2027 relates to a temporary upward impact from energy inflation, reflecting climate change transition-related fiscal measures, in particular the introduction of a new Emissions Trading System (ETS2). HICPX inflation is expected to decline until early 2026 and then to level off at around 1.9% for the remainder of the projection horizon.
Chart 8
(annual percentage changes)
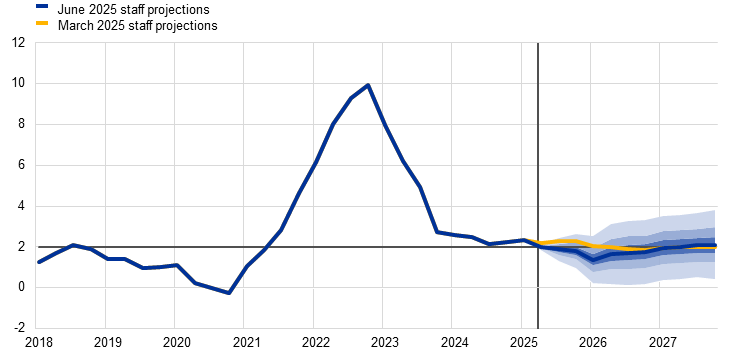
Notes: The vertical line indicates the start of the current projection horizon. The ranges shown around the central projections provide a measure of the degree of uncertainty and are symmetric by construction. They are based on past projection errors, after adjustment for outliers. The bands, from darkest to lightest, depict the 30%, 60% and 90% probabilities that the outcome of HICP inflation will fall within the respective intervals. For more information, see the box entitled “Illustrating the uncertainty surrounding the projections” in the March 2023 ECB staff macroeconomic projections for the euro area.
Chart 9
Euro area HICP inflation – decomposition into the main components
(annual percentage changes, percentage point contributions)
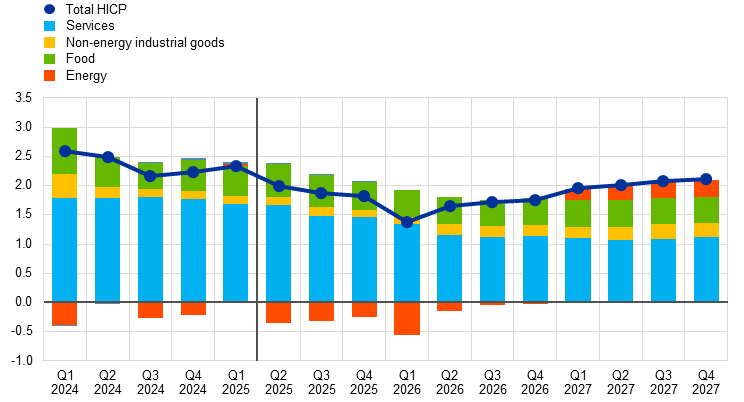
Note: The vertical line indicates the start of the current projection horizon.
Energy inflation is projected to remain negative until the end of 2026 and then to rebound in 2027 owing to climate change-related fiscal measures (Chart 10, panel a). Energy inflation is expected to turn negative again in the second quarter of 2025 and to remain negative until the end of 2026, driven by lower wholesale oil and gas prices as well as specific fiscal measures, such as the expected cut in electricity prices due to lower taxes and network fees in Germany. The increase in energy inflation from -2.1% in 2026 to 2.7% in 2027 largely reflects a temporary upward impact from the implementation of the EU “Fit for 55” package, specifically a new Emissions Trading Scheme (ETS2) for the heating of buildings and for transport fuels and, to a lesser extent, the expected increase in oil prices.
Food inflation is expected to increase temporarily in the second quarter of 2025, before edging down and moving broadly sideways from the first quarter of 2026 onwards (Chart 10, panel b). Food inflation is expected to increase to 2.9% in the second quarter of 2025, driven by an upward base effect and a sharp increase in unprocessed food prices, as well as by a large increase in food commodity prices. Food inflation is then projected to decline to an average of 2.4% in 2026 and 2.3% in 2027, clearly below its longer-term average, owing to declining commodity prices and receding labour cost pressures.
Chart 10
Outlook for HICP energy and food inflation
(annual percentage changes)

(annual percentage changes)
Note: The vertical line indicates the start of the current projection horizon.
Table 5
Price and cost developments for the euro area
(annual percentage changes, revisions in percentage points)
| June 2025 | Revisions vs March 2025 | ||||||
|---|---|---|---|---|---|---|---|---|
2024 | 2025 | 2026 | 2027 | 2024 | 2025 | 2026 | 2027 | |
HICP | 2.4 | 2.0 | 1.6 | 2.0 | 0.0 | -0.3 | -0.3 | 0.0 |
HICP excluding energy | 2.9 | 2.5 | 2.0 | 2.0 | 0.0 | 0.1 | -0.2 | 0.0 |
HICP excluding energy and food | 2.8 | 2.4 | 1.9 | 1.9 | 0.0 | 0.2 | -0.1 | 0.0 |
HICP excluding energy, food and changes in indirect taxes | 2.8 | 2.4 | 1.9 | 1.9 | 0.0 | 0.2 | -0.1 | 0.0 |
HICP non-energy industrial goods | 0.8 | 0.6 | 0.7 | 0.9 | 0.0 | -0.1 | -0.1 | 0.0 |
HICP services | 4.0 | 3.4 | 2.6 | 2.4 | 0.0 | 0.3 | -0.1 | -0.1 |
HICP energy | -2.2 | -2.3 | -2.1 | 2.7 | 0.0 | -3.8 | -2.2 | 0.4 |
HICP food | 2.9 | 2.7 | 2.4 | 2.3 | 0.0 | -0.1 | -0.2 | 0.1 |
GDP deflator | 2.9 | 2.3 | 2.0 | 2.1 | 0.0 | -0.2 | 0.0 | 0.1 |
Import deflator | -0.5 | 0.4 | 1.2 | 2.0 | 0.2 | -2.0 | -0.5 | 0.5 |
Compensation per employee | 4.5 | 3.2 | 2.8 | 2.8 | -0.1 | -0.2 | 0.0 | 0.2 |
Productivity per employee | -0.1 | 0.4 | 0.7 | 0.8 | 0.0 | 0.0 | -0.1 | -0.1 |
Unit labour costs | 4.7 | 2.8 | 2.1 | 2.0 | 0.0 | -0.2 | 0.1 | 0.3 |
Unit profits1) | -1.4 | 0.9 | 2.0 | 2.2 | 0.3 | -0.3 | 0.1 | -0.3 |
Notes: Revisions are calculated using figures rounded to one decimal place. The figures for the GDP and import deflators, unit labour cost, compensation per employee and productivity per employee refer to seasonally and working day-adjusted data. Historical data may differ from the latest Eurostat publications owing to data releases after the cut-off date for the projections. Data are available for downloading, also at quarterly frequency, from the Macroeconomic Projection Database on the ECB’s website.
1) Unit profits are defined as gross operating surplus and mixed income (adjusted for the income of the self-employed) per unit of real GDP.
HICPX inflation is expected to decline from 2.8% in 2024 to 1.9% in 2026-27 (Chart 11) as the effects of past large shocks on services inflation continue to fade. HICPX inflation has been edging down since early 2024 and is expected to moderate further as easing labour cost pressures have a moderating impact on price dynamics. Non-energy industrial goods inflation had already moderated to rates below historical averages in 2024 and is expected to increase slightly, returning to its average of around 1% over the medium term. Services inflation has been quite persistent, hovering around 4% since November 2023, but it is expected to decline gradually from 3.4%, on average, for 2025, to 2.6% for 2026 and 2.4% for 2027. This decline reflects the fact that the delayed adjustments to earlier general price increases are fading out and the moderation in labour cost pressures is feeding through. More generally, the disinflation process related to HICPX inflation is also consistent with the strong appreciation of the euro, a downward impact from moderating indirect effects of past energy price movements, and the continued feed-through of the downward impact from past monetary policy tightening.
Chart 11
Euro area HICP inflation excluding energy and food
(annual percentage changes)

Notes: The vertical line indicates the start of the current projection horizon. The ranges shown around the central projections provide a measure of the degree of uncertainty and are symmetric by construction. They are based on past projection errors, after adjustment for outliers. The bands, from darkest to lightest, depict the 30%, 60% and 90% probabilities that the outcome of HICPX inflation will fall within the respective intervals. For more information, see the box entitled “Illustrating the uncertainty surrounding the projections” in the March 2023 ECB staff macroeconomic projections for the euro area.
Compared with the March 2025 projections, the outlook for headline HICP inflation has been revised down by 0.3 percentage points for 2025 and 2026, while it is broadly unrevised for 2027 (Chart 12). The downward revision for 2025 is entirely driven by energy inflation due to weaker than expected data and lower oil, gas and electricity price assumptions. Energy inflation has also been revised down for 2026, in part owing to an administered electricity price-related measure in Germany. Moreover, both HICPX and food inflation have been revised down slightly, by 0.1 and 0.2 percentage points respectively, mainly on account of some downward effects from the stronger euro exchange rate and weaker energy commodity prices. Minor upward revisions to food and energy inflation for 2027 and unrevised HICPX inflation imply headline inflation is broadly unchanged.
Chart 12
Revisions to the inflation projection compared with the March 2025 projections
(annual percentage changes)

Note: The revisions are calculated based on unrounded figures.
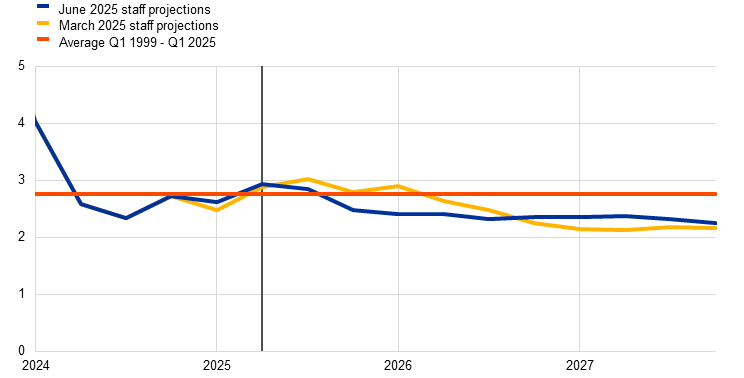
Nominal wage growth is projected to decline as pressure from inflation compensation fades. Growth in compensation per employee is estimated to have declined to 3.5% in the first quarter of 2025 (0.3 percentage points below the level foreseen in the March projections). It is projected to decline further, moderating from an average of 3.2% in 2025 to 2.8% in both 2026 and 2027 (Chart 13). This decline mainly reflects an expected decrease in negotiated wage growth (corroborated by the ECB wage tracker), which is partly offset by increasing wage drift. The wage share is expected to move broadly sideways over the horizon, remaining slightly above its longer-term average. Real wages are estimated to have returned to early 2021 levels in the third quarter of 2024. While this implies less pressure from inflation compensation, labour markets are still tight which helps explain why real wage growth remains somewhat elevated compared with historical levels (0.4% in the period from 1999 to 2024). Compared with the March 2025 projections, growth in compensation per employee has been revised down by 0.2 percentage points for 2025 but up by the same amount for 2027.
Chart 13
(annual percentage changes)

Note: The vertical line indicates the start of the current projection horizon.
Growth in unit labour costs is projected to decline further over the projection horizon, on account of falling wage growth and increasing productivity growth. Unit labour cost growth is estimated to have been 3.1% in the first quarter of 2025 and is expected to remain elevated initially, on account of low productivity growth, before falling sharply to an average of 2.1% in 2026 and 2.0% in 2027 (in line with the historical average). Compared with the March 2025 projections, growth in unit labour costs has been revised down by 0.2 percentage points for 2025 owing to lower wage growth, while the upward revisions of 0.1 percentage points for 2026 and 0.3 percentage points for 2027 are due to both higher wage growth and lower productivity growth.
Overall domestic price pressures, as measured by the growth of the GDP deflator, are projected to continue decreasing in 2025 and to level off in the second half of the projection horizon, as declining unit labour costs allow profit margins to increase (Chart 14). The annual growth rate of the GDP deflator is projected to decline gradually to an average of 2.3% in 2025 and around 2.0% in 2026 and 2027. As growth in unit labour costs moderates and other input cost dynamics remain contained, unit profit growth is expected to recover somewhat from 2025, aided by the economic recovery, strengthening productivity growth and a temporary accounting boost in 2027 related to the statistical treatment of ETS2.[12] Compared with the March 2025 projections, GDP deflator growth has been revised down by 0.2 percentage points for 2025 and slightly up for 2027.
Chart 14
(annual percentage changes)

Note: The vertical line indicates the start of the current projection horizon.
Import price inflation is expected to pick up over the projection horizon. Growth in the import deflator is expected to rise from -0.5% in 2024 to 0.4% in 2025 and to pick up further to 1.2% in 2026 and 2.0% in 2027. The large revisions to import price inflation compared with the March projections (a downward revision of 2.0 percentage points for 2025 and 0.5 percentage points for 2026, but an upward revision of 0.5 percentage points for 2027) are consistent with the impact of the appreciation of the euro and the energy commodity price assumptions, which are partially offset by the positive contribution of changes to competitors’ export prices. The latter mainly relate to the United States as tariffs imposed on US imports of intermediate goods lead to higher US export prices.
6 Sensitivity analyses
Alternative energy price paths
Alternative paths for oil and gas commodity prices suggest risks for inflation are overall tilted to the upside. The staff projections are based on the technical assumptions outlined in Box 1. In this sensitivity analysis, alternative downside and upside paths are derived from the 25th and 75th percentiles of the option-implied neutral densities for both oil and gas prices.[13] According to these densities, the distribution for oil prices is broadly symmetrical around the baseline. Upside risks, such as a faster than expected easing of trade disputes or a potential escalation of tensions in the Middle East, are balanced by downside risks stemming from the potentially persistent impact of the tariff announcements or from further higher than expected supply increases by OPEC+. By contrast, the gas price distribution indicates substantial upside risks to the technical assumptions (Chart 15), likely reflecting supply uncertainties. These uncertainties are associated with disruptions in the global liquefied natural gas (LNG) market – including potential tensions in the Middle East and further delays in planned LNG projects – and with risks related to the European market. Nevertheless, there are also downside risks, particularly if trade-related uncertainty has a lasting impact or if there is meaningful progress toward resolving the Russian war against Ukraine. A constant price sensitivity analysis is also carried out for both oil and gas prices. In each case, a synthetic energy price index (a weighted average of the oil and gas price paths) is computed and the impacts are assessed using ECB and Eurosystem macroeconomic models. The results are shown in Table 6 and suggest stronger upside risks to inflation than downside risks for 2027 and more limited risks for GDP growth.
Chart 15
Alternative paths for energy price assumptions
a) Oil price assumption
(USD/barrel)

b) Gas price assumption
(EUR/MWh)

Sources: Morningstar and ECB calculations.
Note: The option-implied densities for gas and oil prices are extracted from 14 May 2025 market quotes for options on ICE Brent crude oil and Dutch TTF natural gas futures with fixed quarterly expiry dates.
Table 6
Alternative energy price paths and their impact on real GDP growth and HICP inflation
Path 1: 25th percentile | Path 2: 75th percentile | Path 3: constant prices | |||||||
|---|---|---|---|---|---|---|---|---|---|
2025 | 2026 | 2027 | 2025 | 2026 | 2027 | 2025 | 2026 | 2027 | |
(deviations from baseline levels, percentages) | |||||||||
Oil prices | -7.9 | -16.1 | -18.7 | 7.3 | 15.6 | 18.5 | 0.9 | 1.1 | -1.1 |
Gas prices | -11.6 | -23.7 | -27.5 | 13.3 | 30.9 | 34.5 | -1.3 | 3.2 | 17.0 |
Synthetic energy price index | -9.5 | -18.2 | -16.5 | 7.6 | 18.1 | 24.2 | 0.0 | 2.0 | 5.6 |
(deviations from baseline growth rates, percentage points) | |||||||||
Real GDP growth | 0.0 | 0.1 | 0.1 | 0.0 | -0.1 | -0.1 | 0.0 | 0.0 | 0.0 |
HICP inflation | -0.3 | -0.6 | -0.2 | 0.2 | 0.6 | 0.4 | 0.0 | 0.1 | 0.1 |
Notes: In this sensitivity analysis, a synthetic energy price index that combines oil and gas futures prices is used. The 25th and 75th percentiles refer to the option-implied neutral densities for the oil and gas prices on 14 May 2025. The constant oil and gas prices take the respective value as at the same date. The macroeconomic impacts are reported as averages of a number of ECB and Eurosystem staff macroeconomic models.
Alternative exchange rate paths
This sensitivity analysis assesses implications for the baseline projections of alternative paths for the exchange rate, which in general indicate downside risks to growth and inflation. The technical assumptions for exchange rates in the projections baseline are held constant over the projection horizon. Alternative downside and upside paths are derived from the 25th and 75th percentiles of option-implied neutral densities for the USD/EUR exchange rate on 14 May 2025, which was tilted towards a notable further appreciation of the euro (Chart 16). The impacts of these alternative paths are assessed using the ECB and Eurosystem staff macroeconomic models. The average impact on output growth and inflation across these models is shown in Table 7.
Chart 16
Alternative paths for the USD/EUR exchange rate

Sources: Bloomberg and ECB staff calculations.
Notes: An increase implies an appreciation of the euro. The 25th and 75th percentiles refer to the option-implied neutral densities for the USD/EUR exchange rate on 14 May 2025. The macroeconomic impacts are reported as averages of a number of ECB and Eurosystem staff macroeconomic models.
Table 7
Impact on real GDP growth and HICP inflation
Path 1: 25th percentile | Path 2: 75th percentile | |||||
|---|---|---|---|---|---|---|
2025 | 2026 | 2027 | 2025 | 2026 | 2027 | |
USD/EUR exchange rate | 1.09 | 1.09 | 1.09 | 1.12 | 1.20 | 1.25 |
USD/EUR exchange rate (% deviation from baseline) | -1.8 | -3.6 | -3.0 | 1.5 | 6.2 | 11.2 |
(deviations from baseline growth rates, percentage points) | ||||||
Real GDP growth | 0.0 | 0.1 | 0.1 | 0.0 | -0.2 | -0.3 |
HICP inflation | 0.0 | 0.1 | 0.1 | 0.0 | -0.2 | -0.3 |
Sources: Bloomberg and ECB staff calculations.
Notes: An increase implies an appreciation of the euro. The 25th and 75th percentiles refer to the option-implied neutral densities for the USD/EUR exchange rate on 14 May 2025. The macroeconomic impacts are reported as averages of a number of ECB and Eurosystem staff macroeconomic models.
Box 3
An update on the performance of Eurosystem/ECB staff projections for growth and inflation since 2021
Accurate projections are a key input for effective monetary policy decision-making. Reliable inflation projections help the ECB anticipate deviations from its 2% medium-term target and adjust its stance in a timely manner. Ensuring the reliability of these projections requires a regular evaluation of their performance. Given the link between economic activity and inflation, continuous monitoring of the performance of the growth projections is also important. Against this background, this box reviews the accuracy of recent Eurosystem/ECB staff projections for euro area growth and inflation.
The accuracy of euro area GDP growth projections has varied since the COVID-19 pandemic, with short-term projections proving accurate but the pace of the recovery over the medium term often overestimated (Chart A). During the pandemic, up to the end of 2021, both short-term and medium-term projections exhibited unusually large errors, reflecting the challenge of projecting growth during a period of unprecedented lockdowns and re-openings. After 2022, short-term projection errors decreased substantially and have since remained below or close to the pre-pandemic mean absolute error. This suggests that, even in an environment of multiple large shocks, recent short-term GDP projections have been generally reliable, with no clear bias. By contrast, medium-term projections systematically overestimated growth between the third quarter of 2022 and the second quarter of 2024, with one-year-ahead errors exceeding the pre-pandemic mean absolute error between the fourth quarter of 2022 and the fourth quarter of 2023. These overestimations reflected optimistic expectations about the strength of the recovery after the energy crisis. In particular, in 2022 these errors were driven by weaker than expected rebounds in global trade, higher energy prices, tighter financing conditions and elevated uncertainty, compounded by the underestimated impact of inflation on real incomes. In 2023 weaker than expected foreign demand, a more restrictive monetary policy and a stronger euro also contributed to lower growth outcomes than projected.[14] Over the past year the accuracy of the one-year-ahead projections has improved significantly, albeit with a continued tendency to slightly overestimate the strength of the growth outlook.
Chart A
Errors in Eurosystem/ECB staff projections for euro area quarterly real GDP growth since 2021
a) One-quarter-ahead errors | b) One-year-ahead errors |
(percentage points) | (percentage points) |
 |  |
Sources: Eurosystem/ECB staff macroeconomic projections for the euro area and Eurostat.
Notes: In panel a) errors are defined as the actual outcome for a given quarter minus the projection made in the previous quarter (e.g. the real-time outturn for the fourth quarter of 2022 minus the projection from the September 2022 ECB staff macroeconomic projections). In panel b) errors are defined as the actual outcome for a given quarter minus the projection made four quarters earlier (e.g. the real-time outturn for the fourth quarter of 2022 minus the projection from the December 2021 Eurosystem staff macroeconomic projections). Average absolute real GDP errors refer to the period 1999-2019 and exclude outliers during the global financial crisis.
Inflation projections for 2021 and 2022 significantly and persistently underestimated price pressures; their accuracy has improved since 2023, with errors switching sign for medium-term projections (Chart B). Actual inflation in 2021 and 2022 turned out substantially higher than projected, owing mainly to the extraordinary combination of surging energy commodity prices (particularly for gas), global supply bottlenecks and robust post-pandemic demand, which also led to some non-linearities in the transmission of the shocks. The factors behind these errors have been extensively discussed in analyses by ECB staff.[15] As inflationary pressures eased in 2023 and 2024 and staff enhanced the set of technical assumptions and improved the analytical tools, projection errors declined and became broadly aligned with pre-COVID averages. At the same time, one-year-ahead projection errors became persistently negative, although only up to last year.
Chart B
Errors in Eurosystem/ECB staff projections for euro area headline HICP inflation
a) One-quarter-ahead errors | b) One-year-ahead errors |
(percentage points) | (percentage points) |
 |  |
Sources: Eurosystem/ECB staff macroeconomic projections for the euro area and Eurostat.
Notes: In panel a) errors are defined as the actual outcome for a given quarter minus the projection made in the previous quarter (e.g. the real-time outturn for the fourth quarter of 2022 minus the projection from the September 2022 ECB staff macroeconomic projections). In panel b) errors are defined as the actual outcome for a given quarter minus the projection made four quarters earlier (e.g. the real-time outturn for the fourth quarter of 2022 minus the projection from the December 2021 Eurosystem staff macroeconomic projections). Average absolute HICP errors refer to the period 1999-2019 and exclude outliers during the global financial crisis.
The overpredictions of inflation in the past year have been almost exclusively due to the volatile energy component, while core inflation has been remarkably accurate (Chart C). Following the Russian invasion of Ukraine, gas prices surged unexpectedly leading to substantial errors in energy inflation forecasts. Errors in HICP food inflation and HICP inflation excluding energy and food also increased over time, as firms passed on cost pressures more broadly and more frequently, and as inflation became more persistent in services due to strong post-pandemic demand. From 2023 onwards, projection errors across all components gradually declined. One-year-ahead projection errors turned negative from the fourth quarter of 2023, driven by energy inflation errors largely due to wholesale gas prices being lower than embedded in futures prices. The food and core inflation components were fully in line with projections from the June 2024 exercise onwards.
Chart C
Decomposition of one-year-ahead errors for euro area HICP inflation by component
(percentage points)
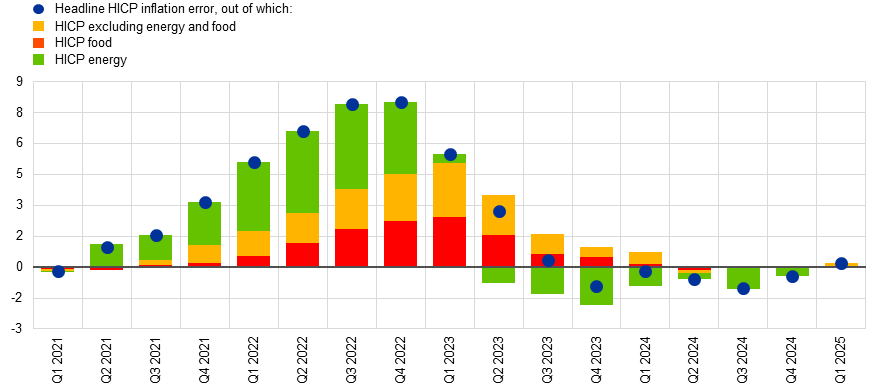
Sources: Eurosystem/ECB staff macroeconomic projections for the euro area and Eurostat.
Notes: Errors are defined as the actual outcome for a given quarter minus the projection made four quarters earlier (e.g. the real-time outturn for the fourth quarter of 2022 minus the projection from the December 2021 Eurosystem staff macroeconomic projections).
Examining how staff projections for annual average inflation for 2024 have evolved across vintages reveals that HICP inflation in 2024 was initially slightly underestimated but subsequently overestimated (Chart D). Eurosystem staff first made an inflation projection for 2024 in the December 2021 projection exercise, anticipating inflation of 1.8%, notably below the final outturn of 2.4%. In the early projection exercises covering 2024, inflation was underestimated owing to stronger than expected dynamics in the core component. This primarily stemmed from the lagged pass-through of cost pressures – especially from energy and wages – to services inflation, which could not have been fully anticipated in late 2021 or early 2022 given that many shocks occurred only in the course of 2022. Between December 2022 and December 2023, subsequent staff projections overestimated 2024 inflation, owing almost entirely to the energy component, while projections for HICP inflation excluding energy were closer to the outcome. In these vintages, technical assumptions based on oil and gas price futures embedded much higher energy prices for 2024 than the prices that ultimately materialised. From the March 2024 projection exercise onwards, the projection of headline HICP inflation for 2024 was broadly in line with the outcome. Despite the shocks that have made inflation forecasting particularly challenging in recent years, the projection errors for inflation in 2024, throughout the different vintages, remained within the range that could be expected based on historical uncertainty, with most errors falling within the 60% confidence interval at the time of the projection.
Chart D
Eurosystem/ECB staff projections for annual average HICP inflation in 2024 over different vintages
(annual percentage changes, percentage points)

Sources: Eurosystem/ECB staff macroeconomic projections for the euro area and Eurostat.
Notes: The dates refer to the publication of each projection vintage. The blue line shows the Eurosystem/ECB staff projection for 2024 annual inflation at each vintage. The bars breakdown the forecast error by inflation component. The shaded areas represent the 30%, 60% and 90% confidence ranges based on past inflation projection errors, centred around the final 2024 inflation outcome, as they would have been estimated at the time of the exercise. For details on the methodology, see the box entitled “Illustrating the uncertainty surrounding the projections” in the March 2023 ECB staff macroeconomic projections for the euro area.
Forecast errors for inflation in 2024 followed a similar pattern across forecasters, with initial underestimations followed by overestimations in the course of 2023, which were gradually corrected over time (Chart E). Like Eurosystem/ECB staff, all forecasters starting their inflation forecasts for 2024 in late 2021 expected inflation to be below 2% but subsequently revised their forecasts up until December 2022, given the observed rise in inflation by that time. Forecasts broadly plateaued until summer 2023, before gradually converging towards the outturn. The Consensus Economics forecasts performed better on average from December 2022 to September 2023, but this also masks overestimations and underestimations by individual private forecasters.
Chart E
The evolution of forecasts of annual average HICP inflation in 2024 across different international organisations and private sector forecasters
(annual percentage changes)
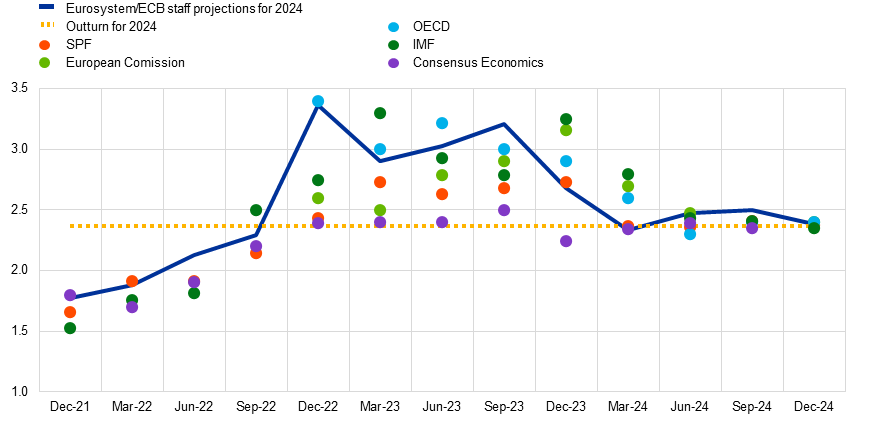
Sources: Eurosystem/ECB staff projections, Consensus Economics, Survey of Professional Forecasters (SPF), European Commission, Organisation for Economic Co-operation and Development (OECD), International Monetary Fund (IMF) and Eurostat.
Notes: These forecasts are not directly comparable with one another or with the Eurosystem/ECB staff macroeconomic projections, as they were finalised at different points in time. Additionally, these projections use different methods to derive assumptions for fiscal, financial and external variables, including oil, gas and other commodity prices. For survey-based sources (Consensus Economics and the SPF), the data points refer to the mean.
In summary, projection errors have become smaller since the second half of 2023, with the Eurosystem/ECB staff projections performing well overall, but given the ongoing shocks hitting the euro area, forecasting remains challenging. Errors were particularly large in 2021 and 2022, reflecting the impact of extraordinary and overlapping shocks. Since then forecast accuracy has improved, especially for inflation excluding energy and food, in line with the gradual dissipation of these shocks. The case of 2024 illustrates that, despite some over and underestimations, inflation projection errors have remained within historically normal bounds. That said, forecasting remains very challenging given the ongoing shocks affecting the economic outlook at both the global and euro area levels. This calls for continued caution and agility in the forecasting process, particularly in the face of high uncertainty around the evolution and transmission of these shocks.
Box 4
Comparison with forecasts by other institutions and the private sector
The June 2025 Eurosystem staff projections are within the range of other forecasts for GDP growth but generally lower for HICP inflation. The staff projection for growth is within the narrow range of forecasts from other institutions and surveys of private sector forecasters for 2025 and 2027, and slightly below the range for 2026. For HICP inflation, the Eurosystem staff projection lies at the bottom of the range of other forecasts for 2025 and below it for 2026. This is likely due to the more recently updated energy and exchange rate assumptions underlying the Eurosystem projections. For 2027, the Eurosystem staff projection is in line with the other available forecasts. The Eurosystem staff projections for HICPX inflation are within the range of other forecasts for 2025-26 and slightly below the other available forecast for 2027.
Table
Comparison of recent forecasts for euro area real GDP growth, HICP inflation and HICP inflation excluding energy and food
(annual percentage changes)
| Date of release | Real GDP growth | HICP inflation | HICP inflation excl. energy and food | |||||||||
|---|---|---|---|---|---|---|---|---|---|---|---|---|---|
2025 | 2026 | 2027 | 2025 | 2026 | 2027 | 2025 | 2026 | 2027 | |||||
Eurosystem staff projections | June 2025 | 0.9 | 1.1 | 1.3 | 2.0 | 1.6 | 2.0 | 2.4 | 1.9 | 1.9 | |||
OECD | June 2025 | 1.0 | 1.2 | - | 2.2 | 2.0 | - | 2.2 | 2.0 | - | |||
European Commission | May 2025 | 0.9 | 1.4 | - | 2.1 | 1.7 | - | 2.4 | 1.9 | - | |||
Consensus Economics | May 2025 | 0.9 | 1.2 | 1.4 | 2.0 | 1.8 | - | 2.3 | 2.0 | - | |||
Survey of Professional Forecasters | April 2025 | 0.9 | 1.2 | 1.4 | 2.2 | 2.0 | 2.0 | 2.3 | 2.1 | 2.1 | |||
International Monetary Fund | April 2025 | 0.8 | 1.2 | 1.3 | 2.1 | 1.9 | 2.0 | - | - | - | |||
Sources: OECD Economic Outlook, 3 June 2025; European Commission Spring 2025 Economic Forecast, 19 May 2025; Consensus Economics Forecasts, 12 May 2025 (data for 2027 are taken from the January 2025 survey); ECB Survey of Professional Forecasters, 22 April 2025; IMF World Economic Outlook, 22 April 2025.
Notes: These forecasts are not directly comparable with one another or with the Eurosystem staff macroeconomic projections, as they were finalised at different points in time. Additionally, they use different methods to derive assumptions for fiscal, financial and external variables, including oil, gas and other commodity prices. The Eurosystem staff macroeconomic projections report working day-adjusted annual growth rates for real GDP, whereas the European Commission and the International Monetary Fund report annual growth rates that are not adjusted for the number of working days per annum. Other forecasts do not specify whether they report working day-adjusted or non-working day-adjusted data.
© European Central Bank, 2025
Postal address 60640 Frankfurt am Main, Germany
Telephone +49 69 1344 0
Website www.ecb.europa.eu
All rights reserved. Reproduction for educational and non-commercial purposes is permitted provided that the source is acknowledged.
For specific terminology please refer to the ECB glossary (available in English only).
PDF ISBN 978-92-899-7359-5, ISSN 2529-4687, doi:10.2866/7697211, QB-01-25-150-EN-N
HTML ISBN 978-92-899-7358-8, ISSN 2529-4687, doi:10.2866/4678778, QB-01-25-150-EN-Q
The cut-off date for the technical assumptions and the projections for the global economy was 14 May 2025. The macroeconomic projections for the euro area were finalised on 21 May 2025.
Unless explicitly mentioned, references to world and/or global aggregates of economic indicators throughout this section exclude the euro area.
Effective tariff rates reflect temporary exemptions for certain products (consumer electronics, pharmaceuticals, semiconductors, lumber, etc.).
Contrary to the baseline scenario and the mild scenario, the severe scenario does not include temporary tariff exemptions. This implies that goods with temporary exemptions are assumed to be subject to the US general tariff rates announced on 2 April.
Country-specific factors, such as market exposure – e.g. via the size of the goods and services exports sector – may result in quite heterogenous effects. The baseline projections do not assume major supply-side disruptions arising from the trade tensions.
These estimates do not include the impact of the recent events on the technical assumptions (see Box 1), in particular, the appreciation of the euro against the US dollar and in nominal effective terms, which further weakens competitiveness.
This amount includes spending on support for Ukraine which does not have a macroeconomic impact on the euro area economy.
In total, additional defence spending since the March 2025 projections related to government plans announced after the Munich Security conference in mid-February has been incorporated into the baseline for eight euro area countries.
The fiscal stance of the euro area is defined as the change in the cyclically adjusted primary balance, further adjusted for the NGEU grants on the revenue side. While the fiscal stance is a top-down measure of the orientation of fiscal policy, discretionary fiscal measures are gauged using a bottom-up approach. These measures capture changes in tax rates, fiscal entitlements and other government spending that have been passed or are likely to be passed by the national parliaments of euro area countries.
An additional source of tightening in 2025 is the further scaling-down of the remaining energy support measures, while government consumption and investment continue to expand and fiscal transfers increase. The loosening of non-discretionary factors is due to revenue shortfalls and other tax residuals, while the composition effects, which were strongly positive in 2024, are projected to be neutral both in 2025 and over the rest of the horizon.
The NGEU grants (with no macro impact on the revenue side of the budget) are estimated at close to 0.5% of GDP for 2026 and only slightly above zero for 2027.
The ETS2 scheme is expected to be recorded in the national accounts as a tax on production when the emission permits are surrendered, i.e. the year after the auctioning. The ETS2 revenues for 2027 will thus only be recorded in the national accounts in 2028, while final prices are expected to be increased already in 2027. The gross operating surplus is therefore expected to be temporarily boosted in 2027.
The market prices used are those prevailing on 14 May 2025 (the cut-off date for the technical assumptions).
See also “The performance of Eurosystem/ECB staff projections for economic growth since the COVID-19 pandemic”, Economic Bulletin, Issue 7, ECB, 2024.
See “An update on the accuracy of recent Eurosystem/ECB staff projections for short-term inflation”, Economic Bulletin, Issue 2, ECB, 2024; “An updated assessment of short-term inflation projections by Eurosystem and ECB staff”, Economic Bulletin, Issue 1, ECB, 2023; and “What explains recent errors in the inflation projections of Eurosystem and ECB staff?”, Economic Bulletin, Issue 3, ECB, 2022. See also “The empirical performance of ECB/Eurosystem staff inflation projections since 2000”, Economic Bulletin, Issue 5, ECB, 2024.
-
5 June 2025
-
19 June 2025