


- THE ECB BLOG
Excess savings: To spend or not to spend
2 November 2023
During the pandemic many people put more money aside than usual. So what is happening with these additional funds? The ECB Blog looks at which households built up excess savings and how they are using the money.
Being forced to stay home during the pandemic was tough. But it meant that people saved money because they had fewer opportunities to spend. Think of closed restaurants and cancelled flights. Some also just wanted to prepare for an uncertain future.[1] Government subsidies to households further increased disposable income. Between the end of 2019 and the second quarter of 2023, euro area households accumulated savings of around €1 trillion more than they would have otherwise. This is equal to around 12% of their annual disposable income.[2] But, now that the effects of the pandemic are fading, are people going to keep this money or will they finally spend or invest it, as we saw in the US? Our findings provide information on future consumption dynamics, which in turn impact inflation and are therefore of great importance for the ECB.
We need to understand where people’s savings come from before we can talk about where they are likely to go. Chart 1 shows which factors drove the build-up of excess savings over the course of the pandemic. The chart reflects changes in household consumption and changes in disposable income relative to their respective pre-pandemic trends. The disposable income is also broken down into labour income (that is, salaries and wages), non-labour income (e.g. from rents, or dividends from shares), and fiscal transfers (for instance, income taxes, unemployment benefits, family and children related allowances).
Excess savings started being accumulated shortly after the pandemic outbreak, especially during the second quarter of 2020. This was the result of a sharp decline in consumer spending from the pre-pandemic trends. Fiscal transfers also increased, but to a lesser extent. In the second quarter of 2022, high inflation started to hit, and households had to pay more for the same amount of goods and services. So, private consumption (in nominal terms) rose above its pre-pandemic trend, thus weighing on excess savings. Nevertheless, the overall amount of excess savings did not decline. This was because income began to rise above its pre-pandemic trend, offsetting the trend in private consumption.
Chart 1
Quarterly excess savings and their breakdown by origin
% of quarterly household disposable income
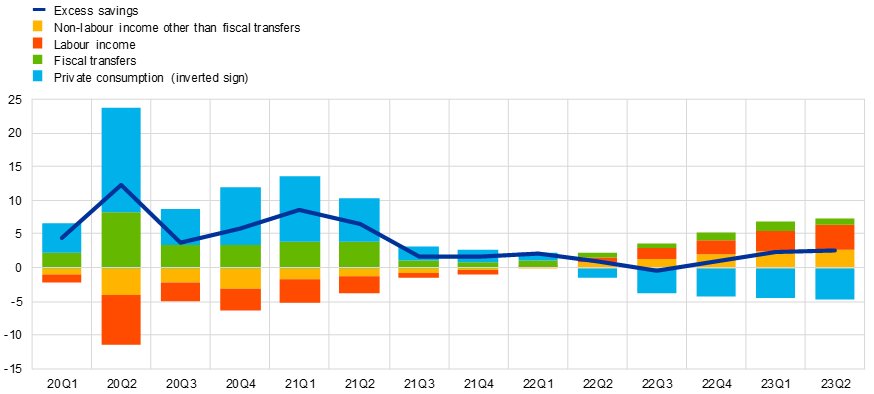
Sources: Eurostat and ECB staff calculations.
Notes: Non-labour income other than fiscal transfers includes gross operating surplus and mixed income as well as net property income. Fiscal transfers include direct taxes and net social transfers and are measured as the residual between savings and the sum of private consumption, labour income, and non-labour income other than fiscal transfers. Private consumption is shown with an inverted sign, since below-trend consumption increases excess savings.
In other words, the excess savings were mainly generated in the first two years after the outbreak of the pandemic. After that, the accumulated amount largely stagnated. Households are therefore currently holding on to their excess savings.[3] But, if they are not using the pandemic savings to fully compensate for the lost consumption, what are households doing with their money?
Where do people keep their savings?
Households can hold their savings in cash or bank deposits, which they can easily liquidate to buy goods and services. Other options include repaying loans, investing in more illiquid financial assets, such as equities and bonds or buying non-financial assets such as housing. This allocation of savings across liquid assets, illiquid assets and loans is central to understand how this persistently large stock of excess savings might be affecting household consumption.
Chart 2 breaks down the various uses of excess savings.[4] It shows that, following the outbreak of the pandemic, households in the euro area initially put their excess savings largely in cash and bank deposits as well as in other financial assets. In 2021, however, savings in the form of cash and deposits fell below their pre-pandemic trend, while other financial assets continued to rise above their trend. The same holds true for housing investment, albeit to a lesser extent. This shift in the allocation of excess savings has accelerated recently, likely reflecting rising interest rates. Higher interest rates make it less attractive to hold cash and bank deposits. Instead, households bought higher-yielding financial assets, borrowed less or repaid loans.
Chart 2
Quarterly excess savings by use
% of quarterly household disposable income
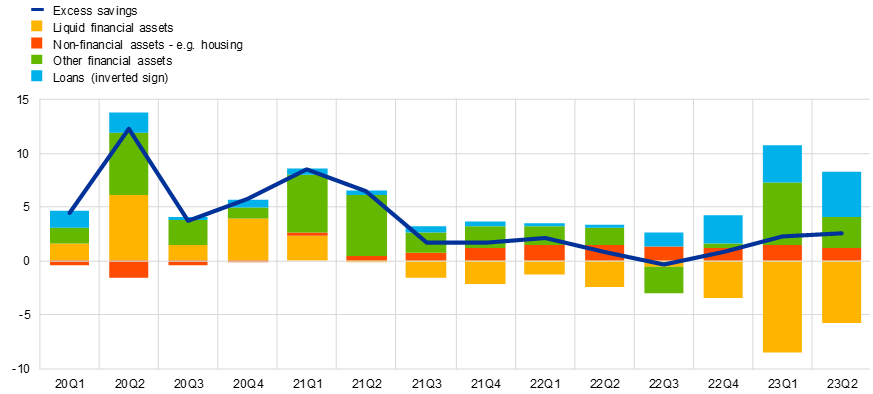
Sources: Eurostat, ECB and ECB staff calculations.
Notes: Liquid financial assets refer to cash and deposits. Non-financial assets refer to gross capital formation, which mainly comprise housing investment. Other financial assets mainly refer to equities and bonds and are measured as the residual between savings and the sum of liquid financial assets, non-financial assets and loans. Loans are shown with an inverted sign, since below-trend loan flows imply the use of excess savings to borrow less or repay loans.
Who holds excess savings?
People are thus foregoing consumption and parking their money in longer-term investments or reducing debt. But not all income groups can do this in the same way. Chart 3 shows that households at the top of the income distribution are holding the bulk of the excess savings.[5] While households in the top 20 percent (highest income quintile) own about half of total excess savings, the bottom 20 percent (bottom income quintile) own less than one tenth. This finding is consistent with research showing that richer households were less affected by income losses during the pandemic. The consumption behaviour of the top 20 percent also helps explain the relatively high level of excess savings.[6] Richer households tend to spend more on contact-intensive services such as going to the theatre or travelling, and these were particularly limited during the pandemic.[7] They also tend to spend less out of each additional euro of disposable income. In economists’ jargon: they have a lower marginal propensity to consume.
Chart 3
Cumulated excess savings by household income quintiles in the second quarter of 2023
% of total stock of accumulated excess savings by income quintile

Sources: Eurostat, ECB, Household Finance and Consumption Survey and ECB staff calculations.
To summarize: households in the euro area accumulated a large amount of excess savings since the outbreak of the pandemic. We find evidence that richer households hold the bulk of it and have invested it in illiquid assets. This suggests that most of these savings are here to stay, perhaps as reserves for a rainy day. In other words, those hoping that the money put aside during the pandemic will support a surge in consumption any time soon will likely be disappointed. This is a highly relevant insight for assessing what drives inflation and how monetary policy needs to respond.
The views expressed in each blog entry are those of the author(s) and do not necessarily represent the views of the European Central Bank and the Eurosystem.
See also Dossche, M. and Zlatanos S. (2020), “COVID-19 and the increase in household savings: precautionary or forced?”, Economic Bulletin, Issue 6, ECB.
We measure household excess savings as the difference between the actual saving flows in each quarter and the hypothetical saving flows achieved if they had grown at their pre-pandemic trend. The cumulative sum of these flows of excess savings since the first quarter of 2020 then defines the stock of excess savings accumulated over time. For a similar methodology using a counterfactual scenario in the context of the United States, see Aladangady, A., Cho, D., Feiveson, L. and Pinto, E., “Excess Savings during the COVID-19 Pandemic”, FEDS Notes, 21 October 2022 and Abdelrahman, H. and Oliveira, L. E., “The rise and fall of pandemic excess savings”, FRBF Economic Letter, 8 May 2023.
The fact that households were initially cautious about spending their excess savings accumulated during the pandemic is consistent with survey results collected in the first year after the pandemic outbreak as part of the ECB's Consumer Expectations Survey (CES), see Dossche, M., Georgarakos, D., Kolndrekaj, A. and Tavares, F. (2022), “Household saving during the COVID-19 pandemic and implications for the recovery of consumption”, Economic Bulletin, Issue 5, ECB.
For a similar decomposition applied also to the United States, see Battistini, N., Di Nino, V. and Gareis, J. (2023), “The consumption impulse from pandemic savings ‒ does the composition matter?”, Economic Bulletin, Issue 4, ECB. The allocation of Spanish excess savings to different uses is presented in Alves, P. and Martínez-Carrascal, C. (2023), “The accrual and use of the excess savings built up by Spanish households since the onset of the pandemic”, Economic Bulletin, 2023/Q2, Banco de España. The Italian case is assessed in Colabella, A., Guglielminetti, E., and Rondinelli, C. (2023), “The distribution and use of Italian households’ savings after the pandemic”, Questioni di Economia e Finanza, Number 797, Banca d’Italia.
For the establishment of the relationship between wealth and income, see Blatnik, N., Kavonius, I. K. and Morais, L. T. (2022), “Cashing in on Wealth: Links between Wealth and Income Inequality from the Lens of Distributional Wealth Accounts”, paper prepared for the 37th IARIW General Conference.
See Dossche, M., Krustev, G. and Zlatanos, S. (2021), “COVID-19 and the increase in household savings: an update”, Economic Bulletin, Issue 5, ECB.
This is also true because the loss in services consumption was only partially replaced by the consumption of goods. See Bobasu, A. and Gareis, J. (2022), “The impact of higher energy prices on services and goods consumption in the euro area”, Economic Bulletin, Issue 8, ECB.