
1 Overview of the results
This report presents the main results of the 29th round of the Survey on the Access to Finance of Enterprises (SAFE) in the euro area, which was conducted between 4 September and 18 October 2023. The survey covered the period from April to October 2023. The sample comprised 11,523 enterprises in the euro area, of which 10,499 (91%) had fewer than 250 employees.[1]
According to the survey results, euro area firms reported an increase in turnover, although the net percentage declined relative to the previous survey round. A net[2] 20% reported increased turnover (Chart 3 in Section 2), a significantly lower proportion than in the previous survey round. The net percentages reporting an increase in turnover declined in the case of both large firms and SMEs. However, the decline was stronger in the case of large firms.
More firms saw a deterioration in profits, as labour and other non-labour costs increased further (Chart 3 in Section 2). In this survey round, 18% of SMEs and 7% of large firms reported a deterioration in profits in net terms. The deterioration in profitability reflects a rise in the cost of labour, reported by a net 75% of firms. A similar net percentage of firms indicated a rise in costs for materials and energy, although the share was lower than in the previous survey round.
Increasing interest expenses appear to be a further drag on profitability, with the net percentage of firms reporting higher interest expenses reaching a historical peak in the survey (47%). Large firms (58%) were more widely affected by the increase in interest expenses than SMEs (40%).
Altogether, the share of financially vulnerable firms increased, almost to the level seen during the COVID-19 pandemic (Chart 5 in Section 2). The financial vulnerability indicator, a comprehensive indicator of firms’ financial situation[3], suggests that 9% of euro area enterprises encountered major difficulties in running their businesses and servicing their debts over the past six months.
Euro area firms reported that they expect their selling prices to increase by 3.7%, on average, over the next 12 months (down from 6.1% in the previous survey round) and their employees’ wages to rise by 4.3% (down from 5.4%) (Chart 6 in Section 2).[4] Firms’ replies show heterogeneity across sizes classes. SMEs expect their selling prices to increase by 4.1% over the next year on average, while the corresponding figure for large companies is 3.1%. Expected average wage increases are 4.4% and 4.2% for SMEs and large firms respectively.
Lack of skilled labour and rising input costs were the major concerns for firms’ business activity across size classes, while access to finance remained among the least-reported major concerns (Chart 9 in Section 2). Over the past six months, the major problems faced by euro area enterprises were the availability of skilled labour, signalled by 69% of firms, and higher production costs, signalled by 65% of firms. Only 25% of firms reported that access to finance was a major concern for their business, which is quite low compared with the peak in mid-2020.
The net share of firms reporting an increase in their need for external funds was modest (Table 1, columns 1-4 in this section and Chart 10 in Section 3). A net 5% of companies reported a higher need for bank loans, with SMEs signalling broadly no change and large firms indicating a higher need compared with the previous survey round.
The availability of external financing deteriorated, reflecting the ongoing transmission of monetary policy (Table 1, columns 5-8 in this section and Chart 12 in Section 3). Specifically, firms reported (in net terms) a decline in the availability of both bank loans (-10%) and credit lines (-6%). While bank loan availability according to the SAFE is currently deteriorating at its highest pace during the current hiking cycle, the tightening of banks’ credit standards observed in the bank lending survey (BLS) moderated, possibly because changes in banks’ credit standards pass through to firms’ perceptions with a time lag.[5]
Firms’ increased need for external finance combined with lower availability resulted in a further moderate widening of the financing gap (Table 1, columns 9-10 at the end of this section and Chart 13 in Section 3). The net percentage of firms reporting a widening of their external financing gap across all financial instruments (bank loans, credit lines, trade credit, and equity and debt securities issuance) stood at 8%.
To a greater extent than in the previous survey round, firms perceived both the general economic outlook and firm-specific outlook to be the main factors hampering the availability of external financing (Chart 14 in Section 3). A net 42% of firms reported a deterioration in the general economic outlook, up from 35% in the last survey round. The firm-specific outlook has also worsened, with a net 10% of firms reporting a deterioration, compared with a net 3% in the last survey round.
Firms’ perceptions of banks’ willingness to lend, which reflect banks’ risk aversion, were broadly unchanged overall (Chart 15 in Section 3). On balance, firms reported no changes in the willingness of banks to provide credit, after a net 3% of firms reported improvements in the previous survey round. While SMEs reported that banks’ willingness to lend had deteriorated (-2%), a net 5% of large firms signalled a more benign attitude among banks.
Most enterprises reported higher bank interest rates and other costs of bank financing, with net percentages at the highest levels observed since the survey began in 2009 (Chart 18 in Section 4). A net 86% of firms reported rises in bank interest rates (broadly unchanged from 87%), reflecting the transmission of the monetary policy tightening to the cost of borrowing for corporations. This is in line with the latest available results of the BLS showing a widening of the margins applied to bank loans in the second and third quarters of 2023.
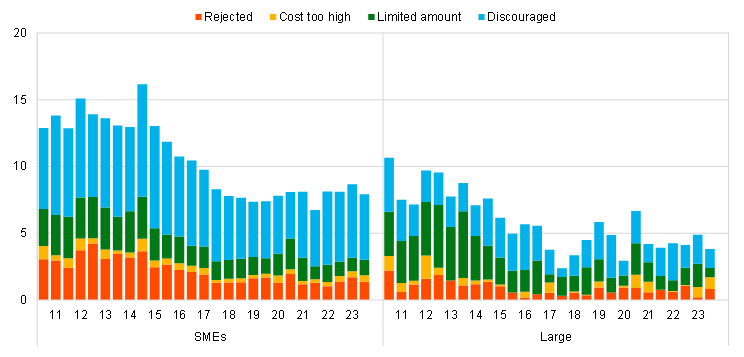
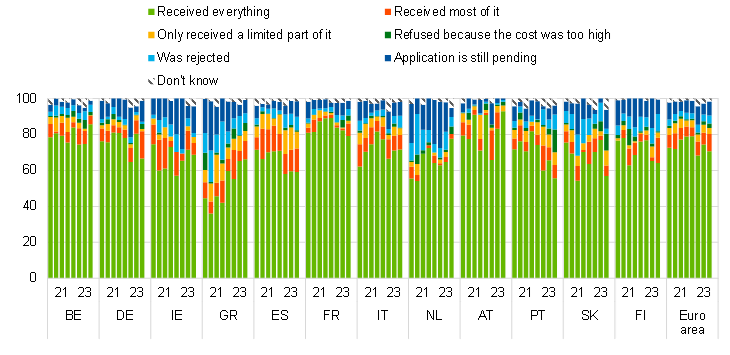
Few firms reported obstacles to obtaining a bank loan (Chart 1 in this section). Despite tighter financing conditions, the overall indicator[6] of financing obstacles remained almost unchanged at 6% (Table 1, columns 11 and 12 in this section). However, among those firms that applied for a bank loan (27% of firms), 10% reported obstacles to obtaining a loan. SMEs faced greater financing obstacles than large firms, with 14% reporting financing constraints, the highest share since 2016. The corresponding share for large firms was 7%.
Chart 1
Financing constraints among firms applying for a bank loan
(over the preceding six months; percentages of respondents)
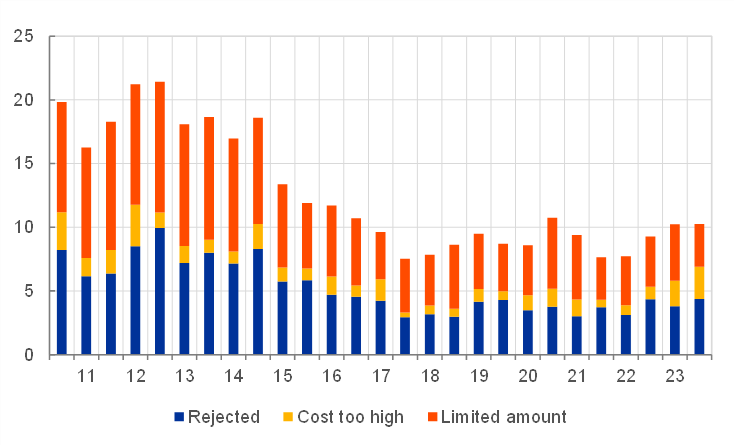
Base: Firms that applied for a bank loan.
Notes: Financing obstacles are defined here as the total of the percentages of enterprises reporting (i) loan applications that were rejected, (ii) loan applications for which only a limited amount was granted, and (iii) loan applications that resulted in an offer that was declined by the enterprise because the borrowing costs were too high. The data included in the chart refer to Questions 7a and 7b of the survey.
A composite indicator reflecting firms’ price terms and conditions of financing deteriorated further slightly, reaching a new historical peak in the survey for the third consecutive round (Chart 2 in this section). This indicator covers changes in firms’ bank interest rates and other costs related to bank financing (charges, fees and commissions) and is one of three “principal components” reflecting how euro area firms perceive financing conditions.[7] The recent deterioration in price terms and conditions of (denoted by positive values) was reported by 50% of firms (almost unchanged from 49% in the last survey round), reflecting the continued strong transmission of the monetary policy tightening to firms’ financing costs. The two other indicators of financing conditions, mainly reflecting firms’ financial position and non-price terms and conditions, also deteriorated slightly.
Chart 2
Change in overall financing conditions as perceived by euro area firms
(over the preceding six months; net percentages of respondents)
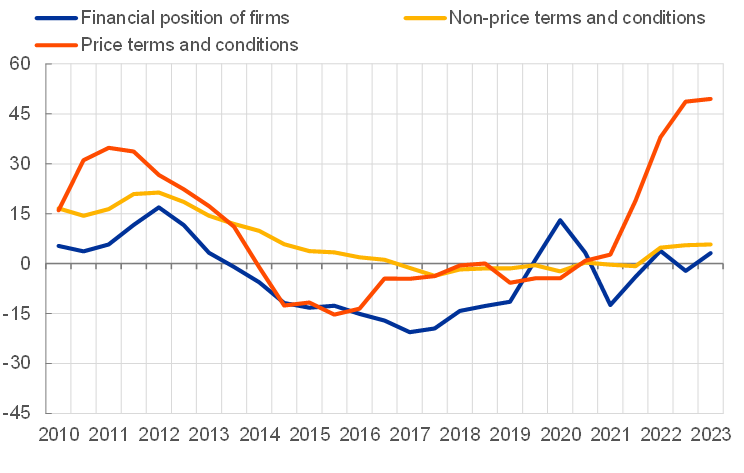
Base: All enterprises.
Notes: Indicators obtained by factor analysis. Positive values indicate a deterioration in firms’ financing conditions. The individual scores are weighted by size class, economic activity and country to reflect the economic structure of the underlying population of firms. The individual scores are standardised, so they have a range of between -1 and 1 and are multiplied by 100 to obtain weighted balances in percentages. Latest observation: April to September 2023.
Looking ahead, firms expect a decline in availability across all sources of external financing, and especially bank loans (Chart 19 and Chart 20 in Section 5). With regard to external financing, firms are particularly pessimistic about access to bank loans and credit lines, with a net 18% and 15% of firms respectively expecting a deterioration over the next six months. Firms’ expectations about the future availability of external financing seem to confirm that part of the monetary policy transmission is still in the pipeline.
Annex 1 of this report includes information on individual country results.
Table 1
Latest developments in SAFE country results for euro area firms
(net percentages of respondents)
Needs | Availability | Financing gap | Financing obstacles | |||||||||
|---|---|---|---|---|---|---|---|---|---|---|---|---|
Bank loans | Credit lines | Bank loans | Credit lines | |||||||||
(1) | (2) | (3) | (4) | (5) | (6) | (7) | (8) | (9) | (10) | (11) | (12) | |
2022 | 2023 | 2022 | 2023 | 2022 | 2023 | 2022 | 2023 | 2022 | 2023 | 2022 | 2023 | |
Euro area | 4 | 5 | 13 | 12 | -5 | -10 | -2 | -6 | 6 | 8 | 7 | 6 |
BE | 16 | 5 | 16 | 19 | -11 | -11 | -6 | -2 | 12 | 9 | 7 | 6 |
DE | 2 | 3 | 15 | 13 | -4 | -16 | 0 | -10 | 5 | 9 | 6 | 5 |
IE | 2 | -3 | 6 | 5 | -3 | 4 | -2 | 2 | 2 | 1 | 2 | 2 |
GR | 11 | 11 | 26 | 22 | 16 | 11 | 15 | 17 | 0 | 4 | 14 | 13 |
ES | 2 | -1 | 11 | 7 | -8 | -6 | -3 | -3 | 6 | 4 | 11 | 9 |
FR | 9 | 15 | 17 | 23 | -11 | -18 | -9 | -15 | 12 | 18 | 6 | 7 |
IT | 9 | 6 | 7 | 12 | 5 | 0 | 3 | -3 | 2 | 4 | 6 | 6 |
NL | -10 | -10 | 9 | 4 | -15 | -6 | -7 | 0 | 4 | 1 | 6 | 5 |
AT | 7 | 2 | 13 | 10 | -18 | -15 | -12 | -9 | 11 | 7 | 3 | 3 |
PT | -1 | -7 | 10 | 3 | -1 | 3 | -4 | 2 | 4 | 0 | 9 | 8 |
SK | 13 | -1 | 22 | 7 | -7 | -1 | 0 | 2 | 12 | 4 | 9 | 7 |
FI | -7 | -1 | 13 | 14 | -16 | -24 | -1 | -11 | 6 | 11 | 6 | 7 |
Notes: For the “financing gap”, see the notes to Chart 13; for “financing obstacles”, see the notes to Chart 16. “2022 H2” refers to round 28 (October 2022-March 2023) and “2023 H1” refers to round 29 (April 2023-September 2023).
2 The economic situation of euro area firms
2.1 Turnover continues to increase, with higher costs weighing on profitability
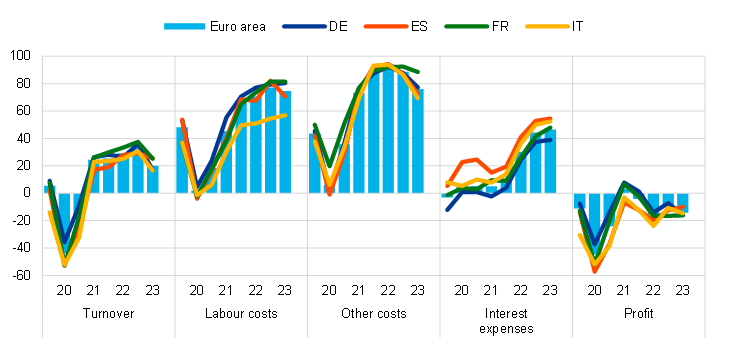
Euro area enterprises reported an increase in turnover over the last six months (Chart 3). However, the net percentage of euro area firms reporting an increase in turnover declined to 20% (down from 33% in the previous wave). Across firm sizes, the net percentage of firms reporting an increase in turnover declined more strongly for large firms (32%, down from 54%) than for SMEs (13%, down from 21%) compared with the previous round.
Chart 3
Changes in the income situation of euro area enterprises
(net percentages of respondents)
Base: All enterprises. The figures refer to rounds 3 to 29 of the survey (March 2010-September 2010 to April 2023-September 2023) for all firms and to rounds 21 to 29 (April 2019-September 2019 to April 2023-September 2023) for SMEs and large firms.
Notes: Net percentages are the difference between the percentage of enterprises reporting an increase for a given factor and the percentage reporting a decrease. The data included in the chart refer to Question 2 of the survey.
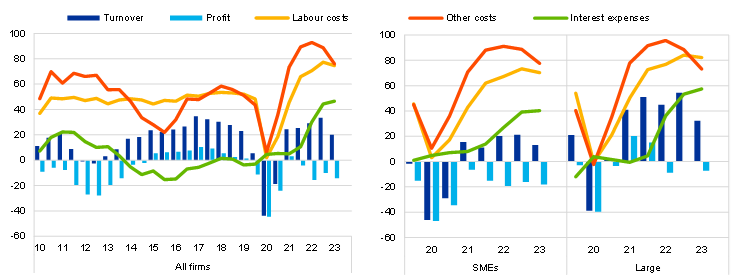
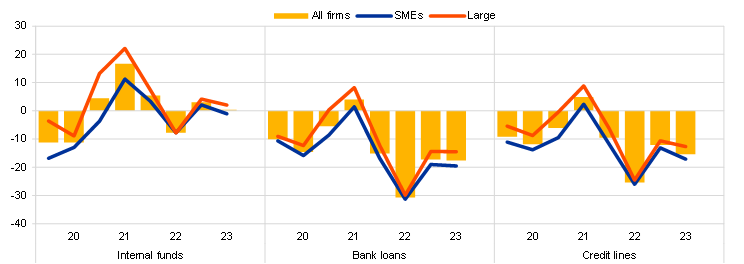
More euro area firms reported a deterioration in their profits than in the previous survey round. The net percentage of euro area corporations that signalled a decline in their profits was slightly above the net percentage reported in the previous survey round (-14% compared with -10%). While a net 18% of SMEs reported lower profits (compared with16% in the previous survey round), 7% of large firms signalled a deterioration (following 0% in the previous survey round).
The deterioration in profitability continues to reflect a significant rise in labour and other costs related to materials and energy, although cost pressures seem to have eased. A net 75% of firms reported higher labour costs (down from 77%). The net percentage of firms indicating rising costs for materials and energy, while still high, was lower than in the previous wave (76%, down from 89%), after it fell for the second consecutive round, reflecting the unwinding of high energy prices.
Increasing interest expenses are a further drag on profitability. The net percentage of firms reporting increased interest expenses reached a new historical since the beginning of the survey, while remaining well below the corresponding net percentages for labour and other costs. A net 47% of firms reported higher interest expenses (up from 44%), with large firms (58%) signalling such an increase more widely than SMEs (40%).
Chart 4
Changes in the debt situation and real decisions of euro area enterprises
(net percentages of respondents)
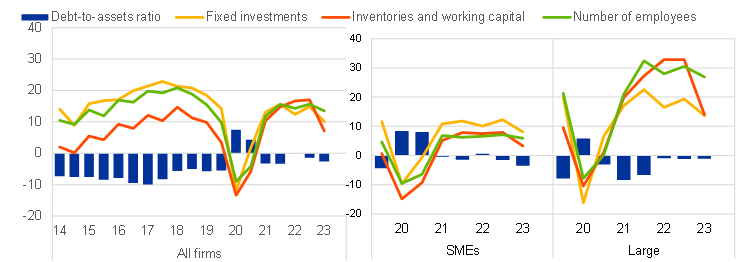
Base: All enterprises. The figures refer to rounds 11 to 29 of the survey (March 2014-September 2014 to April 2023-September 2023) for all firms and to rounds 22 to 29 (October 2019-March 2020 to April 2023-September 2023) for SMEs and large firms.
Notes: See the notes to Chart 3. The data included in the chart refer to Question 2 of the survey.
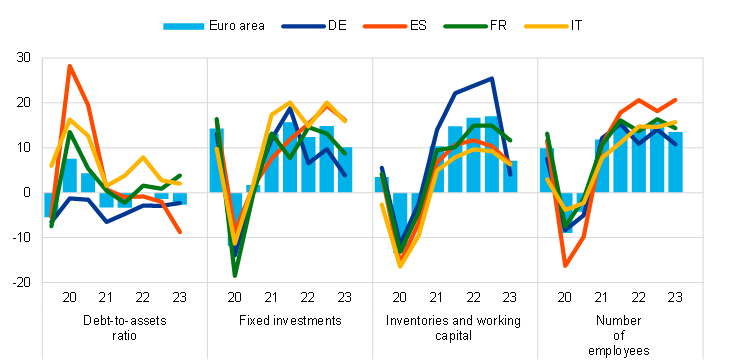
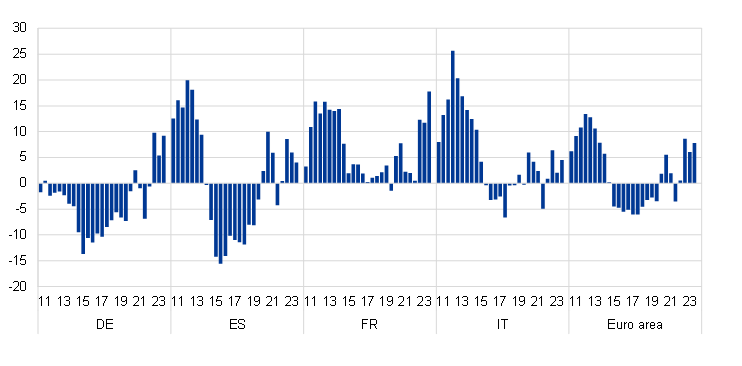
Euro area firms reported on balance that debt-to-assets ratios had declined in this survey round (Chart 4 above and Chart 24 in Annex 1). In this round, euro area firms indicated on balance (net percentage of -3%) that there had been a decrease in their indebtedness (compared with -1% in the previous round). A decline was reported by a net 4% for SMEs, while it was broadly unchanged for large firms (net -1%).
Firms’ investment and employment growth has broadly held up, but with fewer firms reporting increases. Euro area enterprises reported increases in fixed investment (10%, down from 15% in the previous round), inventories and working capital (7%, down from 17%) and number of employees (13%, down from 16%). Positive growth in fixed investment, inventories and employment was more widely reported among large firms than among SMEs.
The financial vulnerability of euro area enterprises increased, particularly in the case of large firms, reaching percentages close to those seen during the COVID-19 pandemic (Chart 5). The financial vulnerability indicator, which provides a comprehensive picture of firms’ financial situation, suggests that 9% of euro area enterprises encountered major difficulties in running their business and servicing their debts over the past six months (compared with 6% in the previous round).[8] The increase in this survey round was more pronounced for large firms, with the percentage reaching 9% (up from 5%), close to the levels seen during the outbreak of COVID-19 pandemic. The share of vulnerable SMEs also increased (to 8%, up from 6%). At the other end of the spectrum, the percentage of financially resilient firms (those that are more likely to withstand adverse shocks) remained unchanged at 4%.
Chart 5
Vulnerable and financially resilient enterprises in the euro area
(percentages of respondents)
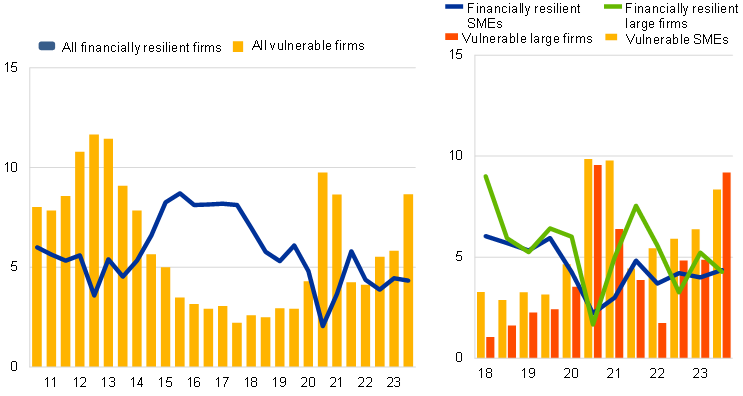
Base: All enterprises. The figures refer to rounds 3 to 29 of the survey (March 2010-September 2010 to April 2023-September 2023) for all firms and to rounds 18 to 29 (October 2017-March 2018 to April 2023-September 2023) for SMEs and large firms.
Notes: For a definition of “vulnerable firms” and “strong firms”, see footnote 8. The data included in the chart refer to Question 2 of the survey.
2.2 Firms expect more moderate growth in their selling prices, input costs and employment over the next year
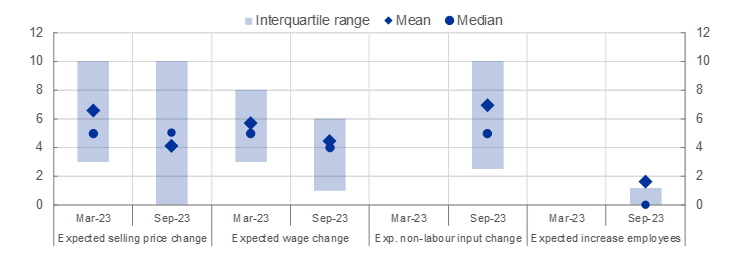
Firms expect their selling prices to increase by 3.7% on average over the next 12 months (down from 6.1% in the previous survey round), while the corresponding number for wages is 4.3% (down from 5.4%) (Chart 6 and Chart 7).[9] Both SMEs’ and large firms’ expectations about selling price and wage increases over the next year have eased compared with the previous survey round. On average, SMEs expect higher increases than large firms in both their selling prices (4.1% compared with 3.1%) and wage costs (4.4% compared with 4.2%) over the next year. Firms in both services and other sectors reported lower growth rates in average selling price and wage expectations between March and September 2023. However, firms in services still expect their selling prices and wages to increase more over the next year than other firms (4.4% compared with 3.1% for selling prices and 4.7% compared with 4% for wage increases) (Chart 8).
Chart 6
Expectations of selling prices, wages, input costs, and employment one year ahead
(weighted percentages)

Base: All enterprises. The figures refer to rounds 28 and 29 of the survey (October 2022-March 2023 and April 2023-September 2023).
Notes: Mean and median euro area firm expectations of changes in selling prices, wages of current employees, non-labour input costs and number of employees for the next 12 months, along with interquartile ranges, using survey weights. The statistics are computed after trimming the data at the country-specific 1st and 99th percentiles. The data included in the chart refer to Question 34 of the survey. Questions on non-labour input costs and employees were not available in the March round.
Chart 7
Expectations of selling prices, wages, input costs, and employment one year ahead by size class
a) Small and medium-sized enterprises
(weighted percentages)
b) Large firms
(weighted percentages)
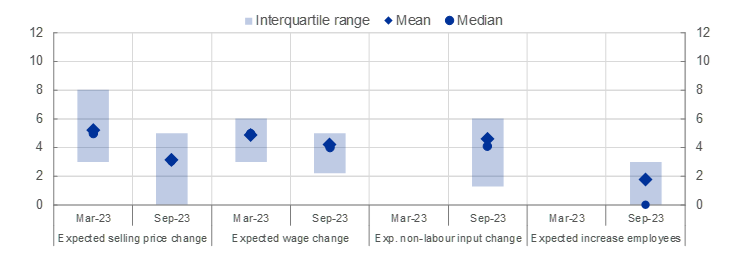
Base: All enterprises with less than 250 employees (panel a) and all enterprises with 250 or more employees (panel b). The figures refer to rounds 28 and 29 of the survey (October 2022-March 2023 and April2023-September 2023).
Notes: Mean and median euro area firm expectations of changes in selling prices, wages of current employees, non-labour input costs and number of employees for the next 12 months, along with interquartile ranges, using survey weights. The statistics are computed after trimming the data at the country-specific 1st and 99th percentiles. The data included in the chart refer to Question 34 of the survey.
Chart 8
Average expectations of selling prices, wages, input costs one year ahead by sector
(weighted percentages)
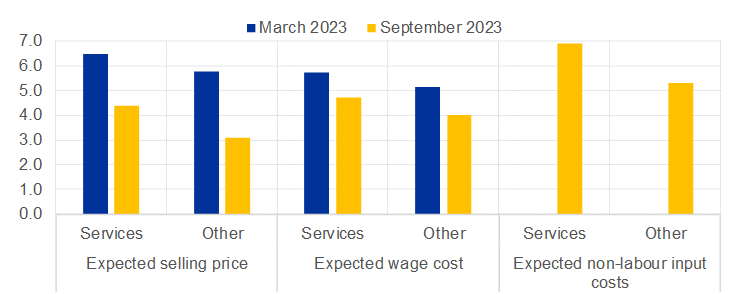
Base: All enterprises. The figures refer to rounds 28 and 29 of the survey (October 2022-March 2023 and April 2023-September 2023).
Notes: Mean euro area firm expectations of changes in selling prices, wages of current employees, non-labour input costs and number of employees for the next 12 months, along with interquartile ranges, using survey weights. The statistics are computed after trimming the data at the country-specific 1st and 99th percentiles. The data included in the chart refer to Question 34 of the survey.
Firms expect their non-labour input costs to increase by 6.1%, on average, over the next year, with services firms expecting higher increases (Chart 6 and Chart 7). The distribution of the expected average increase in non-labour input costs is widely dispersed, with the 25th and 75th percentiles at 2% and 10% respectively. The high degree of dispersion probably reflects differences in the inputs and raw materials used by firms, which may have different price outlooks. SMEs expect a higher increase in non-labour input costs than large firms (6.9% compared with 4.6%).
On average, firms expect employment to increase by 1.7% over the next year, while the median firm expects zero growth (Chart 6). This reflects that the distribution of expected changes in employment is skewed to the upside, with some firms expecting larger increases but most firms expecting modest increases or no change. The average expected employment growth for SMEs is slightly lower than for large firms (1.6% compared with 1.8%).
2.3 Euro area enterprises remain more concerned about staff availability and input costs than about access to finance
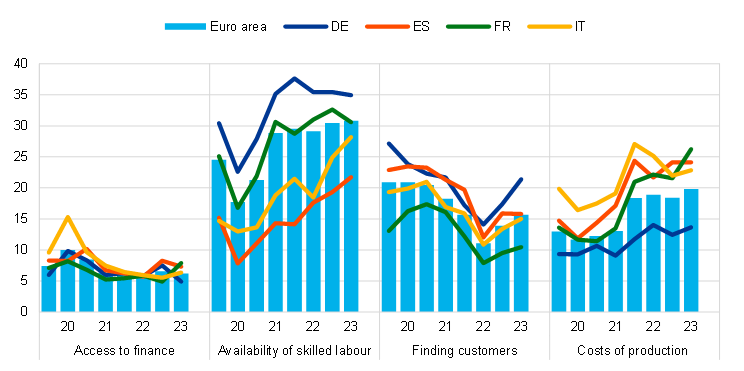
The availability of skilled labour and the rise in production costs continued to be the major concerns limiting production (Chart 9). Over the past six months, the availability of skilled labour remained the most widely reported major concern (defined as a score of at least seven on a scale of one to ten) among euro area firms (signalled by 69% of firms). This is in line with the recent signals of a robust labour market, with labour shortages seen as limiting production. High production costs also remained a major concern (indicated by 65% of firms). However, the net percentages of firms reporting these two concerns seem to have stabilised at high levels in the last two years. Across size classes, these two concerns are reported more often by large companies than by SMEs.
Around a quarter of firms reported access to finance as a major concern for their business, which is relatively low historically (Chart 9). Around 25% of firms reported access to finance as a major concern for their business, with no differences between SMEs and large firms.
Chart 9
Major concerns faced by euro area enterprises
(over the preceding six months; percentages of respondents)

Base: All enterprises. The figures refer to rounds 6 to 29 of the survey (October 2011-March 2012 to April 2023-September 2023).
Notes: A “major problem” is defined as a problem scoring at least 7 on a scale of 1 to 10. The data included in the chart refer to Question 0b of the survey.
3 Need and availability of external financing
3.1 Moderate increase in external financing needs across instruments
Euro area firms continued to report an increase in their external financing needs (Chart 10). A net 5% of companies reported higher needs for bank loans (up from 4% in the previous survey round), while 12% reported increased needs for credit lines (down from 13%). In net terms, firms also reported an increase in the need for trade credit, leasing or hire-purchase, debt securities and equity. The increase in the need for external financing was more pronounced for large firms than for SMEs across most instruments. A net 1% of SMEs indicated an increase in their need for bank loans (down from 3% in the previous survey round), whereas the corresponding net percentage for large firms was 10% (up from 6% in the previous survey round).
Chart 10
Changes in external financing needs of euro area enterprises
(net percentages of respondents)
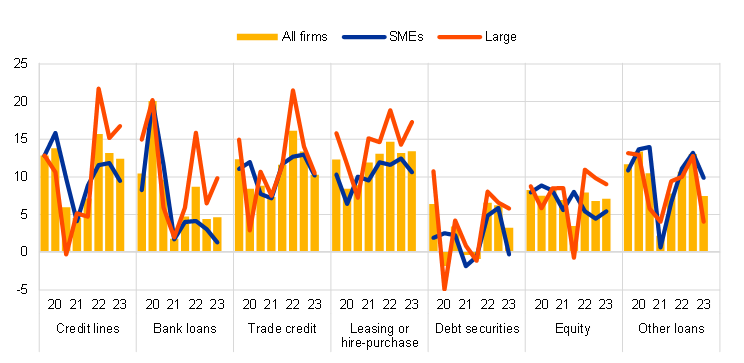
Base: Enterprises for which the instrument in question is relevant. The figures refer to rounds 22 to 29 of the survey (October 2019-March 20120 to April 2023-September 2023).
Notes: See the notes to Chart 3. The data included in the chart refer to Question 5 of the survey.
3.2 Firms used financing primarily for fixed investment and for inventories and working capital
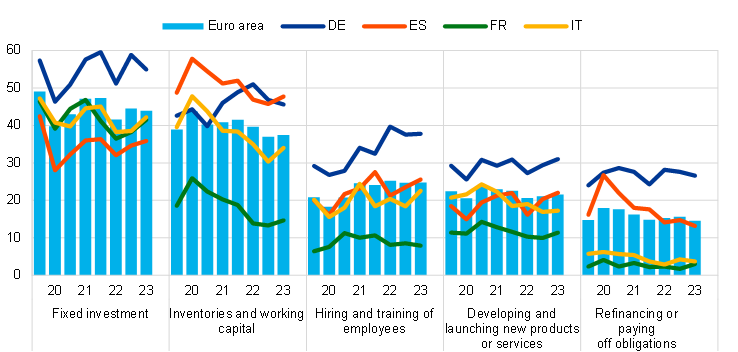
Financing from external and internal sources continued to be used mainly for fixed investment and for inventories and working capital (Chart 11). Fixed investment was still reported as the most common purpose of financing (44% of firms, after 45% in the previous survey round), followed by inventories and working capital (37%, after 37%).
Chart 11
Purpose of financing as reported by euro area enterprises
(percentages of respondents)
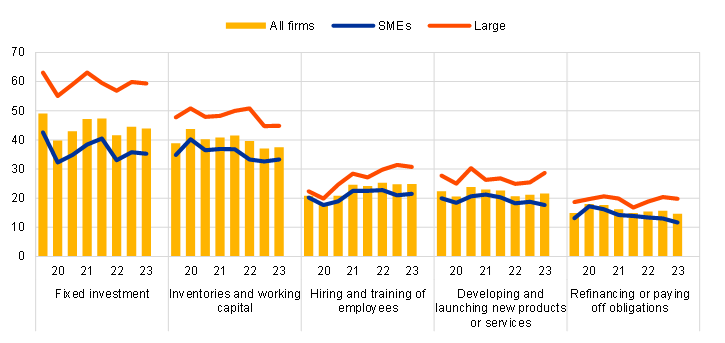
Base: All enterprises. The figures refer to rounds 22 to 29 of the survey (October 2019-March 2020 to April 2023-September 2023 ).
Note: The data included in the chart refer to Question 6A of the survey.
3.3 Declining availability of external financing contributed to a further widening of the financing gap
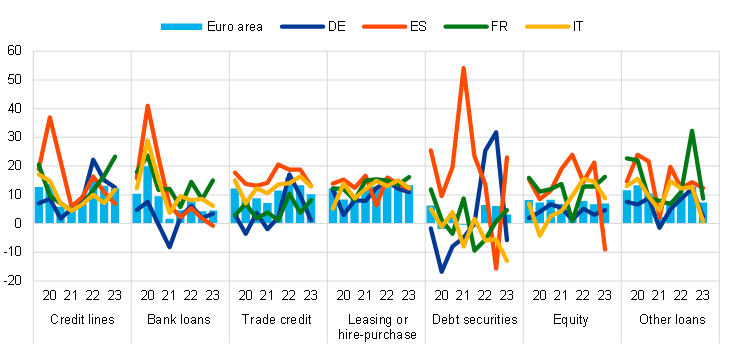
Firms reported a further deterioration in the availability of bank loans, credit lines and debt securities (Chart 12).[10] The net percentages of firms reporting a deterioration in the availability of bank loans and credit lines were 10% and 6% respectively. This was the third consecutive survey round in which firms reported declining availability of bank loans and credit lines, with the net percentage of firms reporting a decline in the latest round being larger than in the previous one. Across size classes, SMEs reported a deterioration in the availability of bank loans and credit lines more broadly (net -11% and -9% respectively) than large firms (-8% and -1% respectively). On balance, firms also reported a further decline in the availability of debt securities (-14% compared with -7% in the previous round), with a similar effect across size classes (-13% for SMEs and -14% for large firms). For most of the other sources of external finance, availability was reported to have deteriorated slightly, with the decline being stronger for SMEs than for large firms.
Chart 12
Changes in the availability of external financing for euro area enterprises
(net percentages of respondents)

Base: Enterprises for which the instrument in question is relevant. The figures refer to rounds 22 to 29 of the survey (October 2019-March 2020 to April 2023-September 2023 ).
Notes: See the notes to Chart 3. The data included in the chart refer to Question 9 of the survey.
Firms’ increased need for external finance combined with lower availability resulted in a further moderate widening of the financing gap (Chart 13). In the euro area, the external financing gap – the difference between the change in needs and the change in the availability of external financing across all financial instruments – was reported to be 8% (up from 6% in the previous round). The increase in the financing gap was reported by large firms in particular and to a lesser extent by SMEs.
Chart 13
Changes in the external financing gaps reported by euro area enterprises
(weighted net balances)

Base: Enterprises for which the instrument in question is relevant (i.e. they have used it or considered using it). Respondents replying “not applicable” or “don’t know” are excluded. The figures refer to rounds 3 to 29 of the survey (March 2010-September 2010 to April 2023-September 2023).
Notes: The financing gap indicator combines both financing needs and the availability of bank loans, credit lines, trade credit, and equity and debt securities issuance at firm level. For each of the five financing instruments, the indicator of the perceived change in the financing gap takes a value of 1 (-1) if the need increases (decreases) and availability decreases (increases). If enterprises perceive only a one-sided increase (decrease) in the financing gap, the variable is assigned a value of 0.5 (-0.5). The composite indicator is a weighted average of the financing gaps for the five instruments. A positive value for the indicator points to an increase in the financing gap. Values are multiplied by 100 to obtain weighted net balances in percentages. The data included in the chart refer to Questions 5 and 9 of the survey.
3.4 Euro area enterprises perceived the general economic outlook as negatively affecting the availability of external finance
Firms’ perceptions of both the general economic outlook and firm-specific outlook were the main factors hampering the availability of external financing, and more so than in the previous survey round (Chart 14). A net 42% of firms reported that a deterioration in the general economic outlook had decreased the availability of external financing (compared with a net percentage of -35% in the last survey round). The firm-specific outlook had also deteriorated (net -10%, following -3% in the previous survey round). Large firms were more pessimistic about the outlook for the general economy and their own business than SMEs, but both groups were more pessimistic compared with the last round. By contrast, firms reported an improvement in their own capital position (net 11%, down from 14%) and creditworthiness (net 14%, down from 15%), with these factors thus continuing to have a positive impact on access to finance in this survey round.
Chart 14
Changes in factors that have an impact on the availability of external financing to euro area enterprises
(net percentages of respondents)
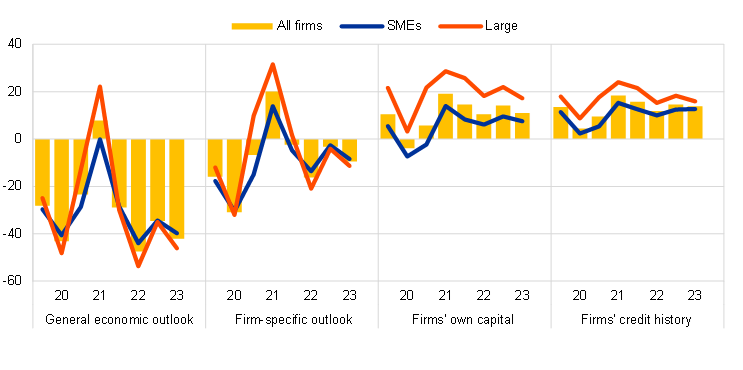
Base: All enterprises. The figures refer to rounds 22 to 29 of the survey (October 2019-March 2020 to April 2023-September 2023).
Notes: See the notes to Chart 3. The data included in the chart refer to Question 11 of the survey.
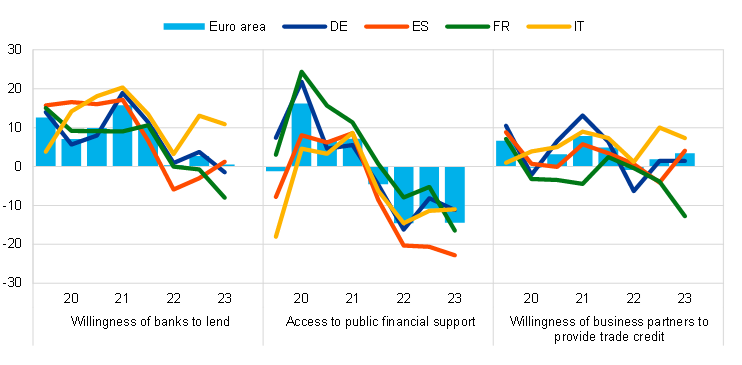
Firms reported no change, on balance, in the willingness of banks to provide credit (Chart 15). SMEs continued to report a deterioration on balance (-2%), while large firms signalled a more benign attitude on the part of banks (5%), although the net percentage also declined compared with the last round. At the same time, firms reported quite broadly that the role of public financial support was decreasing (a net percentage of -14%, down from -11% in the previous round), and with the decline for SMEs being more marked than for large firms.
Chart 15
Changes in factors that have an impact on the availability of external financing to euro area enterprises
(net percentages of respondents)
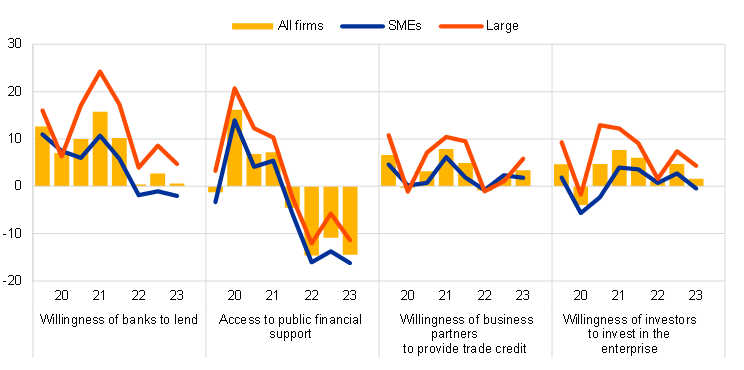
Base: All enterprises; for the category “willingness of banks to lend”, enterprises for which at least one bank financing instrument (credit line, bank overdraft, credit card overdraft, bank loan or subsidised bank loan) is relevant. The figures refer to rounds 22 to 29 of the survey (October 2019-March 2020 to April 2023-September 2023).
Notes: See the notes to Chart 3. The data included in the chart refer to Question 11 of the survey.
4 Obstacles to obtaining a bank loan and financing conditions
4.1 Financial obstacles are slightly on the rise
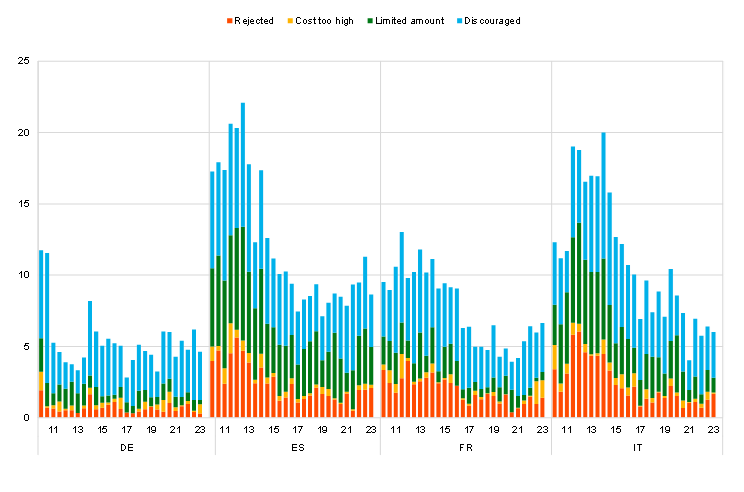
According to an overall indicator of financing constraints, few firms reported obstacles to obtaining a bank loan (Chart 16, panel a). Among enterprises that judged bank loans to be relevant for their enterprise, 6% reported obstacles when seeking to obtain a loan, with net percentages of 4% for large firms and 8% for SMEs (Chart 16, panel b).
However, looking only at firms applying for bank loans, the percentage of financially constrained firms is higher, especially for SMEs (Chart 17). In this survey round, 27% of firms applied for a bank loan (down from 29% in the last round). Among these firms, 10% reported obstacles. The share was larger for SMEs (14% compared with 7% for large firms), standing at the highest level since 2016. The percentages for the firms who applied for a bank loan are relatively high when compared with those recorded by the regular indicator, given that they do not include discouraged borrowers.
Chart 16
Obstacles to obtaining a bank loan
a) Euro area enterprises
(percentages of respondents)

b) Euro area SMEs and large enterprises
(percentages of respondents)
Base: Enterprises for which bank loans (including subsidised bank loans) are relevant. The figures refer to rounds 3 to 29 of the survey (March 2010-September 2010 to April 2023-September 2023).
Note: Financing obstacles are defined here as the total of the percentages of enterprises reporting (i) loan applications that were rejected, (ii) loan applications for which only a limited amount was granted, (iii) loan applications that resulted in an offer that was declined by the enterprise because the borrowing costs were too high, and (iv) a decision not to apply for a loan for fear of rejection (discouraged borrowers).
Chart 17
Financing constraints among firms applying for a bank loan by size classes
(percentages of respondents)
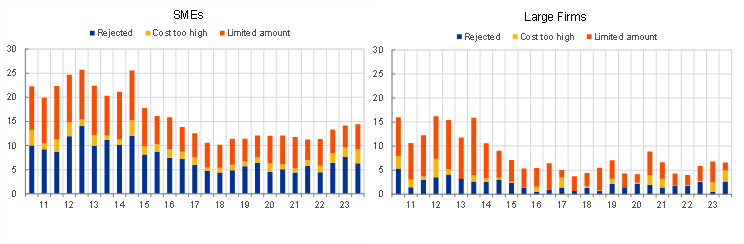
Base: Enterprises that applied for a bank loan. The figures refer to rounds 3 to 29 of the survey (March 2010-September 2010 to April 2023-September 2023).
Note: Financing obstacles are defined here as the total of the percentages of enterprises reporting (i) loan applications that were rejected, (ii) loan applications for which only a limited amount was granted and (iii) loan applications that resulted in an offer that was declined by the enterprise because the borrowing costs were too high. The data included in the chart refer to Questions 7a and 7b of the survey.
4.2 Substantial further tightening of firms’ costs of bank loans
Firms continued to report a widespread increase in bank interest rates and other costs of bank financing, reflecting the transmission of the monetary policy tightening to firms’ financing costs (Chart 18). A net 86% percent of firms reported an increase in bank interest rates in the current survey round (compared with 87% in the previous round). The continued increase in the interest rate on firms’ bank loans is in line with the latest BLS showing a widening of margins for bank loans for the second and third quarters of 2023. At the same time, a net 58% (up from 53%) of firms reported an increase in other costs of financing (i.e. charges, fees and commissions). As in the previous survey round, the figure represented a historical high. The rise in bank interest rates was reported more broadly by large firms, whereas the increase in other costs of bank loans was signalled more often by SMEs.
Chart 18
Changes in the terms and conditions of bank financing for euro area enterprises
(net percentages of respondents)
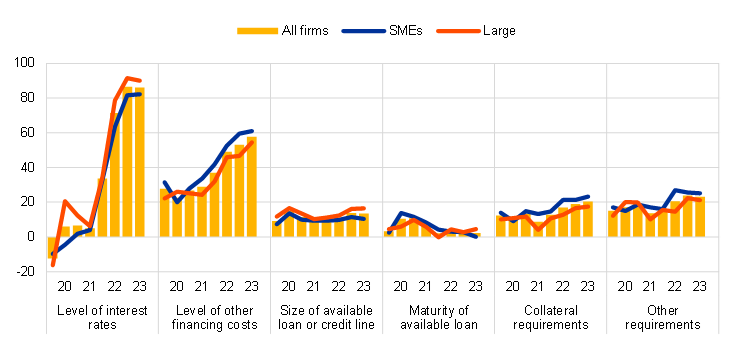
Base: Enterprises that had applied for bank loans (including subsidised bank loans), credit lines, or bank or credit card overdrafts. The figures refer to rounds 22 to 29 of the survey (October 2019-March 2020 to April 2023-September 2023).
Notes: See the notes to Chart 3. The data included in the chart refer to Question 10 of the survey.
5 Expectations regarding access to finance, turnover and investment
5.1 Firms expect the availability of external financing to deteriorate further
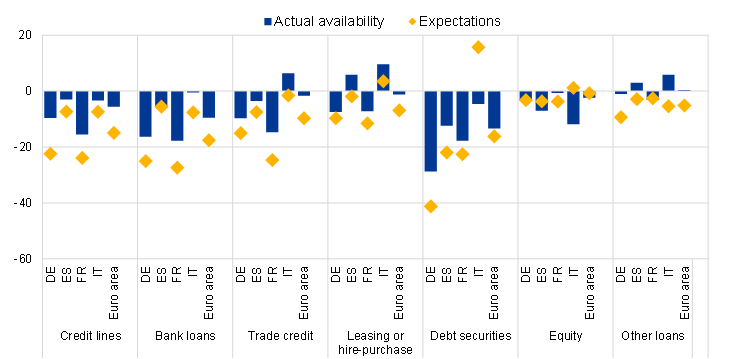
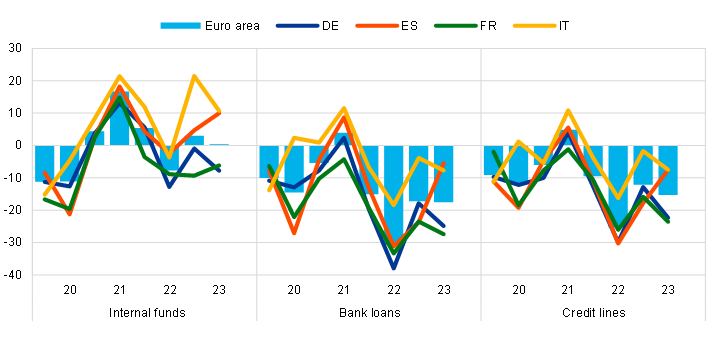
Looking ahead, firms are slightly more pessimistic about the availability of external financing over the next six months (Chart 19 and Chart 20). Reflecting the ongoing tightening in bank lending conditions, a net 18% of firms expect a further deterioration in access to bank loans over the next six months, while the corresponding numbers for credit lines and debt securities are 15% and 17% respectively. Compared with large firms, more SMEs expect a deterioration for both bank loans and credit lines. By contrast, a higher share of large firms expect the availability of debt securities to deteriorate than SMEs. Firms’ expectations about the future availability of external financing suggest that part of the monetary policy transmission is still in the pipeline. While firms overall expect the availability of internal funds to remain unchanged, large firms expect a slight improvement, while SMEs expect a small deterioration.
Chart 19
Actual and expected availability of external financing for euro area enterprises
(past six-month period and next six-month period; net percentages of respondents)
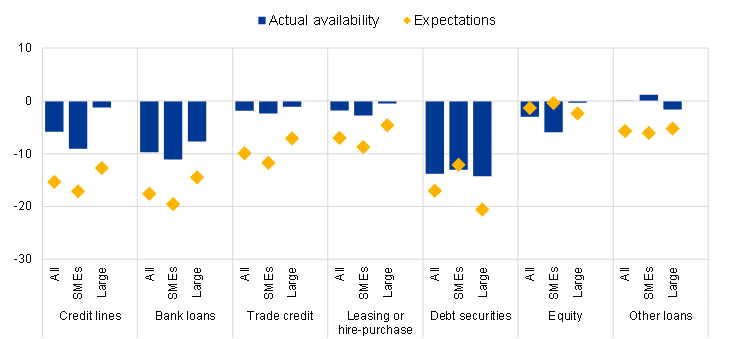
Base: Enterprises for which the instrument in question is relevant. The figures refer to round 29 of the survey (April 2023-September 2023).
Notes: See the notes to Chart 3. Bars refer to developments over the preceding six months and diamonds to expectations over the next six months The data included in the chart refer to Questions 9 and 23 of the survey.
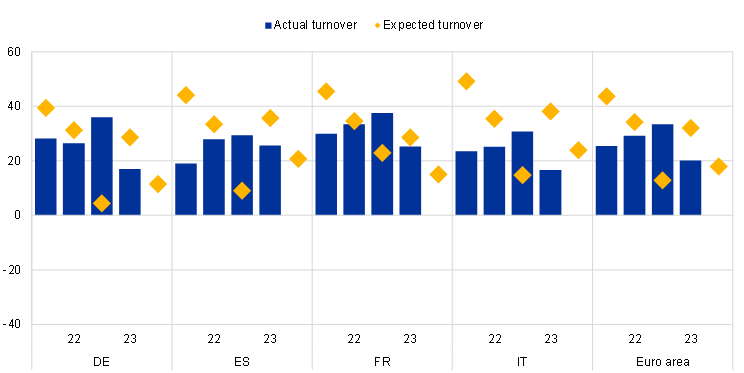
Firms expect a further increase in turnover and investment over the next six months (Chart 21 and Chart 22). A net 18% of euro area firms (down from 32% in the previous survey round) expect an increase in turnover over the next six months, with both SMEs (15%, down from 28%) and large firms (23%, down from 39%) becoming less optimistic. In a similar vein, a net 8% of firms expect investment to increase over the next six months (with 4% of SMEs reporting an increase compared with 14% for large firms).
Chart 20
Changes in euro area enterprises’ expectations regarding the availability of financing
(next six-month period; net percentages of respondents)
Base: Enterprises for which the instrument in question is relevant. The figures refer to rounds 22 to 29 of the survey (October 2019-March 2020 to April 2023-September 2023).
Notes: See the notes to Chart 3. The data included in the chart refer to Question 23 of the survey.
Chart 21
Actual and expected turnover among euro area enterprises
(past six-month period and next six-month period; net percentages of respondents)
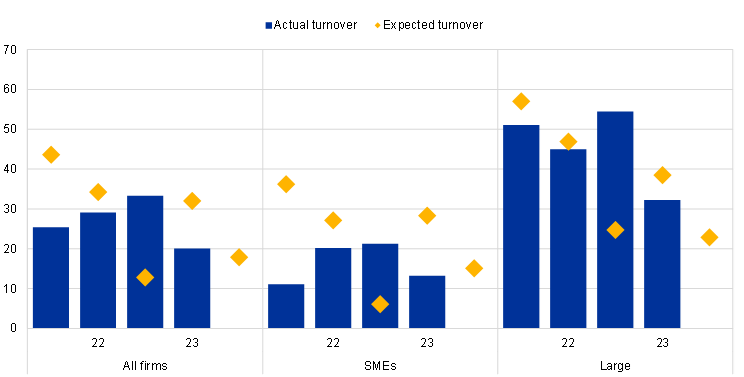
Base: All enterprises. The figures refer to rounds 25 to 29 of the survey (April 2021-September 2021 to April 2023-September 2023).
Notes: See the notes to Chart 3. Bars refer to developments over the preceding six months and diamonds to expectations over the next six months. The data included in the chart refer to Questions 2 and 26 of the survey.
Chart 22
Actual and expected investment among euro area enterprises
(past six-month period and next six-month period; net percentages of respondents)
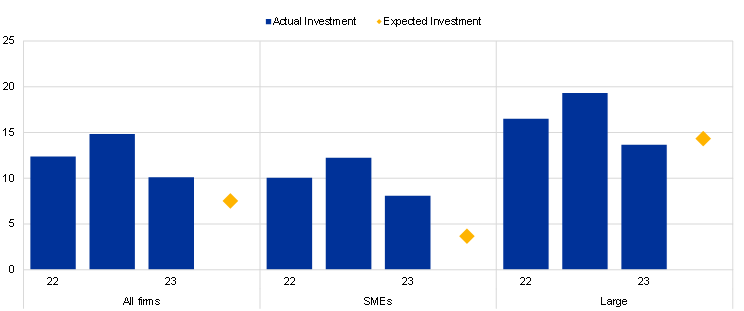
Base: All enterprises. The figures refer to rounds 26 to 29 of the survey (October 2021-March 2022 to April 2023-September 2023).
Notes: See the notes to Chart 3. Bars refer to developments over the preceding six months and diamonds to expectations over the next six months. The data included in the chart refer to Questions 2 and 26 of the survey.
Annexes
Annex 1
Overview of survey replies – country results
Chart 23
Changes in the income situation
(net percentages of respondents)
Base: All enterprises. The figures refer to rounds 22 to 29 of the survey (October 2019-March 2020 to April 2023-September 2023).
Notes: See the notes to Chart 3. The data included in the chart refer to Question 2 of the survey.
Chart 24
Changes in the debt situation and real decisions
(net percentages of respondents)
Base: All enterprises. The figures refer to rounds 22 to 29 of the survey (October 2019-March 2020 to April 2023-September 2023).
Notes: See the notes to Chart 3. The data included in the chart refer to Question 2 of the survey.
Chart 25
Vulnerable and strong euro area enterprises
(percentages of respondents)

Base: All enterprises. The figures refer to rounds 3 to 29 of the survey (March 2010-September 2010 to April 2023-September 2023).
Notes: For a definition of “vulnerable firms” and “strong firms”, see footnote 3. The data included in the chart refer to Question 2 of the survey.
Chart 26
Major concerns faced by euro area enterprises
(over the preceding six months; percentages of respondents)
Base: All enterprises. The figures refer to rounds 22 to 29 of the survey (October 2019-March 2020 to April 2023-September 2023).
Notes: A “major problem” is defined as a problem scoring at least 7 on a scale of 1 to 10. The data included in the chart refer to Question 0b of the survey.
Chart 27
Changes in external financing needs
(net percentages of respondents)
Base: Enterprises for which the instrument in question is relevant. The figures refer to rounds 22 to 29 of the survey (October 2019-March 2020 to April 2023-September 2023).
Notes: See the notes to Chart 3. The data included in the chart refer to Question 5 of the survey.
Chart 28
(percentages of respondents)
Base: All enterprises. The figures refer to rounds 22 to 29 of the survey (October 2019-March 2020 to April 2023-September 2023).
Note: The data included in the chart refer to Question 6A of the survey.
Chart 29
Changes in the availability of external financing
(net percentages of respondents)

Base: Enterprises for which the instrument in question is relevant. The figures refer to rounds 22 to 29 of the survey (October 2019-March 2020 to April 2023-September 2023).
Notes: See the notes to Chart 3. The data included in the chart refer to Question 9 of the survey.
Chart 30
Changes in the external financing gaps
(weighted net balances)
Base: Enterprises for which the instrument in question is relevant. Respondents replying “not applicable” or “don’t know” are excluded. The figures refer to rounds 3 to 29 of the survey (March 2010-September 2010 to April 2023-September 2023).
Notes: The financing gap indicator combines both financing needs and the availability of bank loans, credit lines, trade credit, and equity and debt securities issuance at firm level. For each of the five financing instruments, the indicator of the perceived change in the financing gap takes a value of 1 (-1) if the need increases (decreases) and availability decreases (increases). If enterprises perceive only a one-sided increase (decrease) in the financing gap, the variable is assigned a value of 0.5 (-0.5). The composite indicator is a weighted average of the financing gaps for the five instruments. A positive value for the indicator points to an increase in the financing gap. Values are multiplied by 100 to obtain weighted net balances in percentages. The data included in the chart refer to Question 5 and Question 9 of the survey.
Chart 31
Changes in factors that have an impact on the availability of external financing
(net percentages of respondents)

Base: All enterprises. The figures refer to rounds 22 to 29 of the survey (October 2019-March 2020 to April 2023-September 2023).
Notes: See the notes to Chart 3. The data included in the chart refer to Question 11 of the survey.
Chart 32
Changes in factors that have an impact on the availability of external financing
(net percentages of respondents)
Base: All enterprises; for the category “willingness of banks to lend”, enterprises for which at least one bank financing instrument (credit line, bank overdraft, credit card overdraft, bank loan or subsidised bank loan) is relevant. The figures refer to rounds 22 to 29 of the survey (October 2019-March 2020 to April 2023-September 2023).
Notes: See the notes to Chart 3. The data included in the chart refer to Question 11 of the survey.
Chart 33
Obstacles to obtaining a bank loan
(percentages of respondents)
Base: Enterprises for which bank loans (including subsidised bank loans) are relevant for rounds 3 to 29 of the survey (March 2010-September 2010 to April 2023-September 2023).
Notes: Financing obstacles are defined here as the total of the percentages of enterprises reporting (i) loan applications that were rejected, (ii) loan applications for which only a limited amount was granted, (iii) loan applications that resulted in an offer that was declined by the enterprise because the borrowing costs were too high, and (iv) a decision not to apply for a loan for fear of rejection (discouraged borrowers). The calculation of the indicator started in 2010, when the question on applications for credit lines was first included in the questionnaire. The components of the financing obstacles indicator were affected by the amendments to the questionnaire in round 11 (filtering based on the relevance of the financing instrument and addition of the new category “my application is still pending”), and past data have been revised accordingly. These figures include the categories “my application is still pending” and “don’t know”.
Chart 34
(percentages of respondents)
Base: Enterprises for which bank loans (including subsidised bank loans) are relevant. The figures refer to rounds 21 to 29 of the survey (April 2019-September 2019 to April 2023-September 2023).
Note: The data included in the chart refer to Question 7A of the survey.
Chart 35
Outcome of applications for bank loans
(percentages of respondents)
Base: Enterprises that had applied for bank loans (including subsidised bank loans). The figures refer to rounds 21 to 29 of the survey (April 2019-September 2019 to April 2023-September 2023).
Notes The data included in the chart refer to Question 7B of the survey.
Chart 36
Changes in the terms and conditions of bank financing
(net percentages of respondents)

Base: Enterprises that had applied for bank loans (including subsidised bank loans), credit lines, or bank or credit card overdrafts. The figures refer to rounds 22 to 29 of the survey (October 2019-March 2020 to April 2023-September 2023).
Notes: See the notes to Chart 3. The data included in the chart refer to Question 10 of the survey.
Chart 37
Actual and expected availability of external financing
(past six-month period and next six-month period; net percentages of respondents)
Base: Enterprises for which the instrument in question is relevant. The figures refer to round 29 of the survey (April 2023-September 2023).
Notes: See the notes to Chart 3. The data included in the chart refer to Question 9 and Question 23 of the survey.
Chart 38
Changes in expectations regarding the availability of financing
(next six-month period; net percentages of respondents)
Base: Enterprises for which the instrument in question is relevant. The figures refer to rounds 22 to 29 of the survey (October 2019-March 2020 to April 2023-September 2023).
Notes: See the notes to Chart 3. The data included in the chart refer to Question 23 of the survey.
Chart 39
Actual and expected turnover
(past six-month period and next six-month period; net percentages of respondents)
Base: All enterprises. The figures refer to rounds 25 to 29 of the survey (April 2021-September 2021 to April 2023-September 2023).
Note: The data included in the chart refer to Questions 2 and 26 of the survey.
Annex 2
Descriptive statistics for the sample of enterprises
Chart 40
Breakdown of enterprises by economic activity
(unweighted percentages)
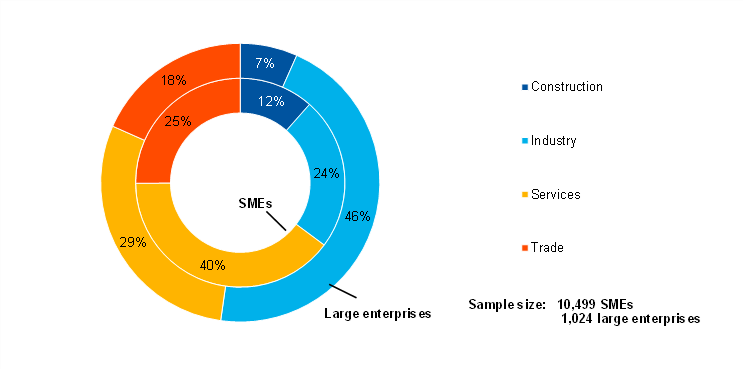
Base: The figures refer to round 29 of the survey (April 2023-September 2023).
Chart 41
Breakdown of enterprises by age
(unweighted percentages)
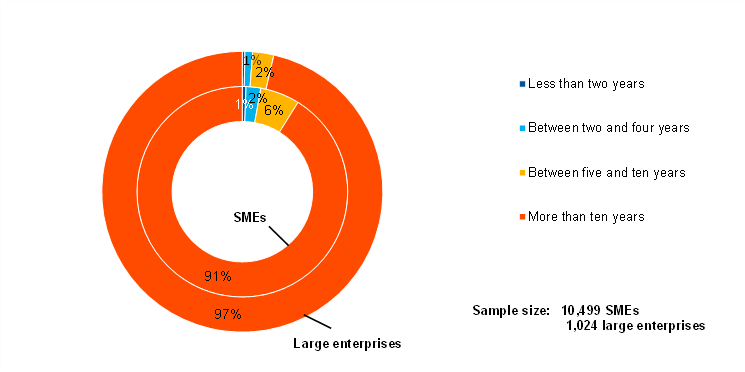
Base: The figures refer to round 29 of the survey (April 2023-September 2023).
Chart 42
Breakdown of enterprises by ownership
(unweighted percentages)

Base: The figures refer to round 29 of the survey (April 2023-September 2023).
Chart 43
Breakdown of enterprises by exports
(unweighted percentages)
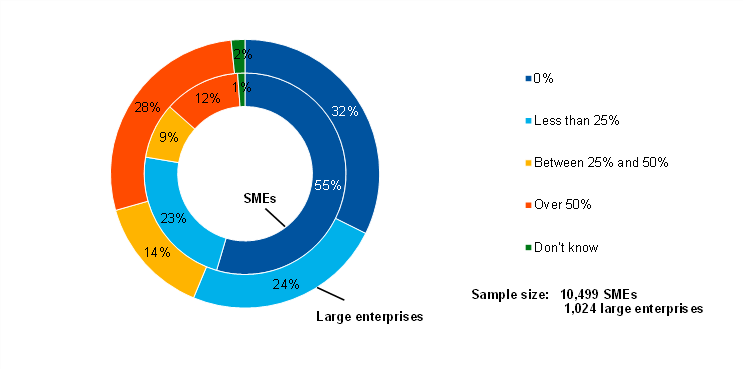
Base: The figures refer to round 29 of the survey (April 2023-September 2023).
Annex 3
Methodological information on the survey
For an overview of how the survey was set up, the general characteristics of the euro area enterprises that participate in the survey and the changes introduced to the methodology and the questionnaire over time, see the “Methodological information on the survey and user guide for the anonymised micro dataset”, which is available on the ECB’s website.[11]
In this survey round, no major changes were made to the existing questions in the questionnaire.[12]
© European Central Bank, 2023
Postal address 60640 Frankfurt am Main, Germany
Telephone +49 69 1344 0
Website www.ecb.europa.eu
All rights reserved. Reproduction for educational and non-commercial purposes is permitted provided that the source is acknowledged.
For specific terminology please refer to the ECB glossary (available in English only).
PDF ISSN 1831-9998, QB-AP-23-005-EN-N
HTML ISSN 1831-9998, QB-AP-23-005-EN-Q
See Annex 3 for details of methodological issues relating to the survey.
The net percentages indicated in this report are defined as the difference between the percentage of enterprises reporting that something has increased and the percentage reporting that it has declined. Companies are not asked in any of the questions to provide answers adjusted for inflation (but are instead asked to provide answers in volume rather than value terms).
Vulnerable firms are defined as firms that simultaneously report lower turnover, decreasing profits, higher interest expenses and a higher or unchanged debt-to-assets ratio.
Weighted averages calculated after trimming observations below the 1st percentile and above the 99th percentile of the country distributions. Firms’ expectations about their future selling prices reported here cannot be directly compared with commonly used measures of consumer price inflation expectations. The firms’ responses reflect producer prices rather than a consumption basket as in the case of the Harmonised Index of Consumer Prices (HICP).
See the euro area bank lending survey.
The financing obstacles indicator is the sum of the percentages of firms reporting the rejection of loan applications, loan applications for which only a limited amount was granted, and loan applications which resulted in an offer that was declined by the firms because the borrowing costs were too high, as well as the percentage of firms that did not apply for a loan for fear of rejection.
The indicator is derived from a factor analysis using firm-level survey replies since 2009. The variables included in the analysis cover changes in (i) price terms and conditions, (ii) non-price terms and conditions, (iii) the financial position of firms, and (iv) firms’ perceptions of changes in the willingness of banks to provide credit. This principal component is interpreted as relating to price terms and conditions. The aggregate indicator is the average of firm-level scores, weighted by size, economic activity and country. The analysis detects two other principal components, namely (i) the financial position of firms and (ii) non-price terms and conditions. For a detailed description of the indicator, see the box entitled “Financing conditions through the lens of euro area companies”, Economic Bulletin, Issue 8, ECB, 2021.
Vulnerable firms are defined as firms that simultaneously report lower turnover, decreasing profits, higher interest expenses and a higher or unchanged debt-to-assets ratio, while financially resilient firms are those that simultaneously report higher turnover and profits, lower or no interest expenses and a lower or no debt-to-assets ratio. See the box entitled “Distressed and profitable firms: two new indicators on the financial position of enterprises”, Survey on the Access to Finance of Enterprises in the euro area, October 2017 to March 2018, ECB, 2018.
Weighted averages calculated after trimming observations below the 1st percentile and above 99th percentile of the country distributions. The median expectation about price and wage changes is exactly equal to 5% across size classes.
Only those survey respondents which report that a particular financing instrument (i.e. bank loans, credit lines, trade credit, leasing or hire-purchase, debt securities, and equity or other loans) is relevant for their enterprise are asked about the availability of that source of financing.
The questionnaire is available on the ECB’s website. It has been translated into various languages for the purposes of the survey.
- 28 November 2023