
- CONSUMER EXPECTATIONS SURVEY – LATEST RESULTS
Economic growth and labour markets
Frankfurt am Main, 23 February 2024
Overview
This report contains the main aggregate indicators from the Consumer Expectations Survey (CES) related to economic growth and labour markets. Results are reported monthly at the euro area level, by country, by age group and by income quintile. The topics covered include:
- Economic growth expectations for the next 12 months
- Perceived current unemployment rate
- Expected unemployment rate 12 months ahead
- Probability of finding a job in the next three months
- Probability of losing your job in the next three months
- Probability of looking for a job in the next three months
Table 1 provides an overview of the latest results for the main indicators included in this report. For more detailed information on how the aggregate indicators are computed, please refer to the CES aggregate statistics guide and the CES Methodological information on the survey, available on the data and methodological information section of the CES webpage. The data behind the aggregate series included in this report can also be found under the same section.
Table 1
Overview of latest results – Economic growth and labour markets
Variable |
| November 2023 | December 2023 | January 2024 |
|---|---|---|---|---|
Economic growth expectations for the next 12 months | Mean | -1.3 | -1.3 | -1.1 |
Economic growth expectations for the next 12 months | Median | 0.0 | 0.0 | 0.0 |
Perceived current unemployment rate | Mean | 10.9 | 10.8 | 10.6 |
Perceived current unemployment rate | Median | 7.5 | 7.5 | 7.5 |
Expected unemployment rate | Mean | 11.4 | 11.2 | 10.9 |
Expected unemployment rate | Median | 7.9 | 7.9 | 7.7 |
Probability of finding a job in the next three months | Mean | - | - | 30.5 |
Probability of losing your job in the next three months | Mean | - | - | 8.0 |
Probability of looking for a job in the next three months | Mean | - | - | 9.7 |
Source: CES.
Notes: Weighted estimates. The median is computed on the basis of a symmetric linear interpolation that accounts for rounding of responses. Mean values are winsorised at the 2nd and 98th percentiles of each survey round and country.
Economic growth expectations for the next 12 months
In the qualitative question, respondents are asked: “During the next 12 months, I expect the economy of the country I currently live in to…”. The possible responses are “Grow”, “Shrink” and “Neither grow nor shrink”.
The open-ended (quantitative) question reads: “During the next 12 months, by how much do you think the economy will grow/shrink?
Chart 1
Economic growth expectations for the next 12 months – qualitative
Qualitative measure of economic growth (forward-looking)
(percentages of respondents)

Source: CES.
Notes: Weighted estimates. Net percentages are obtained by subtracting the percentage of respondents indicating that the economy will shrink from the percentage of respondents indicating that the economy will grow. The shift in the time series in April 2022 visualises the change in the composition of the aggregates due to the inclusion of five additional countries (IE, GR, AT, PT and FI).
Chart 2
Economic growth expectations for the next 12 months – pooled
Quantitative measure of economic growth (forward-looking)
(percentage changes)
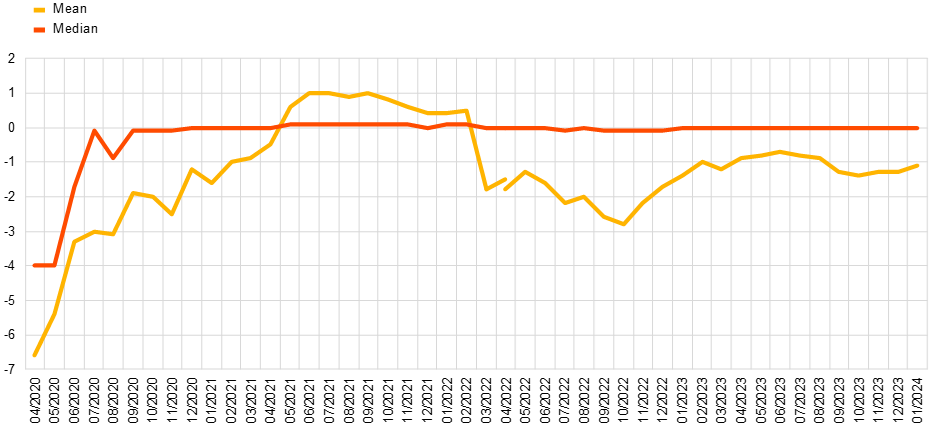
Source: CES.
Notes: Weighted estimates. Mean values are winsorised at the 2nd and 98th percentiles of each survey round and country. The median is computed on the basis of a symmetric linear interpolation that accounts for rounding of responses. The shift in the time series in April 2022 visualises the change in the composition of the aggregates due to the inclusion of five additional countries (IE, GR, AT, PT and FI).
Chart 3
Mean economic growth expectations for the next 12 months – by country
Quantitative measure of economic growth (forward-looking)
(percentage changes)
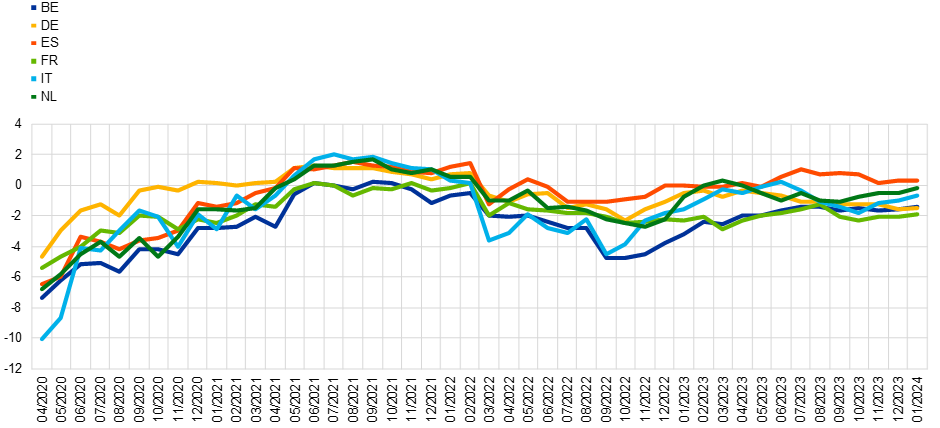

Source: CES.
Notes: Weighted estimates. Mean values are winsorised at the 2nd and 98th percentiles of each survey round and country.
Chart 4
Mean economic growth expectations for the next 12 months – by age group
Quantitative measure of economic growth (forward-looking)
(percentage changes)
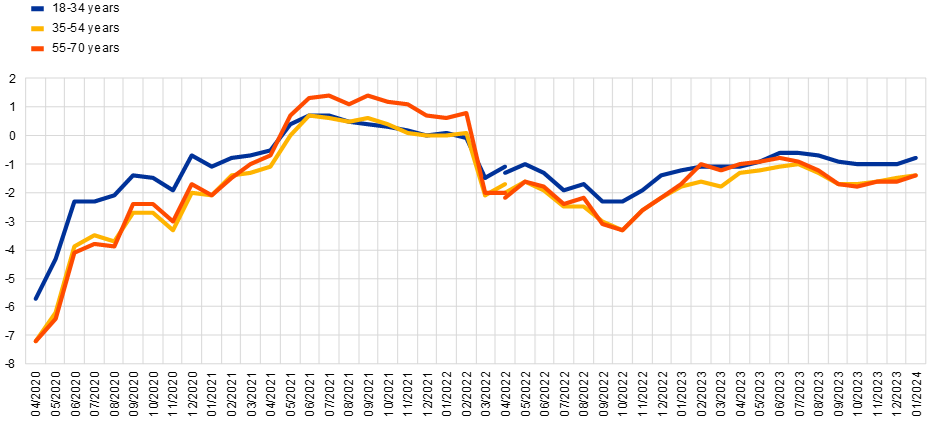
Source: CES.
Notes: Weighted estimates. Mean values are winsorised at the 2nd and 98th percentiles of each survey round and country. The shift in the time series in April 2022 visualises the change in the composition of the aggregates due to the inclusion of five additional countries (IE, GR, AT, PT and FI).
Chart 5
Mean economic growth expectations for the next 12 months – by income quintile
Quantitative measure of economic growth (forward-looking)
(percentage changes)

Source: CES.
Notes: Weighted estimates. Mean values are winsorised at the 2nd and 98th percentiles of each survey round and country. The shift in the time series in April 2022 visualises the change in the composition of the aggregates due to the inclusion of five additional countries (IE, GR, AT, PT and FI).
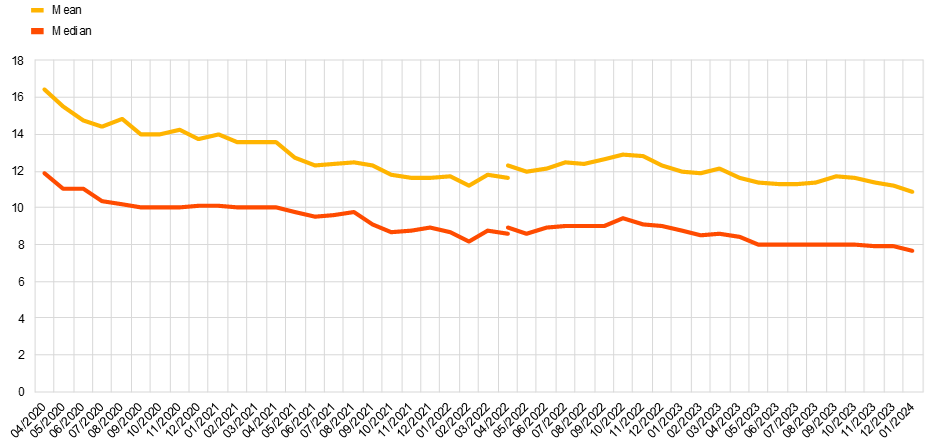
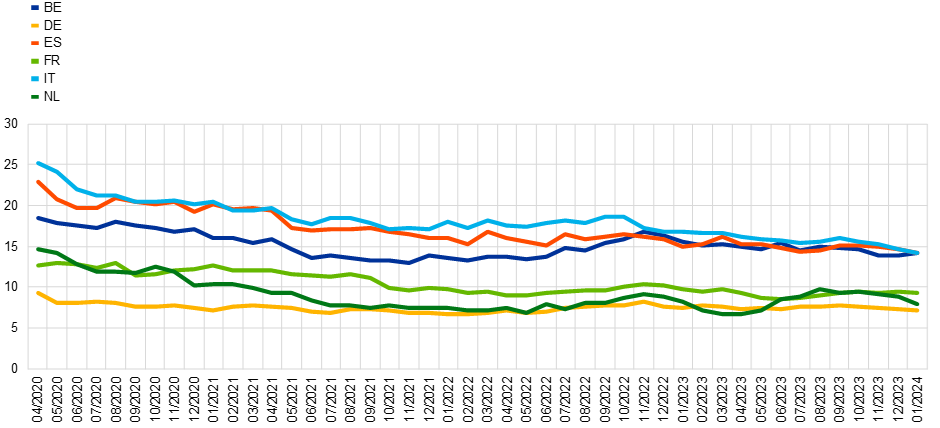
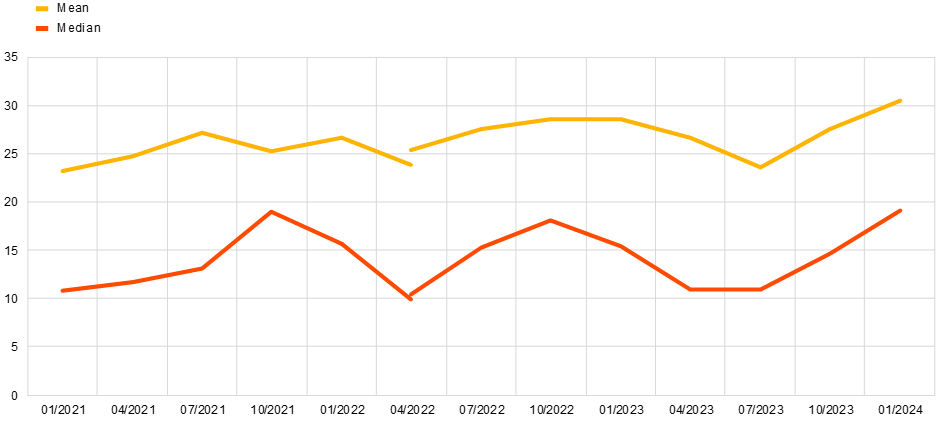
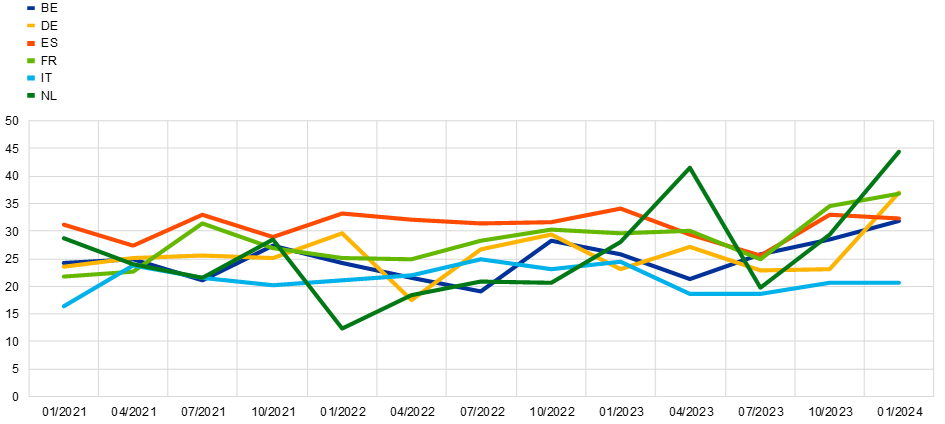
Perceived current unemployment rate
Respondents are asked: “What do you think is the current unemployment rate in the country you currently live in?”
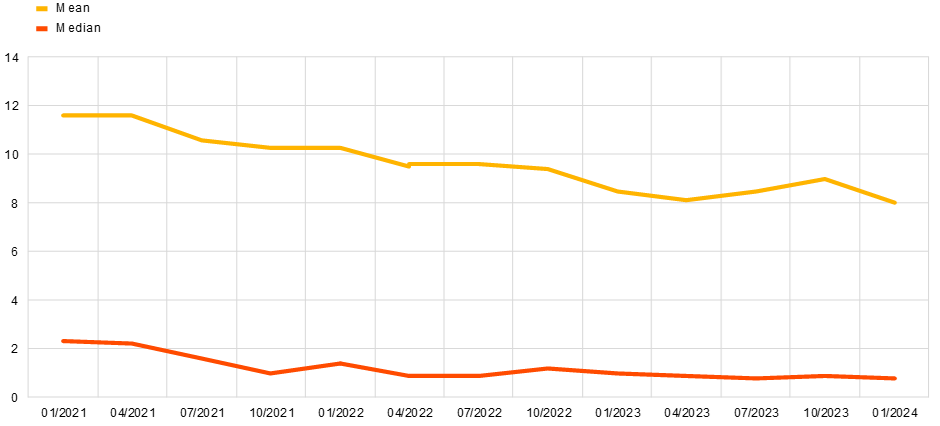
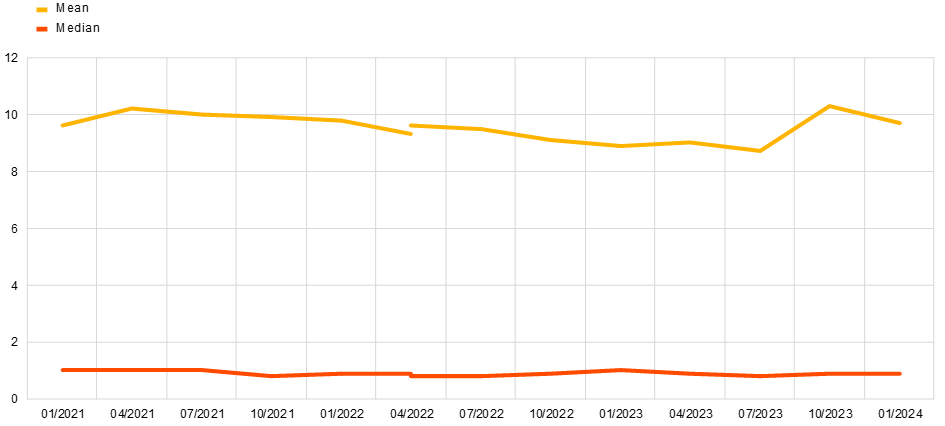
Chart 6
Perceptions of the current unemployment rate – pooled
Quantitative measure of the unemployment rate
(percentages)
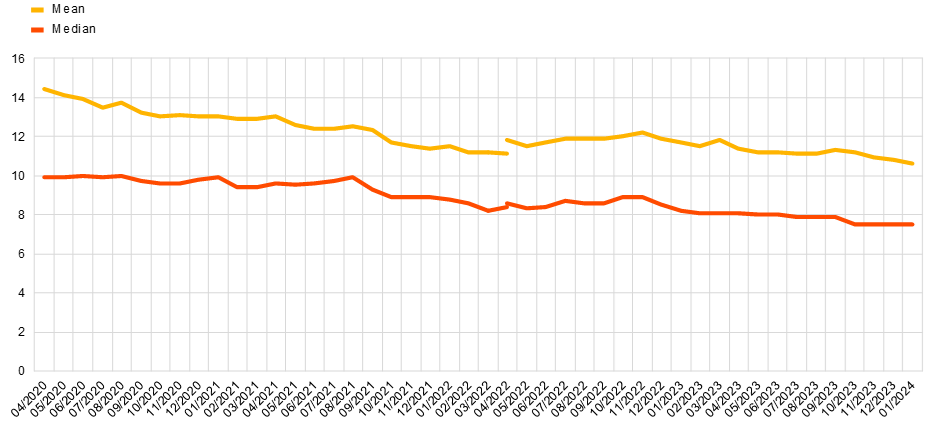
Source: CES.
Notes: Weighted estimates. Mean values are winsorised at the 2nd and 98th percentiles of each survey round and country. The median is computed on the basis of a symmetric linear interpolation that accounts for rounding of responses. The shift in the time series in April 2022 visualises the change in the composition of the aggregates due to the inclusion of five additional countries (IE, GR, AT, PT and FI).
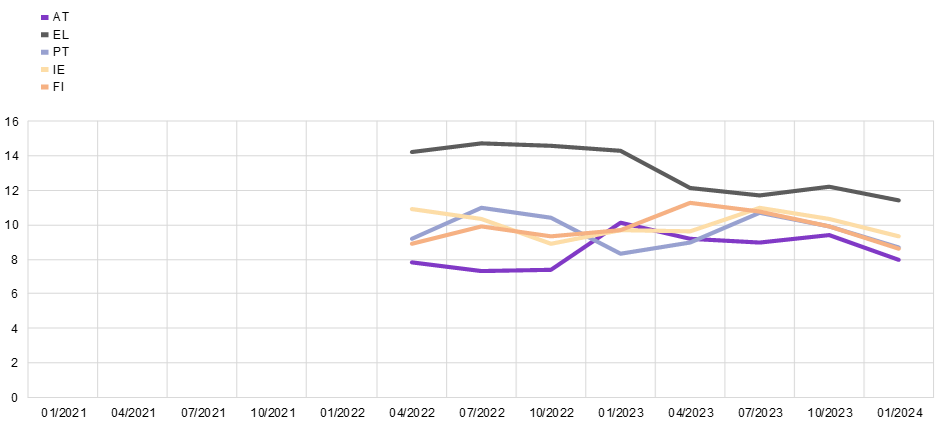
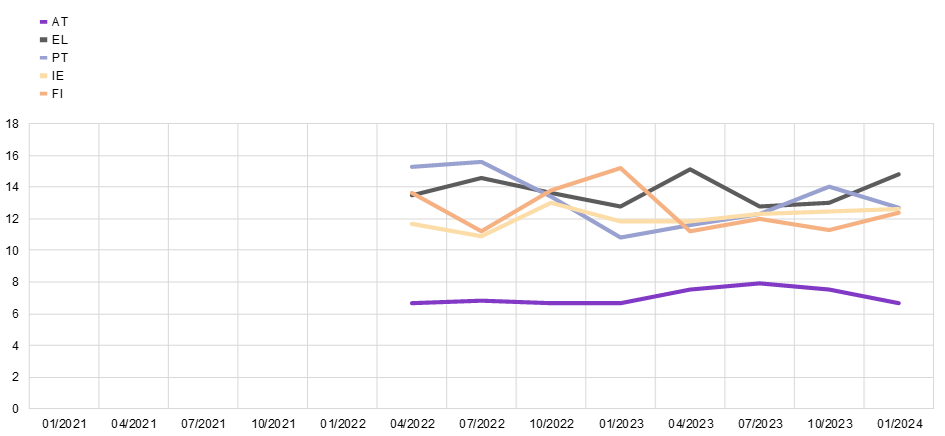
Chart 7
Mean perceptions of the current unemployment rate – by country
Quantitative measure of the unemployment rate
(percentages)

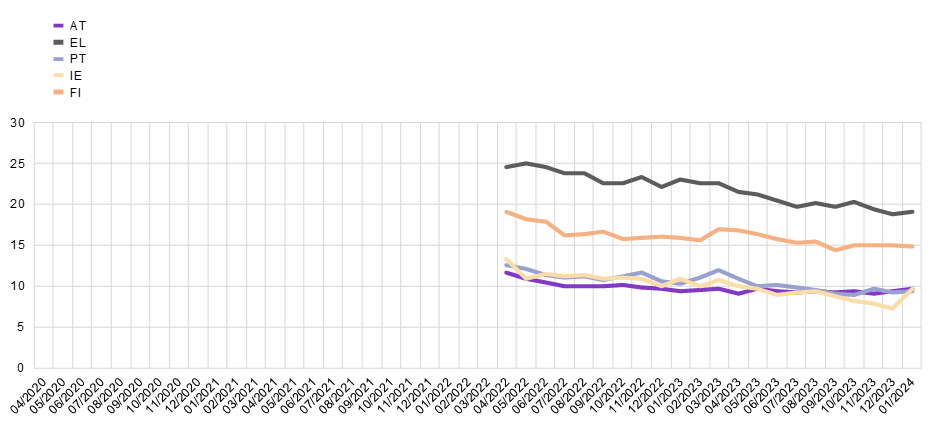
Source: CES.
Notes: Weighted estimates. Mean values are winsorised at the 2nd and 98th percentiles of each survey round and country.
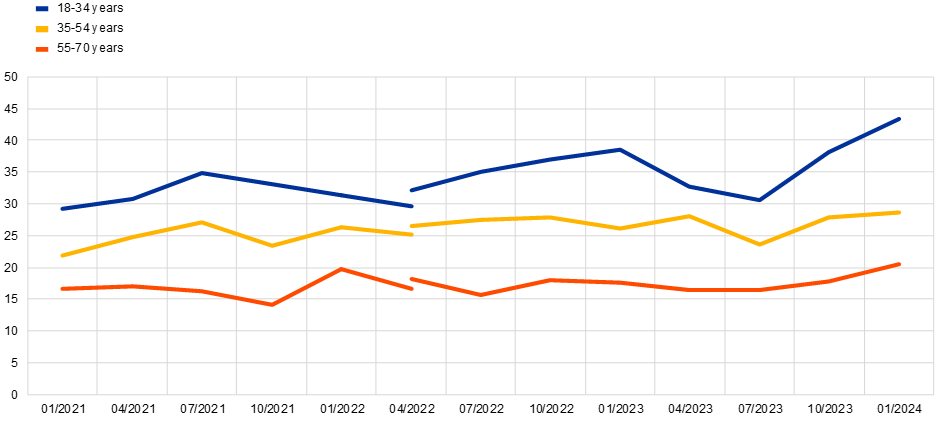
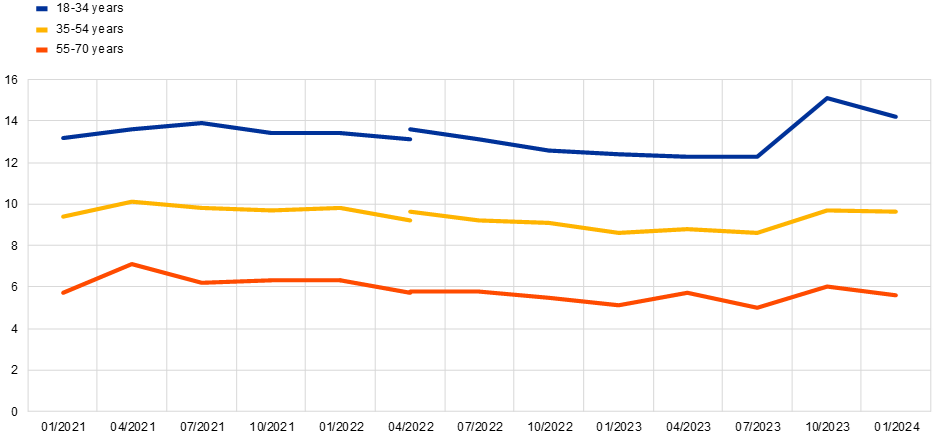
Chart 8
Mean perceptions of the current unemployment rate – by age group
Quantitative measure of the unemployment rate
(percentages)

Source: CES.
Notes: Weighted estimates. Mean values are winsorised at the 2nd and 98th percentiles of each survey round and country. The shift in the time series in April 2022 visualises the change in the composition of the aggregates due to the inclusion of five additional countries (IE, GR, AT, PT and FI).
Chart 9
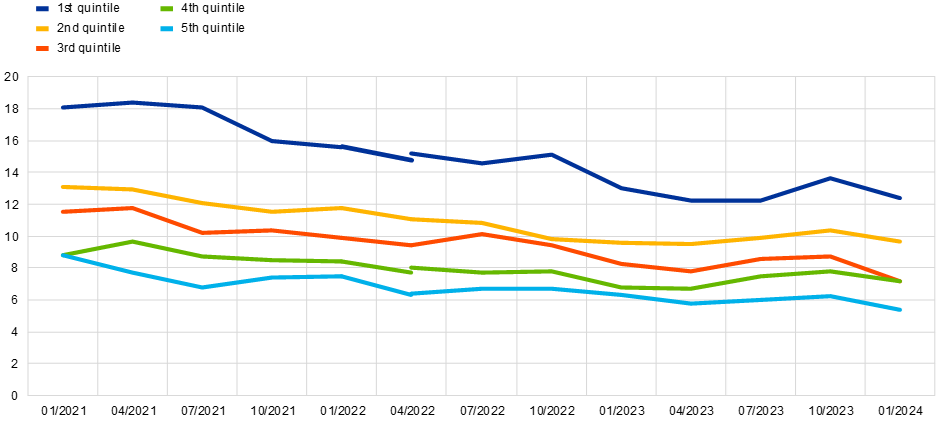
Mean perceptions of the current unemployment rate – by income quintile
Quantitative measure of the unemployment rate
(percentages)
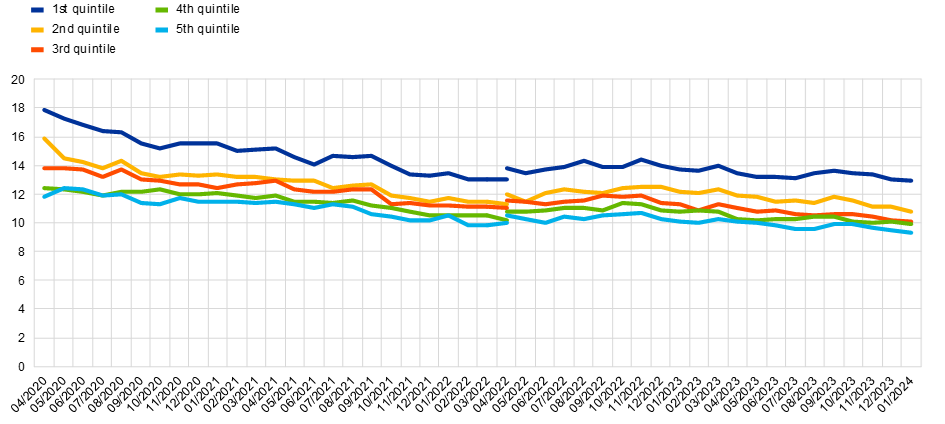
Source: CES.
Notes: Weighted estimates. Mean values are winsorised at the 2nd and 98th percentiles each survey round and country. The shift in the time series in April 2022 visualises the change in the composition of the aggregates due to the inclusion of five additional countries (IE, GR, AT, PT and FI).
Expected unemployment rate 12 months ahead
Respondents are asked: “What do you think will be the unemployment rate 12 months from now in the country you currently live in?”
Chart 10
Expected unemployment rate 12 months ahead – pooled
Quantitative measure of the unemployment rate (forward-looking)
(percentages)
Source: CES.
Notes: Weighted estimates. Mean values are winsorised at the 2nd and 98th percentiles of each survey round and country. The median is computed on the basis of a symmetric linear interpolation that accounts for rounding of responses. The shift in the time series in April 2022 visualises the change in the composition of the aggregates due to the inclusion of five additional countries (IE, GR, AT, PT and FI).
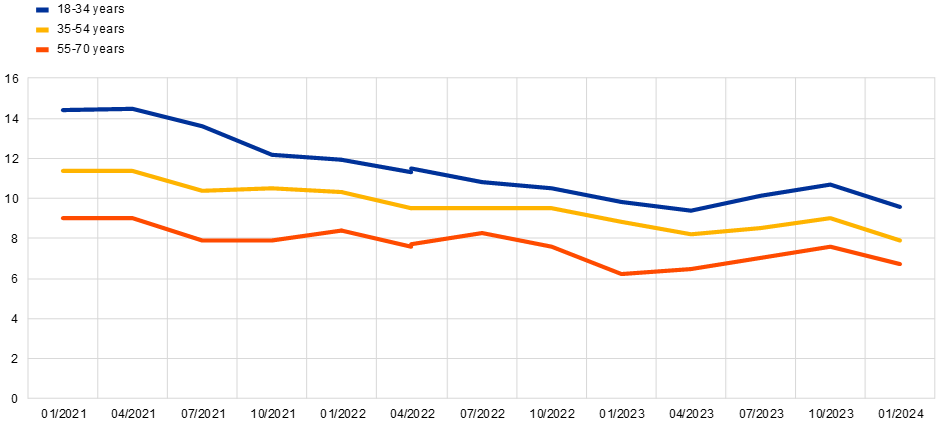
Chart 11
Mean expected unemployment rate 12 months ahead – by country
Quantitative measure of the unemployment rate (forward-looking)
(percentages)
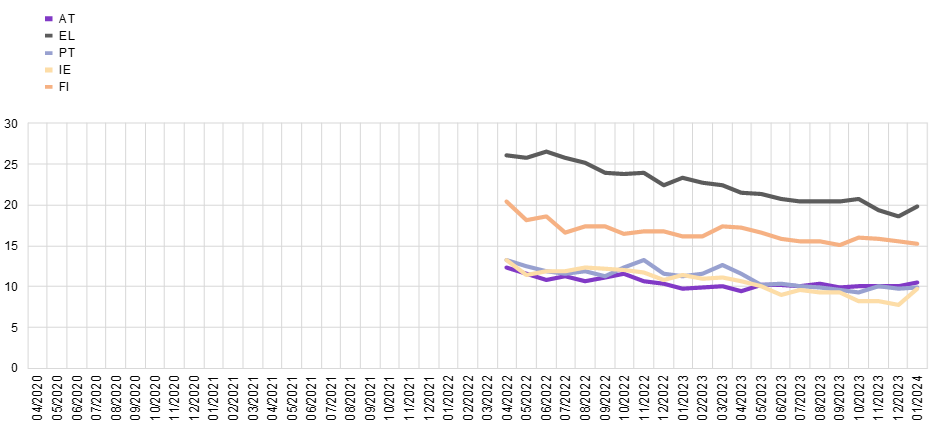
Source: CES.
Notes: Weighted estimates. Mean values are winsorised at the 2nd and 98th percentiles of each survey round and country.
Chart 12
Mean expected unemployment rate 12 months ahead – by age group
Quantitative measure of the unemployment rate (forward-looking)
(percentages)

Source: CES.
Notes: Weighted estimates. Mean values are winsorised at the 2nd and 98th percentiles of each survey round and country. The shift in the time series in April 2022 visualises the change in the composition of the aggregates due to the inclusion of five additional countries (IE, GR, AT, PT and FI).
Chart 13
Mean expected unemployment rate 12 months ahead – by income quintile
Quantitative measure of the unemployment rate (forward-looking)
(percentages)
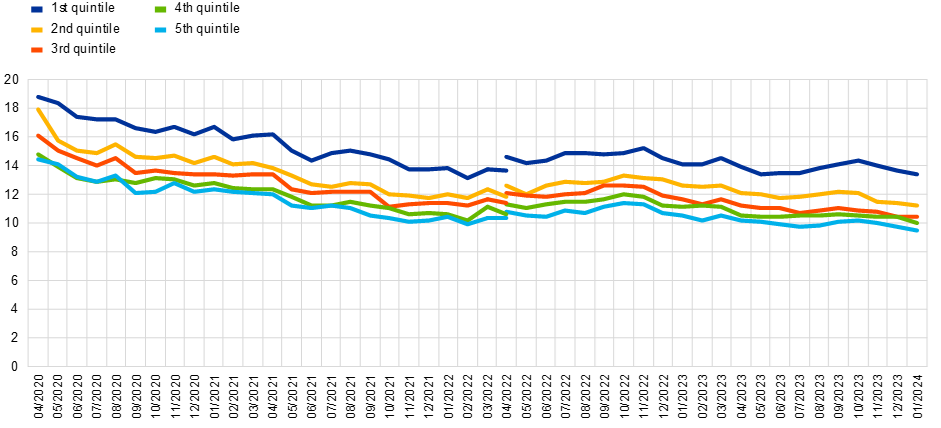
Source: CES.
Notes: Weighted estimates. Mean values are winsorised at the 2nd and 98th percentiles of each survey round and country. The shift in the time series in April 2022 visualises the change in the composition of the aggregates due to the inclusion of five additional countries (IE, GR, AT, PT and FI).
Probability of finding a job in the next three months
Respondents are asked: “Please think about the type of jobs that may be available to you. What do you think is the percent chance that, within the coming three months, you will find a job that you will accept?”.
The question is asked to respondents who are unemployed and actively looking for a job and to respondents who are unemployed and interested in having a job but are not actively looking for a job.
Chart 14
Reported probability of finding a job in the next three months – pooled
Quantitative measure of the reported probability of finding a job
(probability in percent)
Source: CES.
Notes: Weighted estimates. Mean values are winsorised at the 2nd and 98th percentiles of each survey round and country. The median is computed on the basis of a symmetric linear interpolation that accounts for rounding of responses. The shift in the time series in April 2022 visualises the change in the composition of the aggregates due to the inclusion of five additional countries (IE, GR, AT, PT and FI).
Chart 15
Mean reported probability of finding a job in the next three months – by country
Quantitative measure of the reported probability of finding a job
(probability in percent)

Source: CES.
Notes: Weighted estimates. Mean values are winsorised at the 2nd and 98th percentiles of each survey round and country.
Chart 16
Mean reported probability of finding a job in the next three months – by age group
Quantitative measure of the reported probability of finding a job
(probability in percent)
Source: CES.
Notes: Weighted estimates. Mean values are winsorised at the 2nd and 98th percentiles of each survey round and country. The shift in the time series in April 2022 visualises the change in the composition of the aggregates due to the inclusion of five additional countries (IE, GR, AT, PT and FI).
Chart 17
Mean reported probability of finding a job in the next three months – by income quintile
Quantitative measure of the reported probability of finding a job
(probability in percent)

Source: CES.
Notes: Weighted estimates. Mean values are winsorised at the 2nd and 98th percentiles of each survey round and country. The shift in the time series in April 2022 visualises the change in the composition of the aggregates due to the inclusion of five additional countries (IE, GR, AT, PT and FI).
Probability of losing your job in the next three months
Respondents are asked: “What do you think is the percent chance that you will lose your current job during the next three months?”
The question is asked to respondents who are working full-time or part-time, temporarily laid-off or on extended leave.
Chart 18
Reported probability of losing your job in the next three months – pooled
Quantitative measure of the reported probability of job loss
(probability in percent)
Source: CES.
Notes: Weighted estimates. Mean values are winsorised at the 2nd and 98th percentiles of each survey round and country. The median is computed on the basis of a symmetric linear interpolation that accounts for rounding of responses. The shift in the time series in April 2022 visualises the change in the composition of the aggregates due to the inclusion of five additional countries (IE, GR, AT, PT and FI).
Chart 19
Mean reported probability of losing your job in the next three months – by country
Quantitative measure of the reported probability of job loss
(probability in percent)

Source: CES.
Notes: Weighted estimates. Mean values are winsorised at the 2nd and 98th percentiles of each survey round and country.
Chart 20
Mean reported probability of losing your job in the next three months – by age group
Quantitative measure of the reported probability of job loss
(probability in percent)
Source: CES.
Notes: Weighted estimates. Mean values are winsorised at the 2nd and 98th percentiles of each survey round and country. The shift in the time series in April 2022 visualises the change in the composition of the aggregates due to the inclusion of five additional countries (IE, GR, AT, PT and FI).
Chart 21
Mean reported probability of losing your job in the next three months – by income quintile
Quantitative measure of the reported probability of job loss
(probability in percent)
Source: CES.
Notes: Weighted estimates. Mean values are winsorised at the 2nd and 98th percentiles of each survey round and country. The shift in the time series in April 2022 visualises the change in the composition of the aggregates due to the inclusion of five additional countries (IE, GR, AT, PT and FI).
Probability of looking for a job in the next three months
Respondents are asked: “What do you think is the percent chance that within the coming three months, you will start looking for a (new) job?”
The question is asked to all respondents who indicate that they are not currently searching for a job, including employed, unemployed and some inactive groups such as students or people who are taking care of others at home.
Chart 22
Reported probability of looking for a job in the next three months – pooled
Quantitative measure of the reported probability of looking for a job
(probability in percent)
Source: CES.
Notes: Weighted estimates. Mean values are winsorised at the 2nd and 98th percentiles of each survey round and country. The median is computed on the basis of a symmetric linear interpolation that accounts for rounding of responses. The shift in the time series in April 2022 visualises the change in the composition of the aggregates due to the inclusion of five additional countries (IE, GR, AT, PT and FI).
Chart 23
Mean reported probability of looking for a job in the next three months – by country
Quantitative measure of the reported probability of looking for a job
(probability in percent)

Source: CES.
Notes: Weighted estimates. Mean values are winsorised at the 2nd and 98th percentiles of each survey round and country.
Chart 24
Mean reported probability of looking for a job in the next three months – by age group
Quantitative measure of the reported probability of looking for a job
(probability in percent)
Source: CES.
Notes: Weighted estimates. Mean values are winsorised at the 2nd and 98th percentiles of each survey round and country. The shift in the time series in April 2022 visualises the change in the composition of the aggregates due to the inclusion of five additional countries (IE, GR, AT, PT and FI).
Chart 25
Mean reported probability of looking for a job in the next three months – by income quintile
Quantitative measure of the reported probability of looking for a job
(probability in percent)

Source: CES.
Notes: Weighted estimates. Mean values are winsorised at the 2nd and 98th percentiles of each survey round and country. The shift in the time series in April 2022 visualises the change in the composition of the aggregates due to the inclusion of five additional countries (IE, GR, AT, PT and FI).