
Economic, financial and monetary developments
Overview
The Governing Council decided at its meeting on 14 December 2023 to keep the three key ECB interest rates unchanged. While inflation has dropped in recent months, it is likely to pick up again temporarily in the near term.[1] According to the December 2023 Eurosystem staff macroeconomic projections for the euro area, inflation is expected to decline gradually over the course of 2024, before approaching the Governing Council’s 2% target in 2025. Overall, Eurosystem staff expect headline inflation to average 5.4% in 2023, 2.7% in 2024, 2.1% in 2025 and 1.9% in 2026. Compared with the September 2023 ECB staff macroeconomic projections for the euro area, this amounts to a downward revision for 2023 and especially for 2024.
Underlying inflation has eased further. But domestic price pressures remain elevated, primarily owing to strong growth in unit labour costs. Eurosystem staff expect inflation excluding energy and food to average 5.0% in 2023, 2.7% in 2024, 2.3% in 2025 and 2.1% in 2026.
The past interest rate increases continue to be transmitted forcefully to the economy. Tighter financing conditions are dampening demand, and this is helping to push down inflation. Eurosystem staff expect economic growth to remain subdued in the near term. Beyond that, the economy is expected to recover because of rising real incomes – as people benefit from falling inflation and growing wages – and improving foreign demand. Eurosystem staff therefore see growth picking up from an average of 0.6% for 2023 to 0.8% for 2024, and to 1.5% for both 2025 and 2026.
The Governing Council is determined to ensure that inflation returns to its 2% medium-term target in a timely manner. Based on its current assessment, the Governing Council considers that the key ECB interest rates are at levels that, maintained for a sufficiently long duration, will make a substantial contribution to this goal. The Governing Council’s future decisions will ensure that its policy rates will be set at sufficiently restrictive levels for as long as necessary.
The Governing Council will continue to follow a data-dependent approach to determining the appropriate level and duration of restriction. In particular, its interest rate decisions will be based on its assessment of the inflation outlook in light of the incoming economic and financial data, the dynamics of underlying inflation and the strength of monetary policy transmission.
The key ECB interest rates are the primary tool for setting the monetary policy stance. At its meeting on 14 December 2023, the Governing Council also decided to advance the normalisation of the Eurosystem’s balance sheet. It intends to continue to reinvest, in full, the principal payments from maturing securities purchased under the pandemic emergency purchase programme (PEPP) during the first half of 2024. Over the second half of the year, it intends to reduce the PEPP portfolio by €7.5 billion per month on average. The Governing Council intends to discontinue reinvestments under the PEPP at the end of 2024.
Economic activity
The euro area economy contracted slightly in the third quarter of 2023, mostly owing to a decline in inventories. Tighter financing conditions and subdued foreign demand are likely to continue weighing on economic activity in the near term. Prospects are especially weak for construction and manufacturing, the two sectors most affected by higher interest rates. Services activity is also set to soften in the coming months. This is due to spillovers from weaker industrial activity, fading effects from the reopening of the economy and the broadening impact of tighter financing conditions.
The labour market continues to support the economy. The unemployment rate stood at 6.5% in October and employment grew by 0.2% over the third quarter. At the same time, the weaker economy is dampening the demand for workers, with firms advertising fewer vacancies in recent months. Moreover, even though more people are in work, the total number of hours worked edged down by 0.1% in the third quarter.
According to the December 2023 projections, available short-term indicators suggest that economic activity will remain weak in the fourth quarter of 2023. However, growth is expected to strengthen from early 2024 onwards, as real disposable income rises – supported by declining inflation, robust wage growth and resilient employment – and export growth catches up with improvements in foreign demand. The impact of the ECB’s monetary policy tightening and adverse credit supply conditions continues to feed through to the economy, affecting the near-term growth outlook. These dampening effects are expected to fade later in the projection horizon, supporting growth. Overall, annual average real GDP growth is expected to slow down from 3.4% in 2022 to 0.6% in 2023, before recovering to 0.8% in 2024 and stabilising at 1.5% in 2025 and 2026. Compared with the September 2023 projections, the outlook for GDP growth has been slightly revised down for 2023-24, on the back of the recent data releases and weak survey data, whereas it is unrevised for 2025.
As the energy crisis fades, governments should continue to roll back the related support measures. This is essential to avoid driving up medium-term inflationary pressures, which would otherwise call for even tighter monetary policy. Fiscal policies should be designed to make the euro area economy more productive and to gradually bring down high public debt. Structural reforms and investments to enhance the euro area’s supply capacity – which would be supported by the full implementation of the Next Generation EU programme – can help reduce price pressures in the medium term, while supporting the green and digital transitions. To that end, it is important to swiftly agree on the reform of the EU’s economic governance framework. Moreover, it is imperative that progress towards capital markets union and the completion of banking union be accelerated.
Inflation
Inflation dropped over October and November 2023, falling to an annual rate of 2.4% in November according to Eurostat’s flash release. This decline was broad-based. Energy price inflation fell further and food price inflation also came down, despite remaining relatively high overall. In December 2023 inflation is likely to pick up on account of an upward base effect for the cost of energy. In 2024 Eurosystem staff expect inflation to decline more slowly because of further upward base effects and the phasing-out of past fiscal measures aimed at limiting the repercussions of the energy price shock.
Inflation excluding energy and food dropped by almost a full percentage point over October and November 2023, falling to 3.6% in November. This reflects improving supply conditions, the fading effects of the past energy shock and the impact of tighter monetary policy on demand and on the pricing power of firms. The inflation rates for goods and services fell to 2.9% and 4.0% respectively.
All measures of underlying inflation declined in October, but domestic price pressures remained elevated, chiefly because of strong wage growth together with falling productivity. Measures of longer-term inflation expectations mostly stand around 2%, with some market-based indicators of inflation compensation declining from elevated levels.
According to the December 2023 projections, the expected temporary pick-up in inflation notwithstanding, the underlying disinflationary process is expected to continue. Despite some cooling, the labour market is projected to remain tight which, together with compensation effects from past high inflation, should keep nominal wage growth high. Nevertheless, wage growth is expected to ease over the projection horizon as the upward impacts from inflation compensation gradually fade. Profits expanded notably in 2022, but are set to weaken over the projection horizon and provide a buffer to the pass-through of labour costs. Overall, with medium-term inflation expectations assessed to remain anchored at the ECB’s 2% inflation target, headline HICP inflation is expected to decrease from 5.4% in 2023 to an average of 2.7% in 2024, 2.1% in 2025 and 1.9% in 2026. Compared with the September 2023 projections, HICP inflation has been revised down for 2023 and 2024, mainly owing to lower than expected recent data outturns and lower assumptions for energy commodity prices, whereas it is unrevised for 2025.
Risk assessment
The risks to economic growth remain tilted to the downside. Growth could be lower if the effects of monetary policy turn out stronger than expected. A weaker world economy or a further slowdown in global trade would also weigh on euro area growth. Russia’s unjustified war against Ukraine and the tragic conflict in the Middle East are key sources of geopolitical risk. This may result in firms and households becoming less confident about the future. Growth could be higher if rising real incomes raise spending by more than anticipated, or the world economy grows more strongly than expected.
Upside risks to inflation include the heightened geopolitical tensions, which could raise energy prices in the near term, and extreme weather events, which could drive up food prices. Inflation could also turn out higher than anticipated if inflation expectations were to move above the Governing Council’s target, or if wages or profit margins increased by more than expected. By contrast, inflation may surprise on the downside if monetary policy dampens demand by more than expected or the economic environment in the rest of the world worsens unexpectedly, potentially owing in part to the recent rise in geopolitical risks.
Financial and monetary conditions
Market interest rates have fallen markedly since the Governing Council’s monetary policy meeting on 26 October 2023 and lie below the rates embedded in the staff projections. The Governing Council’s restrictive monetary policy continues to transmit strongly into broader financing conditions. Lending rates rose again in October, to 5.3% for business loans and 3.9% for mortgages.
Higher borrowing rates, subdued loan demand and tighter loan supply have further weakened credit dynamics. Loans to firms declined at an annual rate of 0.3% in October and loans to households also remained subdued, growing at an annual rate of 0.6%. With weaker lending and the reduction in the Eurosystem’s balance sheet, broad money – as measured by M3 – has continued to contract. In October it fell at an annual rate of 1.0%.
In line with its monetary policy strategy, the Governing Council thoroughly assessed the links between monetary policy and financial stability. Euro area banks have demonstrated their resilience. They have high capital ratios and have become significantly more profitable over the past year. But the financial stability outlook remains fragile in the current environment of tightening financing conditions, weak growth and geopolitical tensions. In particular, the situation could worsen if banks’ funding costs were to increase by more than expected and if more borrowers were to struggle to repay their loans. At the same time, the overall impact of such a scenario on the economy should be contained if financial markets react in an orderly fashion. Macroprudential policy remains the first line of defence against the build-up of financial vulnerabilities, and the measures in place contribute to preserving the financial system’s resilience.
Monetary policy decisions
The interest rate on the main refinancing operations and the interest rates on the marginal lending facility and the deposit facility remain unchanged at 4.50%, 4.75% and 4.00% respectively.
The asset purchase programme portfolio is declining at a measured and predictable pace, as the Eurosystem no longer reinvests the principal payments from maturing securities.
The Governing Council intends to continue to reinvest, in full, the principal payments from maturing securities purchased under the PEPP during the first half of 2024. Over the second half of the year, it intends to reduce the PEPP portfolio by €7.5 billion per month on average. The Governing Council intends to discontinue reinvestments under the PEPP at the end of 2024.
The Governing Council will continue applying flexibility in reinvesting redemptions coming due in the PEPP portfolio, with a view to countering risks to the monetary policy transmission mechanism related to the pandemic.
As banks are repaying the amounts borrowed under the targeted longer-term refinancing operations, the Governing Council will regularly assess how targeted lending operations and their ongoing repayment are contributing to its monetary policy stance.
Conclusion
The Governing Council decided at its meeting on 14 December 2023 to keep the three key ECB interest rates unchanged. The Governing Council is determined to ensure that inflation returns to its 2% medium-term target in a timely manner. Based on its current assessment, the Governing Council considers that rates are at levels that, maintained for a sufficiently long duration, will make a substantial contribution to the timely return of inflation to the target. The Governing Council’s future decisions will ensure that the key ECB interest rates will be set at sufficiently restrictive levels for as long as necessary to ensure such a timely return. The Governing Council will continue to follow a data-dependent approach to determining the appropriate level and duration of restriction.
The Governing Council intends to reduce the PEPP portfolio over the second half of 2024 and to discontinue its reinvestments under the PEPP at the end of 2024.
In any case, the Governing Council stands ready to adjust all of its instruments within its mandate to ensure that inflation returns to its medium-term target and to preserve the smooth functioning of monetary policy transmission.
1 External environment
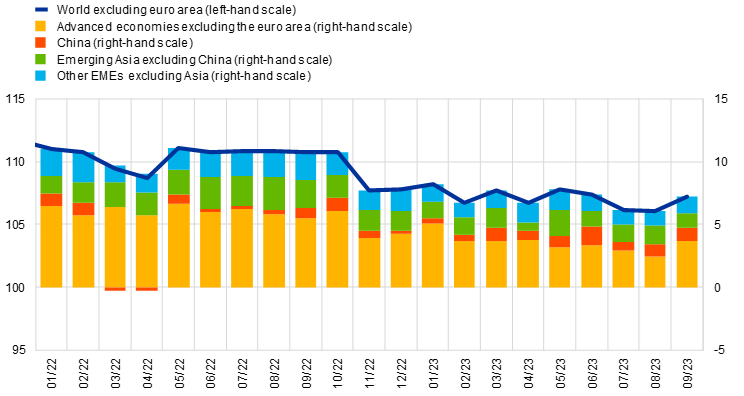
The global economy is estimated to have expanded at a moderate but steady pace in 2023 reflecting strong private consumption and the support of resilient labour markets. Global growth is projected to decrease slightly in 2024, mainly reflecting the impact of monetary policy tightening across advanced economies. Compared with the September 2023 ECB staff macroeconomic projections, the outlook for global growth in the December 2023 Eurosystem staff macroeconomic projections remains broadly unchanged, with the global economy still projected to expand at a rate below the historical average over the projection horizon. After a weak performance in 2023, global trade growth is expected to pick up again over the rest of the projection horizon and increase broadly in line with global activity. Compared with the September projections, growth in both global imports and euro area foreign demand has been revised upwards for 2023, largely on account of better than estimated outturns in the second and third quarter. However, foreign demand growth over the rest of the projection horizon has been revised downwards compared with the September projections. Export prices of euro area competitors (in national currencies) are estimated to have declined sharply in the second quarter of 2023, as commodity prices continued to fall and domestic and foreign pipeline pressures eased. They are projected to rebound gradually and converge towards their long-term average growth rate over the projection horizon.
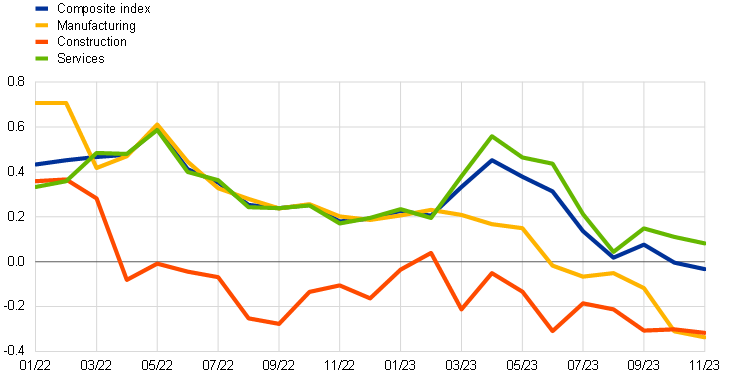
In 2023 global economic growth was moderate but steady amid strong private consumption and resilient labour markets. Global economic activity has been underpinned by emerging market economies including China, and, among advanced economies, by the United States.[2] Solid domestic demand and a strong labour market in the United States resulted in robust growth despite significant monetary policy tightening. In China, the lifting of coronavirus (COVID-19) restrictions at the start of the year and a broader recovery in private consumption compensated for weakness in the residential sector. Most recent data provide mixed signals across large economies. While real GDP growth strengthened in both China and the United States in the third quarter, it remained flat in the United Kingdom and contracted in Japan as a result of high inflation weighing on activity and consumption in both. Global real GDP is expected to decelerate slightly in the fourth quarter as previous tailwinds dissipate, which is in line with the latest global composite output Purchasing Managers’ Index (PMI). After declining for six consecutive months, the composite PMI broadly stabilised in November and remains in expansionary territory. Across sectors, PMI data suggest that manufacturing activity remains subdued, with the index still hovering around the neutral threshold. At the same time, post-COVID-19 growth momentum seems to be waning for services, with the related PMI declining steadily during the second half of the year before stabilising slightly above the neutral threshold in November (Chart 1).
Chart 1
Global PMI output (excluding the euro area)
(diffusion indices)

Sources: S&P Global Market Intelligence and ECB staff calculations.
Note: The latest observations are for November 2023.
The global economy is projected to expand at a rate below the historical average over the projection horizon. Global growth is projected to slow down slightly in 2024 (3.1% compared with 3.3% in 2023), which mainly reflects the delayed impact of monetary policy tightening across advanced economies. At the same time, growth prospects in advanced economies have been reassessed. In the United States, real GDP growth has been revised upwards, with recent economic resilience suggesting a softer landing and a smoother disinflationary process. In the United Kingdom, the economy is expected to avoid a recession, but growth has been revised downwards in 2024 and 2025 to reflect weaker data and the impact of monetary policy tightening amid high inflation. The growth outlook remains broadly unrevised in emerging Asia and China. In China, economic growth is projected to gradually decrease over the projection horizon owing to structural factors, such as population ageing. The global economy is projected to continue growing at a rate of 3.2% in both 2025 and 2026, which remains below the 2012-19 historical average of 3.6%. Compared with the September 2023 projections, global real GDP growth has been revised up by 0.1 percentage point for both 2023 and 2024.
As consumption patterns return to normal after the pandemic, world trade growth is expected to remain weak in 2023 and to recover thereafter. Annual trade growth in 2023 is estimated at 1.1% owing to a negative carryover effect, but had already shown signs of improvement as early as the second quarter of 2023. The weak trade performance in annual terms is explained by global growth having a less trade-friendly composition as a result of consumption making up a bigger share of domestic demand and the larger contribution made by emerging countries, which have a lower trade elasticity. Trade growth this year was also hindered by the rebound in services consumption owing to the complete lifting of COVID-19 restrictions. Over the projection horizon, global trade is projected to recover gradually and start growing more in line with global activity, as firms start to restock and private consumption patterns turn back towards goods. This is in line with the latest data for global merchandise trade, which returned to positive growth in September after remaining broadly flat in the previous two months (Chart 2). Global trade is projected to grow by 3.0% in 2024 and 2025 and by 3.2% in 2026, a downward revision compared with the September projections (by -0.2 percentage points in 2024 and -0.3 percentage points in 2025), reflecting our reassessment of the speed at which global trade elasticity will return to its expected long-term value. Euro area foreign demand is projected to grow by 2.6% in 2024, 2.9% in 2025 and 3.1% in 2026 and it has also been revised downwards compared with the previous round of projections in both 2024 and 2025 (by -0.4 and -0.1 percentage points respectively).
Chart 2
Global merchandise import growth (excluding the euro area)
(index contributions, December 2019=100)
Sources: CPB and ECB staff calculations.
Note: The latest observations are for September 2023.
Global headline consumer price index (CPI) inflation remains on a downward path, supported by lower energy and food prices, although core inflation remains high. Headline CPI inflation across the member countries of the Organisation for Economic Co-operation and Development (OECD) decreased in October to 5.6% (from 6.2% in September), reflecting a fall in the contribution of energy and, to a lesser extent, food components. Core (excluding food and energy) inflation declined by a smaller margin to 6.5% (from 6.6% in September). Annual inflation remains very high in Türkiye, although it did moderate somewhat in October to 72% (down from 75% in September). Excluding Türkiye, headline inflation declined to 3.6% from 4.2% in September and core inflation declined from 4.4% to 4.2% (Chart 3). Euro area competitors’ export prices are estimated to have dropped below their long-term average growth rate in the second quarter of 2023, as commodity prices continued to fall and domestic and foreign pipeline pressures eased. They are projected to rebound at the turn of the year as the decline in commodity prices exerts less of a drag.
Chart 3
(annual percentage changes, percentage point contributions)
Sources: OECD and ECB calculations.
Notes: The OECD aggregate excludes Türkiye and is calculated using OECD consumer price index annual weights. Core inflation refers to inflation for all items excluding food and energy. The latest observations are for October 2023.
Crude oil prices have declined since the September 2023 projections amid weakening global demand. According to the International Energy Agency, oil demand in Europe weakened by around 0.8 million barrels per day during the third quarter, while US oil demand has also started to decline more recently. Weakening demand in advanced economies outweighed upward price pressures stemming from continuously strong oil demand from China, the decision by OPEC+ to extend existing voluntary production cuts to the first quarter of 2024 and to raise them by an additional 0.9% of global supply, and supply risks resulting from the conflict in the Middle East. European gas prices also declined as demand remained below historical averages at the beginning of the heating season. Recent supply risks from the closure of an Israeli gas field, disruptions in the gas pipeline between Finland and Estonia and the possibility of further strikes at liquified natural gas terminals in Australia were also resolved and priced out by financial markets. However, further volatility in the gas market cannot be completely ruled out because prices remain sensitive to supply shocks similar to those experienced throughout 2023.
Compared with the September 2023 projections, global financial conditions fluctuated but ultimately eased slightly across advanced economies. At the start of the review period (from 14 September to 13 December 2023), they tightened considerably across advanced economies as long-term sovereign bond yields were driven up, mainly as a result of higher risk compensation owing to greater uncertainty about future short-term interest rates. However, this tightening was more than reversed after inflation came in slightly below expectations in several jurisdictions, while some central banks also softened their communication on whether additional interest rate increases would be necessary. In the United States, market expectations that inflation would soften further amid resilient but slowing growth fostered a downward shift in monetary policy expectations and supported risk sentiment. In general, the price of riskier assets moved in tandem with interest rate fluctuations to end the period slightly higher.
US economic growth in 2023 has been more resilient than previously anticipated but is expected to moderate in the near term as tighter monetary policy restrains spending and the labour market loosens. Real GDP in the third quarter of 2023 grew by 1.3% quarter on quarter (5.2% on an annualised basis) on the back of buoyant private consumption, a rebound in private inventory investment and strong government spending. High frequency indicators, such as credit card spending and retail sales, suggest a deceleration in consumer spending in the fourth quarter. In addition, the resumption of student loan repayments in October and the steep reduction in excess savings will exert additional pressure on household balance sheets. Economic growth is expected to recover from the second half of 2024 onwards. In October, annual headline CPI inflation fell to 3.2% (0.5 percentage points lower than in September), mainly owing to falling energy prices, while annual core inflation ticked down slightly to 4.0% (0.1 percentage point lower than in September). Although it has fallen since the start of this year, services inflation (excluding housing) remained high at just below 4% in October, while both core goods and services inflation are on a downward path.
In China, recent indicators point to a stabilisation in economic activity despite weakness in the real estate sector. In the third quarter of 2023 real GDP growth rebounded to 1.3% quarter on quarter, above market expectations. This upturn was primarily driven by stronger consumer spending, while the contraction in property investment continued to deepen, albeit at a slower pace compared with previous months. Monthly indicators on industrial production and retail sales consolidated their recovery in October. Household spending surprised to the upside in October, particularly for car purchases and travel, coinciding with the Chinese Golden Week holiday. At the same time, the production and consumption of goods and services closely related to the property market continued to show subdued growth, suggesting an ongoing two-speed recovery within the Chinese economy. Annual headline CPI inflation returned to negative territory again in October. Headline CPI inflation fell by 0.2% year on year after remaining unchanged in September. The downturn was primarily attributed to a sharper decline in food prices, led by a 30.1% year-on-year contraction in pork prices, which are expected to continue falling owing to an oversupply of pork. Food price developments and weak domestic and external demand are likely to ensure inflationary pressures remain subdued.
In Japan, the economic recovery stalled in the third quarter of 2023, but growth is expected to return to positive territory in the fourth quarter of the same year. Real GDP in the third quarter of 2023 contracted by a stronger-than-expected 0.7% quarter on quarter, mainly reflecting the negative contribution from inventories and weak domestic demand and to some extent the impact of high inflation on real incomes. Real GDP is expected to return to positive but modest growth in the fourth quarter amid signs of a moderate rebound in real consumption levels. Both headline and core inflation rates picked up in October amid firm underlying price momentum. Annual headline inflation rose from 3.0% to 3.3%, mostly reflecting lower annual energy price declines, notwithstanding some moderation in still high food inflation. Annual core inflation (excluding food and energy) stood at 2.7% in October (0.1 percentage point higher compared with September), echoing a slight pick-up in core goods inflation and firm services inflation.
In the United Kingdom, previous monetary policy tightening is increasingly weighing on household spending and private investment. Real economic growth flatlined in the third quarter of 2023 as weaker domestic demand offset a particularly positive contribution from services exports. Weakening domestic demand suggests that past monetary policy tightening is increasingly affecting the economy. The flow of data continues to be mixed, as retail sales have declined and the composite PMI has generally been subdued (although it did rise back above the neutral threshold in November), while other business confidence measures have long been improving and real household income is increasing. Activity is set to remain modest in the coming quarters amid restrictive fiscal and monetary policy. It is expected to pick up towards the end of the year supported by the ongoing recovery in real wages. Annual headline CPI inflation declined markedly in October to 4.6% from 6.7% in September as the contribution from energy prices turned negative. Core inflation fell to 5.7% from 6.1% in September reflecting a fall in both core goods and services inflation. Inflation is nevertheless expected to decline more gradually from here on, as services inflation is set to remain elevated against a background of still high wage growth.
2 Economic activity
The euro area economy has weakened further in the second half of 2023, as subdued confidence, earlier competitiveness losses, renewed geopolitical tensions and tighter financing conditions all weighed on activity. Having grown only minimally over the first half of the year, real GDP contracted slightly in the third quarter, mostly owing to a decline in inventories. At the sectoral level, industrial output has been in contractionary territory since the fourth quarter of 2022 – despite some support in manufacturing from the unwinding of earlier order backlogs – while services activity continued to contribute positively to growth into the third quarter. Meanwhile, employment expanded further in the third quarter, although total hours worked edged down slightly, amid persistent labour hoarding. Incoming data for the fourth quarter of 2023 suggest growth is likely to remain muted, while the labour market is expected to slow. Growth momentum is expected to start picking up early in 2024, barring further shocks, and despite continued headwinds from adverse financing conditions on activity that are expected, however, to fade over time. Moreover, falling inflation should help push up real incomes, and export growth should catch up with improvements in foreign demand.
This outlook is broadly reflected in the December 2023 Eurosystem staff macroeconomic projections for the euro area, which foresee annual real GDP growth slowing to 0.6% in 2023, before picking up to 0.8% in 2024 and rising to 1.5% in 2025 and 2026. Compared with the September 2023 ECB staff macroeconomic projections for the euro area, the outlook for GDP growth has been revised down slightly for 2023 and 2024, but it is unrevised for 2025.
The euro area economy contracted slightly in the third quarter of 2023. Real GDP fell by 0.1% quarter on quarter in the third quarter, as changes in inventories – in part reflecting the unwinding of the strong inventory build-up in the second quarter – dragged on growth (Chart 4). After two quarters of stagnation, private consumption grew moderately in the third quarter, with government consumption also contributing positively to GDP growth, albeit to a lesser extent. The marginally positive contribution of investment masks a clear contrast between the continuing contraction in construction investment, but still positive growth in non-construction investment. The contributions from exports and imports largely offset each another. The breakdown of value added highlights the ongoing divergence across sectors into the third quarter, with modest growth in services activity, while all other sectors, particularly manufacturing, declined.
Chart 4
Euro area real GDP and its components
(quarter-on-quarter percentage changes; percentage point contributions)
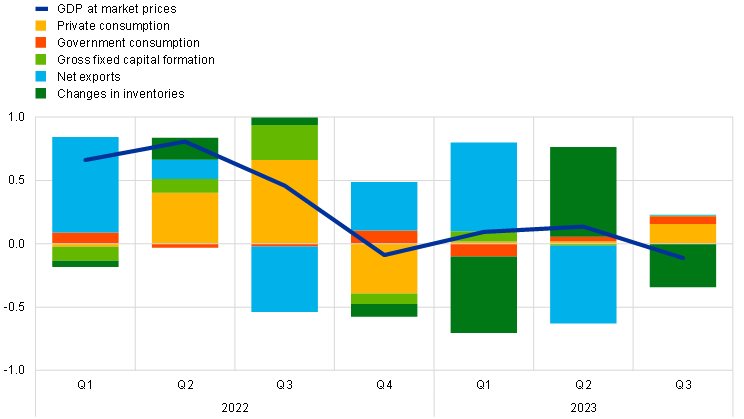
Sources: Eurostat and ECB calculations.
Note: The latest observations are for the third quarter of 2023.
Activity is expected to remain weak in the final quarter of 2023. Industrial production data for October suggest an ongoing contraction in manufacturing output in the fourth quarter. Incoming survey data – available for the period to November – point to a broader-based weakening of activity in the fourth quarter. This reflects both the continued weakness in manufacturing activity and a greater deceleration in services, which had previously shown resilience. The composite output Purchasing Managers’ Index (PMI) continued to fall further below the growth threshold of 50 and below its third-quarter average, despite a small uptick in November on the October reading, possibly suggesting a bottoming out of the negative trend. The PMI for manufacturing output remains deep in contractionary territory, as earlier support from improved supply chain conditions looks to have run its course and backlogs of work are drying up, while new orders continue to contract (Chart 5, panel a). The weakness in activity is also evident – although less pronounced – in the services sector, where the PMI indicators for both business activity and new business have remained below the growth threshold since August (Chart 5, panel b). The European Commission’s Economic Sentiment Indicator declined somewhat further below its third-quarter average in October and November, reflecting lower confidence among consumers and firms alike, albeit with some tentative signs of the weakness in confidence bottoming out in November. At the same time, firms across services and particularly manufacturing reported weaker demand and tightening financing conditions as increasing limits to production in the fourth quarter of the year.[3]
Chart 5
PMI indicators across sectors of the economy
a) Manufacturing | b) Services |
|---|---|
(diffusion indices) | (diffusion indices) |
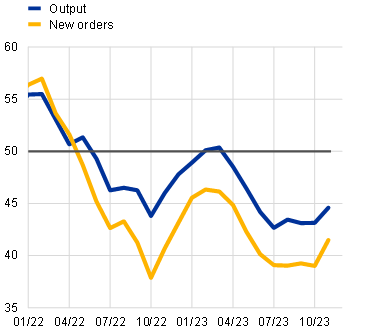 | 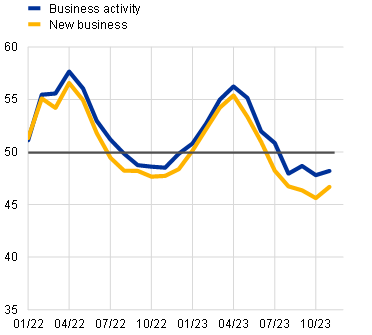 |
Source: S&P Global Market Intelligence.
Note: The latest observations are for November 2023.
Overall, the labour market remained resilient to weakening economic activity in the third quarter of 2023. Employment increased by 0.2% in the third quarter, while total hours worked declined by 0.1% (Chart 6, panel a). Employment has increased by 3.5% since the fourth quarter of 2019 and the total number of hours worked has risen by 2.1%. This implies a 1.3% decline in average hours worked, related to ongoing labour hoarding (the part of labour input which is not fully utilised by a company during its production process at any given point in time), as well as to other factors such as an increase in sick leave. The labour force edged up once again, by 0.1% in the third quarter of 2023 and an additional 0.2% in October. It is estimated to have increased by about 1.5 million people since December 2022. The unemployment rate was 6.5% in October, broadly unchanged compared with September and remaining close to its lowest level since the euro was introduced. Labour demand is gradually declining but remains at high levels, with the job vacancy rate falling marginally to 2.9%, 0.1 percentage points lower than in the previous quarter.
Chart 6
Euro area employment, the PMI assessment of employment and the unemployment rate, and sectoral employment PMIs
a) Employment, PMI assessment of employment and unemployment rate
(left-hand scale: quarter-on-quarter percentage changes, diffusion index; right-hand scale: percentages of the labour force)
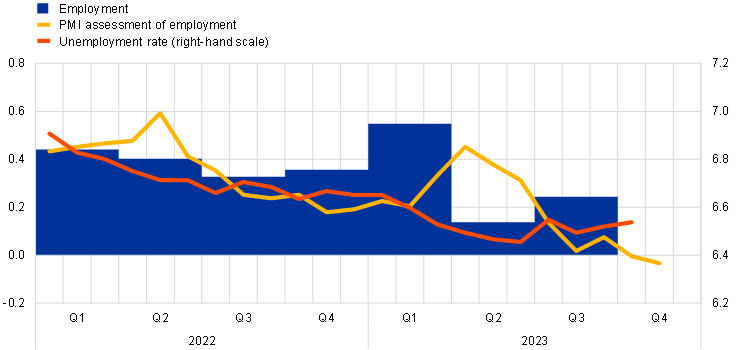
b) Sectoral employment PMIs
(diffusion indices)
Sources: Eurostat, S&P Global Market Intelligence and ECB calculations.
Notes: In panel a), the two lines indicate monthly developments, while the bars show quarterly data. The PMI is expressed in terms of the deviation from 50, then divided by 10. The latest observations are for the third quarter of 2023 for employment, November 2023 for the PMI assessment of employment and October 2023 for the unemployment rate. In panel b), the PMIs are expressed in terms of the deviation from 50, divided by 10.
Short-term labour market indicators suggest a slowdown in employment growth in the fourth quarter of 2023. The monthly composite PMI employment indicator declined from 50.0 in October to 49.7 in November; a value below the threshold of 50 indicates a decrease in employment. This indicator has declined substantially from its peak of 54.5 in April. The recent fall has been broad-based across sectors (Chart 6, panel b). Sectoral PMIs indicate downside risks to employment growth in manufacturing and construction, where the indices are below 50. While still in slightly expansionary territory, the PMI services indicator also declined and is now close to the threshold of 50.
Private consumption increased by 0.3% in the third quarter of 2023, after stagnating in the first half of the year (Chart 7, panel a). The increase in the third quarter was largely driven by households’ consumption of services, which is still benefiting from lingering reopening effects. Following a strong fall in the second quarter, spending on durable goods rebounded in the third quarter, largely reflecting delayed deliveries of previously purchased electric and hybrid vehicles. After a strong recovery, new passenger car registrations declined marginally in October to stand 0.8% below their third quarter level. By contrast, spending on non-durable (and semi-durable) goods continued to fall in the third quarter. This was reflected in the ongoing weakness in retail sales volumes, which, despite having increased marginally in October compared with the previous month, were 0.2% below their third-quarter average.
Chart 7
Real private consumption and expectations
a) Private consumption and components | b) Private consumption and retail trade, savings and services expectations |
|---|---|
(indices: fourth quarter of 2019 = 100) | (quarter-on-quarter percentage changes; standardised percentage balances) |
 | 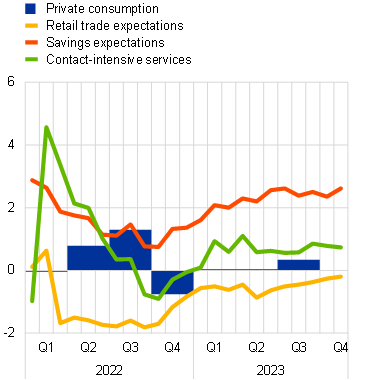 |
Sources: Eurostat, European Commission and ECB calculations.
Notes: In panel a), the levels of consumption components (domestic concept) are scaled to match the level of total private consumption (national concept). “Non-durable goods” include semi-durables. In panel b), savings expectations for the next 12 months and retail trade business expectations for the next three months are standardised over the period 1985-2019. Expected demand for contact-intensive services in the next three months is standardised over the period 2005-19 (in line with the respective length of each series); “contact-intensive services” refers to accommodation, travel and food services. The latest observations are for the third quarter of 2023 for panel a) and for the third quarter of 2023 and November 2023 for panel b).
Incoming survey data continue to point to overall weakness in spending on goods at the turn of the year. The European Commission’s consumer confidence indicator picked up in November after declining for three consecutive months, but continued to stand below its long-term average. The November outcome reflects improving expectations about the general economic outlook and households’ own financial situations. At the same time, the Commission’s indicators for expected major purchases by consumers and expected retail trade business remained subdued, despite a small improvement in the latter (Chart 7, panel b). By contrast, there was no strong downward correction in expected demand for contact-intensive services, which remained resilient in November and above its historical average. Similarly, the ECB’s Consumer Expectations Survey (CES) of October indicates resilient expected demand for holiday bookings. The transmission of tighter financing conditions to the real economy is likely to curb household borrowing, maintain high savings expectations and keep consumer spending growth subdued in the near term.[4] At the same time, consumer spending should benefit from improving purchasing power on the back of falling inflation and a still resilient labour market.
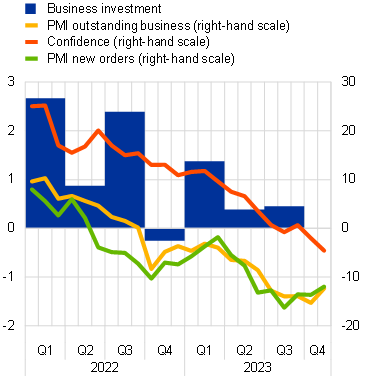
Business investment grew in the third quarter of 2023 but is expected to contract in the fourth quarter. Non-construction investment excluding Irish intangibles grew by 0.5% quarter on quarter in the third quarter of 2023, driven by rises in investment both in intangibles and in machinery and equipment (Chart 8, panel a). In the fourth quarter the continued weakness reflected in the European Commission’s confidence survey and in the PMIs for output and new orders suggests a fall in investment. Firms are also being affected by negative corporate net interest income and the support from backlogs continues to wane.[5] The Commission’s survey on limits to the production of capital goods in the fourth quarter confirmed weakening demand along with increasingly fewer impediments caused by shortages of equipment and capacity. The latter is in line with a decline in capacity utilisation in the wider economy, suggesting little need for investment to extend production capacity in the near term. Nevertheless, investment is expected to gradually recover in 2024 and beyond as demand picks up again, uncertainty recedes and as the current dampening effect of monetary policy tightening and adverse credit supply conditions fades over the medium term. In addition, the implementation of the Next Generation EU programme should crowd in private investment.
Chart 8
Real investment dynamics and survey data
a) Business investment | b) Housing investment |
|---|---|
(quarter-on-quarter percentage changes; percentage balances and diffusion indices) | (quarter-on-quarter percentage changes; percentage balances and diffusion index) |
 |  |
Sources: Eurostat, European Commission, S&P Global Market Intelligence and ECB calculations.
Notes: Lines indicate monthly developments, while bars refer to quarterly data. The PMIs are expressed in terms of the deviation from 50. In panel a), business investment is measured by non-construction investment excluding intangibles in Ireland. The lines refer to responses from the capital goods sector, with confidence taken from the European Commission survey. In panel b), the lines refer to the building construction sector. “Activity trend” refers to the trend in activity compared with the preceding three months, as measured by the European Commission survey. The latest observations are for the third quarter of 2023 for business and housing investment and November 2023 for all other items.
Housing investment fell again in the third quarter of 2023 and is likely to fall further in the near future. Housing investment decreased by 0.6% quarter on quarter in the third quarter of 2023, following a decline of 1.5% in the second quarter (Chart 8, panel b). Short-term indicators point to a further decline in the fourth quarter. In October and November the European Commission’s indicator of building construction activity in the past three months fell below its average for the third quarter, and the PMI for housing output remained well below the no-growth threshold of 50. Housing sentiment, as measured by the Commission’s quarterly survey of households’ short-term intentions to renovate, buy or build a house, has also fallen slightly in the fourth quarter of 2023. Similarly, according to the CES, households’ perceptions of housing as a good investment declined in October. The weak short-term outlook for housing investment is consistent with the generally significant downward trend in residential building permits and is caused by the considerable tightening of financial conditions which is weighing on housing demand. Household borrowing for housing loans was once again muted in October, suggesting that a recovery in housing demand is not yet in sight.
Export growth remained subdued in the third quarter of 2023, reflecting weak global demand, the lagged impact of the appreciation of the euro and high energy prices. The third quarter once again saw negative quarterly growth in export volumes as weak global trade dampened foreign demand for euro area goods. In addition, the lagged impact of the trade-weighted appreciation of the euro since late 2022 has weakened euro area competitiveness, and high energy prices further contributed to export weakness, especially in energy-intensive sectors. The contraction in imports of goods in the third quarter was consistent with the weakness in domestic demand and shrinking inventories. As a result, the contribution of net trade to GDP growth was marginally positive in the third quarter. Looking ahead, survey-based indicators point to continued near-term weakness in euro area exports as new export orders for both manufactured goods and services remain in contractionary territory.
Beyond the near term euro area activity is expected gradually to recover, supported by increases in real incomes, the waning drag from adverse financing conditions and improvements in foreign demand. Barring further shocks, GDP growth is expected to gradually strengthen as consumption is increasingly supported by receding inflationary pressures and resilient labour income growth, on the back of continued strong wage growth. Furthermore, the dampening effects of recent adverse financing conditions on investment will fade, and improvements in foreign demand should support a recovery of euro area export growth.
The December 2023 Eurosystem staff projections for the euro area foresee annual real GDP growth slowing to 0.6% in 2023, before picking up to 0.8% in 2024, before rising to 1.5% in 2025 and 2026. Compared with the September 2023 ECB staff projections, the outlook for GDP growth has been revised down slightly for 2023 and 2024, but it is unrevised for 2025.[6]
3 Prices and costs
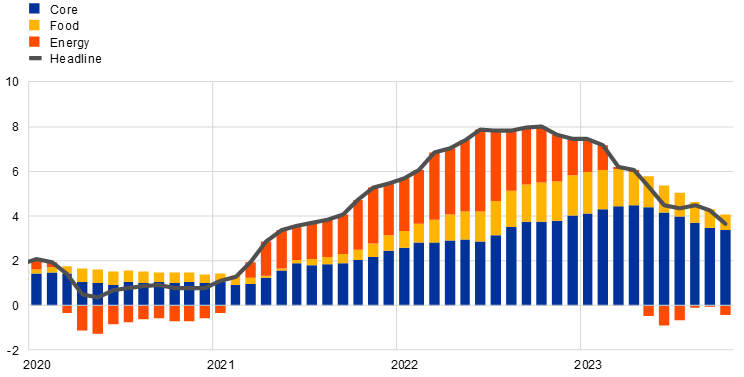
Euro area headline inflation stood at 2.4% in November 2023, down from 2.9% in October, but is likely to pick up again temporarily in the near term on account of upward base effects from energy prices. Inflation excluding energy and food dropped to 3.6% in November, and all indicators of underlying inflation continued to decline in October. However, domestic price pressures remained elevated, primarily owing to strong growth in unit labour costs. Most measures of longer-term inflation expectations stand at around 2%, with some market-based indicators of inflation compensation dropping from elevated levels, mainly on account of lower inflation risk premia. The December 2023 Eurosystem staff macroeconomic projections for the euro area foresee that headline inflation will decline gradually, averaging 2.7% in 2024, 2.1% in 2025 and 1.9% in 2026.
According to Eurostat’s flash estimate, HICP inflation fell further to 2.4% in November, down from 2.9% in October (Chart 9).[7] This decline resulted from lower inflation rates for all main subcomponents, namely energy, food, non-energy industrial goods (NEIG) and services. Energy inflation slipped further into negative territory, falling from ‑11.2% in October to ‑11.5% in November, reflecting a month-on-month decrease of 2.2%. Food inflation also continued to fall, down from 7.4% in October to 6.9% in November, but still remained high. This decrease reflected a lower annual rate of change in processed food prices. By contrast, the annual rate of change in unprocessed food prices rose, fuelled by a large month-on-month increase and an upward base effect. HICP inflation excluding energy and food (HICPX) declined further to 3.6% in November, down from 4.2% in October, owing to a decrease in both of its main components, NEIG and services. NEIG inflation fell from 3.5% in October to 2.9% in November, reflecting the continued easing of pipeline price pressures. Services inflation decreased from 4.5% in October to 4.0% in November.
Chart 9
Headline inflation and its main components
(annual percentage changes; percentage point contributions)
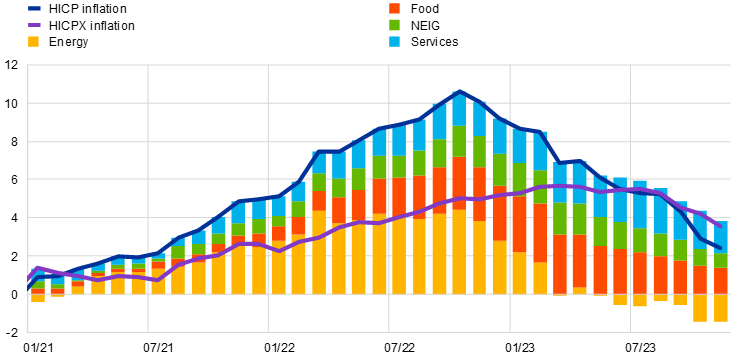
Sources: Eurostat and ECB calculations.
Note: The latest observations are for November 2023 (flash estimate).
All indicators of underlying inflation continued to decrease in October according to the latest available data, reflecting the fading effects of previous shocks to energy costs and supply chains, as well as weaker demand amid tighter monetary policy (Chart 10). Despite declines in all indicators of underlying inflation, uncertainty surrounding underlying inflation dynamics remains high. This is clear from the wide range of rates across measures of underlying inflation, ranging from 2.5% for the Persistent and Common Component of Inflation (PCCI) to 5.0% for domestic inflation. This shows that, for most measures, it takes time for the impact of past shocks to fully fade. The Supercore indicator, which comprises HICP items that are sensitive to the business cycle, declined from 5.2% in September to 4.9% in October, while the model-based PCCI measure moderated only slightly, down from 2.6% to 2.5% over the same period. The indicator for domestic inflation (excluding items with a large import content) has been the most persistently high, sitting at 5.2% in September and 5.0% in October, reflecting the importance of wage pressures. Nevertheless, this indicator has now declined for three consecutive months.
Chart 10
Indicators of underlying inflation
(annual percentage changes)
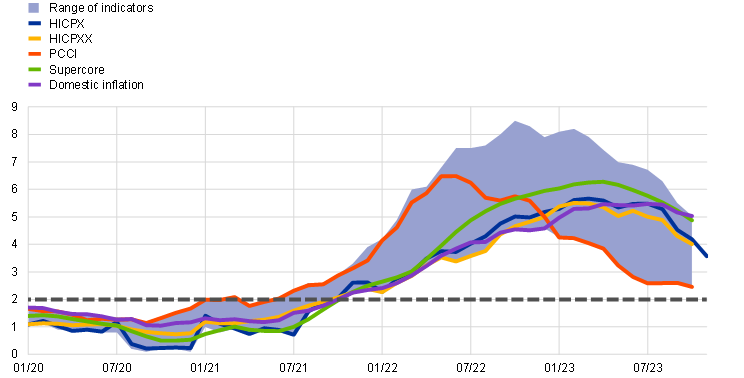
Sources: Eurostat and ECB calculations.
Notes: The range of indicators of underlying inflation includes HICP excluding energy, HICP excluding energy and unprocessed food, HICP excluding energy and food (HICPX), HICP excluding energy, food, travel-related items, clothing and footwear (HICPXX), domestic inflation, 10% and 30% trimmed means, PCCI and a weighted median. The grey dashed line represents the ECB’s inflation target of 2% over the medium term. The latest observations are for November 2023 (flash estimate) for HICPX and October 2023 for the remaining items.
Pipeline pressures continued to ease as the cumulative effects of past shocks further dissipated (Chart 11). At the early stages of the pricing chain, price pressures continued to decrease moderately in October. The growth rate in domestic producer prices for intermediate goods has been negative since May, declining further to ‑5.3% in October, down from ‑4.8% in September, while import price inflation for intermediate goods continued to fall at a fast pace, but edged up from ‑8.7% to ‑8.4% over the same period. Producer price inflation for energy, which has been negative since April, increased to ‑25.0% in October, up from ‑31.2% in September. At the later stages of the pricing chain, domestic producer price inflation for non-food consumer goods declined to 3.0% in October, down from 3.9% in September, confirming the ongoing gradual easing of accumulated pipeline pressures. The same is true for pipeline pressures in the consumer food segment, with producer price inflation for manufactured food declining further in October to 2.8%, its lowest level since April 2021. The annual growth rate of import prices for these consumer goods categories remained negative. Import price growth for non-food consumer goods declined from ‑0.6% in September to ‑1.0% in October, while for food products it did not moderate further.
Chart 11
Indicators of pipeline pressures
(annual percentage changes)

Sources: Eurostat and ECB calculations.
Note: The latest observations are for October 2023.
Domestic cost pressures, as measured by growth in the GDP deflator, decreased to 5.8% in the third quarter of 2023, down from 6.1% in the previous quarter, owing to a smaller contribution from unit profits (Chart 12). The contribution of unit profits to the GDP deflator declined to 1.4 percentage points in the third quarter of 2023, down from 2.4 percentage points in the previous quarter, suggesting that profits started to buffer the inflationary pressures of wages and labour costs. The contribution of unit labour costs rose marginally in the third quarter to 3.6 percentage points, up from 3.5 percentage points in the previous quarter. The slightly stronger annual growth in unit labour costs in the third quarter reflects a more negative growth rate for labour productivity, while wage growth as measured in compensation per employee edged downwards from 5.5% in the second quarter to 5.2% in the third quarter. Wage growth, as measured in terms of compensation per hour, was unchanged at 5.2%, suggesting that strong labour cost pressures are continuing. Underlying these dynamics, negotiated wage growth continued to strengthen in the third quarter of 2023, standing at 4.7%, up from 4.4% in the previous quarter. Moreover, information from recently concluded wage negotiations continues to signal high wage pressures going forward and does not yet show clear signals of a turning point in negotiated wage growth.
Chart 12
Breakdown of the GDP deflator
(annual percentage changes; percentage point contributions)

Sources: Eurostat and ECB calculations.
Notes: The latest observations are for the third quarter of 2023. Compensation per employee contributes positively to changes in unit labour costs and labour productivity contributes negatively.
Survey-based measures of longer-term inflation expectations remained at around 2%, while market-based measures of inflation compensation decreased. In both the ECB Survey of Professional Forecasters for the fourth quarter of 2023 and the December 2023 ECB Survey of Monetary Analysts, the median longer-term expectations stood at 2.0%. Market-based measures of inflation compensation (based on HICP excluding tobacco) have fallen markedly since the September meeting of the ECB’s Governing Council, especially for near-term maturities, as lower than anticipated inflation readings for September, October and November, along with the subdued growth outlook, prompted market participants to revise their inflation outlook downwards (Chart 13). The one-year forward inflation-linked swap rate one year ahead fell by around 50 basis points to 2.1%. At the longer end, the five‑year forward inflation-linked swap rate five years ahead dropped by around 35 basis points to 2.3%, down from the multi-year peak it reached in early August, while remaining high by historical standards. It should, however, be noted that these market‑based measures of inflation compensation are not a direct gauge of the genuine inflation expectations of market participants, as these measures include inflation risk premia, which compensate for inflation risks. Model-based estimates of genuine inflation expectations, excluding inflation risk premia, decreased moderately over the review period and indicate that market participants also expect inflation to be around 2% in the longer term. On the consumer side, the October 2023 ECB Consumer Expectations Survey reported that median expectations for headline inflation over the next year remained unchanged at 4.0%. Similarly, inflation expectations for three years ahead plateaued at 2.5%.
Chart 13
Market-based measures of inflation compensation
(percentages per annum)
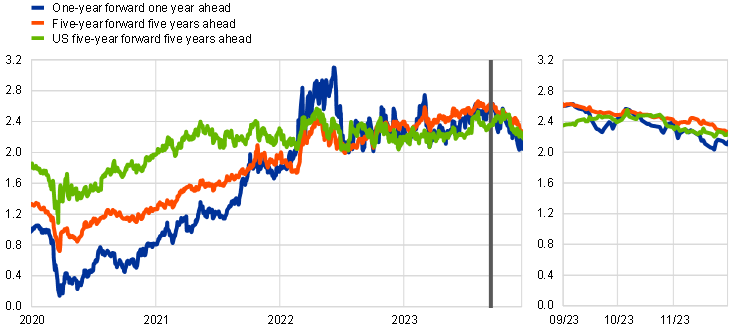
Sources: Refinitiv, Bloomberg and ECB calculations.
Notes: The chart shows forward inflation-linked swap rates over different horizons for the euro area and the five-year forward breakeven inflation rate five years ahead for the United States. The vertical grey line denotes the start of the review period on 14 September 2023. The latest observations are for 13 December 2023.
The December 2023 Eurosystem staff macroeconomic projections foresee headline inflation declining, from an average of 5.4% in 2023 to 2.7% in 2024, 2.1% in 2025 and 1.9% in 2026 (Chart 14). This disinflationary path towards the 2% target reflects the decrease in energy inflation, the impact of monetary policy tightening, the continued fading of pipeline pressures and supply bottlenecks, and the fact that longer-term inflation expectations remain anchored. Wage growth is expected to ease over the projection horizon as the upward impacts from inflation compensation gradually fade, but labour costs are still becoming the dominant driver of HICPX inflation. Profits are set to weaken over the projection horizon and provide a buffer to the pass-through of labour costs. Compared with the September 2023 projections, the projections for headline inflation have been revised downwards for both 2023 and 2024, by 0.2 and 0.5 percentage points respectively, mainly resulting from recent data outturns that were lower than expected and lower assumptions for energy commodity prices. However, projections for headline inflation for 2025 remain unrevised.
Chart 14
Euro area HICP and HICPX inflation
(annual percentage changes)

Sources: Eurostat and the December 2023 Eurosystem staff macroeconomic projections for the euro area.
Notes: The vertical line indicates the start of the projection horizon. The latest observations are for the third quarter of 2023 for the data and the fourth quarter of 2026 for the projections. The December 2023 Eurosystem staff macroeconomic projections were finalised at the end of November, and the cut-off date for the technical assumptions was 23 November 2023. Both historical and actual data for HICP and HICPX inflation are at quarterly frequency.
4 Financial market developments
During the period from 14 September to 13 December 2023 financial market developments were dominated by spillovers from substantial fluctuations in US Treasury yields and lower than anticipated inflation releases in the euro area. Euro area policy rate expectations for the next Governing Council meetings, as priced into short-term risk-free rates, remained broadly stable between the September and October meetings. This indicated that market participants expected policy rates to have peaked and to stay unchanged for some time. After the October meeting, policy rate expectations shifted markedly lower as softer than expected inflation readings gave rise to expectations that disinflation might proceed faster than previously thought. Longer-term risk-free rates initially moved higher, as increases in US rates of equivalent maturities spilled over to the euro area. Later, these moves reversed, as US rates fell back and euro area inflation readings came in below expectations. Overall, euro area nominal long-term risk-free rates are markedly lower than before the September meeting. Sovereign bond yields fell about one-for-one with risk-free rates and rather uniformly across the euro area. Prices of risky assets initially fell, weighed down by higher discount rates. However, these more than recovered as rates fell back, to stand higher overall than at the time of the September meeting. Finally, in foreign exchange markets the euro depreciated slightly in trade-weighted terms.
The overnight index swap (OIS) forward curve remained broadly unchanged between the September and October Governing Council meetings, but has since shifted markedly downwards (Chart 15). The benchmark euro short-term rate (€STR) averaged 3.9% over the review period. It closely followed the deposit facility rate, which the Governing Council raised by 25 basis points (from 3.75% to 4%) at its monetary policy meeting on 14 September 2023. Excess liquidity decreased by around €79 billion to stand at €3,584 billion. This mainly reflected repayments of the third series of targeted longer-term refinancing operations (TLTRO III) and the decline in the asset purchase programme (APP) portfolio, as the Eurosystem no longer reinvests the principal payments from maturing securities. The €STR-based OIS forward rates that span the next Governing Council meetings were largely stable between the September and October meetings. This indicated that market participants expected the hiking cycle to have peaked with the September hike and policy rates to remain at the current levels for some time. In the period after the October meeting forward rates shifted markedly downwards, as lower than expected euro area inflation numbers, combined with the subdued growth outlook, led to a reassessment of the inflation outlook. The forward curve on 13 December was pricing in the first full cut of 25 basis points in the spring of 2024, a significant likelihood of a cut as soon as the March meeting, as well as about 140 basis points of cumulative cuts in the course of 2024.
Chart 15
(percentages per annum)
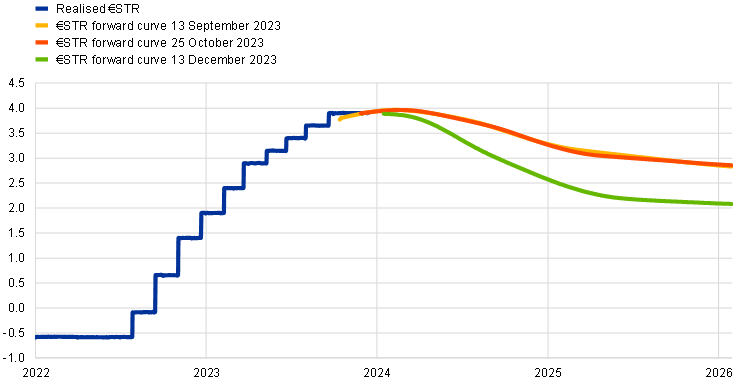
Sources: Thomson Reuters and ECB calculations.
Note: The forward curve is estimated using spot OIS (€STR) rates.
Euro area long-term risk-free rates have fluctuated noticeably, largely mirroring moves in long-term US Treasury yields, and are ultimately markedly lower than before the September meeting (Chart 16). Early in the review period, long-term risk-free rates rose substantially: the ten-year euro OIS rate stood about 30 basis points higher in mid-October than on the day before the September meeting. The main driver behind this increase appeared to be spillovers from the United States, where the rise in long-term rates was stronger than in the euro area. Subsequently, the increase in long-term euro area risk-free rates more than reversed, as US Treasury yields came off their peak, euro area inflation readings surprised on the downside, and the economic outlook deteriorated. The ten-year euro OIS rate ultimately stood about 50 basis points below its mid-September level at around 2.4%. The US ten-year Treasury yield was down by about 25 basis points, at 4.0%, after having increased by more than 70 basis points early on in the review period, while the UK equivalent fell about 45 basis points to around 3.8%.
Chart 16
Ten-year sovereign bond yields and the ten-year OIS rate based on the €STR
(percentages per annum)

Sources: Refinitiv and ECB calculations.
Notes: The vertical grey line denotes the start of the review period on 14 September 2023. The latest observations are for 13 December 2023.
Euro area sovereign bond yields decreased almost in lockstep with, and by similar magnitudes to, risk-free rates – leaving sovereign spreads little changed (Chart 17). The ten-year GDP-weighted euro area sovereign bond yield was about 40 basis points lower at around 2.8%. Over the review period there was only a slight increase in the GDP-weighted euro area average sovereign bond spread over the OIS rate based on the €STR. Sovereign bond spreads in most euro area jurisdictions evolved similarly. An exception was the Greek sovereign bond spread, which decreased by 10 basis points as the Greek sovereign credit ratings were raised to investment grade. After having risen earlier in the review period, the Italian sovereign spread subsequently reversed most of the increase as rating agencies confirmed their ratings for Italy.
Chart 17
Ten-year euro area sovereign bond spreads vis-à-vis the ten-year OIS rate based on the €STR
(percentage points)
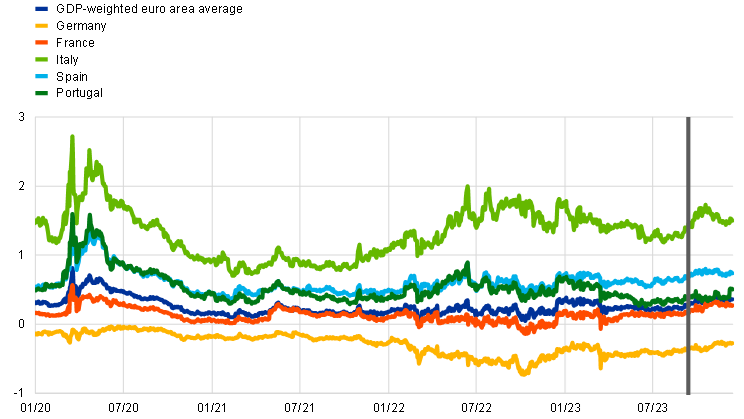
Sources: Refinitiv and ECB calculations.
Notes: The vertical grey line denotes the start of the review period on 14 September 2023. The latest observations are for 13 December 2023.
Corporate bond spreads remained broadly unchanged over the review period, amid positive risk sentiment. Spreads on high-yield corporate bonds followed the movements in long-term interest rates, increasing significantly over the first half of the review period and subsequently declining. Spreads on investment-grade corporate bonds, by contrast, fluctuated only moderately over the period. These developments are consistent with the credit risk pricing for lower-rated corporations being more sensitive to interest rate changes. Yet taking a longer perspective – namely since the start of the monetary policy normalisation in December 2021 – corporate bond spreads have increased only moderately. The resilience of the euro area corporate sector has helped to contain bond funding costs.
Euro area equity prices rose over the review period as a persistent rally in November more than made up for the losses accumulated earlier (Chart 18). Over the review period as a whole, euro area stock market indices increased by 4.3%. Since November they have made up the losses accumulated up to the end of October. Market sentiment was initially weak, as long-term rates and geopolitical uncertainty weighed on equity performance, but it later recovered as the equity risk premium decreased and interest rates fell back. The banking sector outperformed and gained 6.0%, as its stock market valuation continued to benefit from the distribution of profits to shareholders. By contrast, equity prices for non-financial corporations (NFCs) increased by only 2.6%, though displaying considerable sectoral heterogeneity. Interest rate-sensitive sectors such as technology and real estate experienced some of the largest price changes over the review period. Equity performance in the United States followed a similar trajectory, with the broad-based index increasing by 4.5% and the banking sector outperforming non-financial corporations.
Chart 18
Euro area and US equity price indices
(index: 1 January 2020 = 100)

Sources: Refinitiv and ECB calculations.
Notes: The vertical grey line denotes the start of the review period on 14 September 2023. The latest observations are for 13 December 2023.
In foreign exchange markets, the euro depreciated slightly in trade-weighted terms (Chart 19). During the review period, the nominal effective exchange rate of the euro – as measured against the currencies of 41 of the euro area’s most important trading partners – depreciated by 0.3%. The moderate depreciation of the euro masks some intra-period fluctuations reflecting changes in market participants’ expectations about policy rates – particularly in the United States. In terms of bilateral exchange rate movements against major trading partners’ currencies, the euro weakened against the Chinese renminbi (by 0.9%), the Swiss franc (by 1.4%) and against the currencies of some non-euro area EU Member States (by 6.5% against the Polish zloty and 5.6% against the Swedish krona). By contrast, the euro appreciated against the Indian rupee (by 2.3%), the Turkish lira (by 8.4%) as well as against the US dollar (by 0.5%). The latter appreciation reflected the pricing out of expectations of the Federal Reserve keeping policy rates on hold for an extended period of time. Furthermore, a lower-than-expected US CPI print in mid-November provided additional support to the euro, despite being partly offset by the subsequent euro area HICP release which also came in below expectations.
Chart 19
Changes in the exchange rate of the euro vis-à-vis selected currencies
(percentage changes)

Source: ECB.
Notes: EER-41 is the nominal effective exchange rate of the euro against the currencies of 41 of the euro area’s most important trading partners. A positive (negative) change corresponds to an appreciation (depreciation) of the euro. All changes have been calculated using the foreign exchange rates prevailing on 13 December 2023.
5 Financing conditions and credit developments
The transmission of the ECB’s monetary policy tightening to broader financing conditions has remained strong. In October 2023 bank funding costs and bank lending rates increased further, reaching their highest levels in almost 15 years for both firms and households. In the same month, the overall cost of financing for non-financial corporations (NFCs) also edged up higher. Over the period from 14 September to 13 December 2023, the cost to NFCs of both market-based debt and equity financing declined significantly. The latest Survey on the Access to Finance of Enterprises, covering the period from April to September 2023, indicates a broad-based tightening of financing conditions for firms. The weakness in bank lending to firms and households continued in October, reflecting higher lending rates, lower loan demand and tighter credit standards. Money growth continued to contract, with annual rates close to historical lows, owing to high opportunity costs, subdued credit growth and the reduction in the Eurosystem balance sheet.
Euro area bank funding costs continued to rise in October 2023, driven by further increases in deposit rates. The composite cost of debt financing for euro area banks rose in October, reaching its highest level in more than ten years and showing greater cross-country heterogeneity (Chart 20, panel a). While bank bond yields started to decrease in November, mirroring developments in the yield curve (Chart 20, panel b), deposit rates continued to rise steadily, with some variation across instruments and sectors. The large and widening spread between time and overnight deposit rates led depositors to shift large volumes of their overnight holdings to time deposits and other instruments with higher remuneration. The rates offered to firms for holding time deposits were close to the ECB’s deposit facility rate and remained above those for households. In addition, the pass-through of policy rates to deposit rates has continued to vary significantly across banks, mainly reflecting differences arising from competition, the duration of banks’ assets and liabilities, and regulatory arrangements.
The ongoing phasing-out of targeted longer-term refinancing operations (TLTROs) has contributed to a reduction in excess liquidity in an environment of still ample system-wide liquidity. Following the settlement on 20 December 2023, the overall outstanding amount of funds under the third series of TLTROs (TLTRO III) has been reduced by €1.721 trillion, down to €392 billion. This figure is 81% below the amount outstanding before the October 2022 recalibration of the TLTRO III remuneration (€2.113 trillion).[8] To make up for the lower liquidity provided by the ECB, banks have increased their issuance of debt securities and money market instruments, and competed more actively with each other for deposits by increasing the remuneration on these instruments. Savers have moved deposits from banks offering less attractive remuneration to those that have raised their deposit rates at a faster pace. Issuance of bank bonds, which are more expensive for banks than deposits, has increased in volume since September 2022, amid the winding-down of TLTROs and the decline in overnight deposits.
Chart 20
Composite bank funding costs in selected euro area countries
(annual percentages)
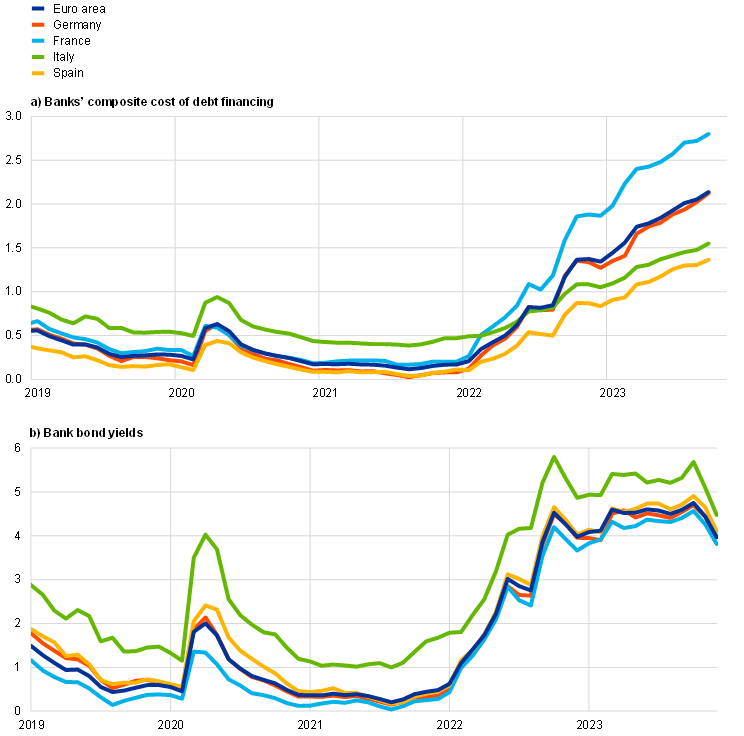
Sources: ECB, S&P Dow Jones Indices LLC and/or its affiliates, and ECB calculations.
Notes: Composite bank funding costs are a weighted average of the composite cost of deposits and unsecured market-based debt financing. The composite cost of deposits is calculated as an average of new business rates on overnight deposits, deposits with an agreed maturity and deposits redeemable at notice, weighted by their respective outstanding amounts. Bank bond yields are monthly averages for senior-tranche bonds. The latest observations are for October 2023 for banks’ composite cost of debt financing and 13 December 2023 for bank bond yields.
Bank balance sheets have been robust overall, despite a weak economic environment. In the first half of 2023 banks continued to increase their capitalisation and maintained capital ratios well above the Common Equity Tier 1 (CET1) requirements. A well-capitalised banking system is key to ensuring the sustainable provision of credit to the real economy under adequate conditions. Despite rising bank funding costs, lower lending volumes and worsening asset quality, bank profitability benefited from higher net interest rate margins, amid considerable cross-country heterogeneity. The increase in net interest income was particularly evident for banks in countries where variable-rate lending predominates and where the increase in bank funding costs has been smaller. Bank non-performing loans remained at low levels in the second quarter of 2023, but default rates on both corporate and retail exposures have already started to rise, pointing to further increases in non-performing loans. Banks may face the risk of higher provisioning costs if risks to the non-financial sectors materialise as a result of weaker than anticipated economic conditions.
In October 2023 lending rates for firms and households increased further, reflecting higher ECB policy rates and tighter credit standards. Between early July 2022 and September 2023, the ECB’s policy rates rose substantially and rapidly, by a total of 450 basis points. This has led to a sharp increase in lending rates for both firms and households across euro area countries (Chart 21). Bank rates on new loans to NFCs and households have reached their highest level in almost 15 years, amid decreasing loan origination and tightening credit standards. Since May 2022, i.e. before the ECB signalled the first rate hike in the current tightening cycle, lending rates for firms and for households for house purchase have risen by around 350 basis points and 210 basis points respectively. In October 2023 lending rates for firms rose to 5.27%, compared with 5.09% in September. This increase was widespread across interest rate fixation periods and was the largest for fixation periods of between one and five years. Bank rates on new loans to households for consumption were broadly unchanged, standing at 7.90% in October. Lending rates on new loans in the category “other lending to households”, which includes sole proprietors, increased to 5.55% in October, up from 5.38% in September. Lending rates on new loans to households for house purchase rose only slightly, standing at 3.91% in October, compared with 3.89% in September. This slower rate of increase reflects the advanced stage of the tightening cycle and increasing volumes of renegotiated loans that have pushed down rates on new loans in some euro area countries.[9] It was also stronger for flexible-rate mortgages than for fixed-rate contracts, amid cross-country heterogeneity. The results of the ECB’s Consumer Expectations Survey for October 2023 suggest that consumers expect mortgage rates to stabilise somewhat above the current levels over the next 12 months. A large net percentage of survey respondents perceived credit standards to be tight and expected housing loans to become harder to obtain over that same period. The cross-country dispersion of lending rates remained at a low level for both firms and households (Chart 21, panels a and b).
Chart 21
Composite bank lending rates for NFCs and households in selected countries
(annual percentages; standard deviation)

Source: ECB.
Notes: Composite bank lending rates for non-financial corporations (NFCs) are calculated by aggregating short and long-term rates using a 24-month moving average of new business volumes. The cross-country standard deviation is calculated using a fixed sample of 12 euro area countries. The latest observations are for October 2023.
From 14 September to 13 December 2023 the cost to NFCs of both market-based debt and equity financing declined significantly. In October the overall cost of financing for NFCs – i.e. the composite cost of bank borrowing, market-based debt and equity – hit a multi-year high, reaching levels last seen in the second half of 2010, having risen by 11 basis points on the previous month to stand at 6.54% (Chart 22).[10] This increase was due mainly to a rise in the cost of long and short-term borrowing from banks. However, over the review period as a whole – 14 September to 13 December 2023 – the cost of both equity and market-based debt declined. The decline in the cost of equity was driven by the decrease in both the equity risk premium and the long-term risk-free rate (approximated by the ten-year overnight index swap rate). The fall in the cost of market-based debt was almost identical to the drop in the risk-free rate given that spreads on bonds issued by non-financial firms remained virtually unchanged (see Section 4).
Chart 22
Nominal cost of external financing for euro area NFCs, broken down by component
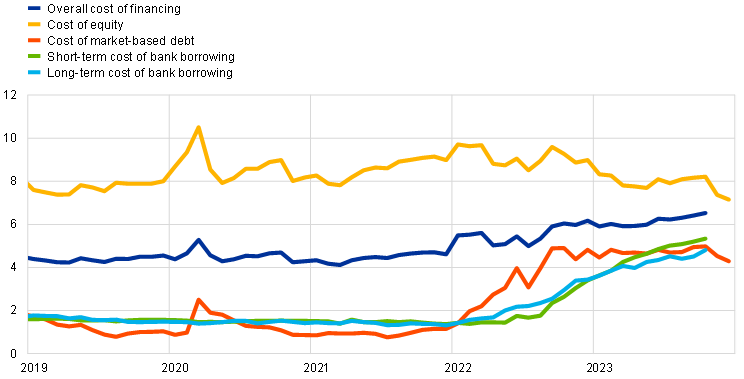
Sources: ECB and ECB estimates, Eurostat, Dealogic, Merrill Lynch, Bloomberg and Thomson Reuters.
Notes: The overall cost of financing for non-financial corporations (NFCs) is based on monthly data and is calculated as a weighted average of the cost of borrowing from banks (monthly average data), market-based debt and equity (end-of-month data), based on their respective outstanding amounts. The latest observations are for 13 December 2023 for the cost of market-based debt and the cost of equity (daily data), and October 2023 for the overall cost of financing and the cost of borrowing from banks (monthly data).
Firms continued to report a widespread increase in bank interest rates and other costs of bank financing over the period from April to September 2023 in the Survey on the Access to Finance of Enterprises. A net 86% of firms reported higher bank interest rates in the most recent survey round, compared with 87% in the previous round (Chart 23). At the same time, a historically high net 58% (up from 53%) of firms reported an increase in other costs of financing (i.e. charges, fees and commissions). A rise in bank interest rates was reported more broadly by large firms, whereas an increase in other costs of bank loans was signalled more often by small and medium-sized enterprises (SMEs). In net terms, firms also reported stricter collateral requirements. Despite tighter financing conditions, few firms reported obstacles to obtaining a bank loan.
Chart 23
Changes in the terms and conditions of bank financing for euro area firms
(net percentages of respondents)

Source: ECB Survey on the Access to Finance of Enterprises.
Notes: SMEs stands for small and medium-sized enterprises. The figures are based on firms that had applied for bank loans (including subsidised bank loans), credit lines, or bank or credit card overdrafts. Net percentages are the difference between the percentage of firms reporting an increase for a given factor and the percentage reporting a decrease. The figures refer to rounds 22-29 of the survey (October 2019-March 2020 to April 2023-September 2023).
Firms also reported a further moderate widening in their financing gap and expected the availability of most sources of external financing to deteriorate in the future. In the euro area, the external financing gap – the difference between the change in needs for, and change in availability of, external financing across all financial instruments – was reported to be 8% (up from 6% in the previous survey round). More large firms than SMEs reported an increase in the financing gap, driven by higher financing needs across most instruments. Looking ahead, firms are slightly more pessimistic about the availability of external financing over the next six months. Reflecting the ongoing tightening of bank lending conditions, a net 18% of firms expect a further deterioration in access to bank loans over the next six months, while the corresponding figures for credit lines and debt securities are 15% and 17% respectively. More SMEs than large firms expect a deterioration in access to both bank loans and credit lines. By contrast, the share of firms expecting the availability of debt securities to deteriorate was greater for large firms than for SMEs.
Annual growth in loans to NFCs turned negative in October 2023. This growth rate fell to ‑0.3% in October, down from 0.2% in September (Chart 24, panel a), amid considerable heterogeneity across countries and maturities. The slowdown reflected the sharp decline in loan demand, which was due in part to higher borrowing rates and associated spending plan cuts, and in loan supply, as suggested by the further tightening of credit standards in the third quarter of 2023. The short-term dynamics remained subdued, as implied by the monthly flows, which were negative, on average, over the three months to October. The annual growth rate of loans to households fell to 0.6% in October, down from 0.8% in September (Chart 24, panel b), amid negative housing market prospects, a further tightening of credit standards and higher lending rates. The decline was driven mainly by housing loans and loans to sole proprietors (i.e. unincorporated small businesses), while consumer loans remained more resilient, despite tightening credit standards and falling consumer confidence. The short-term dynamics show virtually no new net lending over the past three months.
Chart 24
MFI loans in selected euro area countries
(annual percentage changes; standard deviation)

Source: ECB.
Notes: Loans from monetary financial institutions (MFIs) are adjusted for loan sales and securitisation; in the case of non-financial corporations (NFCs), loans are also adjusted for notional cash pooling. The cross-country standard deviation is calculated using a fixed sample of 12 euro area countries. The latest observations are for October 2023.
Growth in net external financing of euro area firms was weak in the third quarter of 2023 and in October, reflecting low levels of debt financing. The annual growth rate of net external financing declined from 0.5% in June 2023 to ‑0.7% in October (Chart 25). Unlike previous episodes of weak loan dynamics, corporate bond issuance did not make up for the decline in bank loans. The issuance of listed shares was muted overall, with firms also engaging in share buybacks to boost shareholder returns.
Chart 25
Net external financing flows for euro area NFCs
(monthly flows; EUR billions)
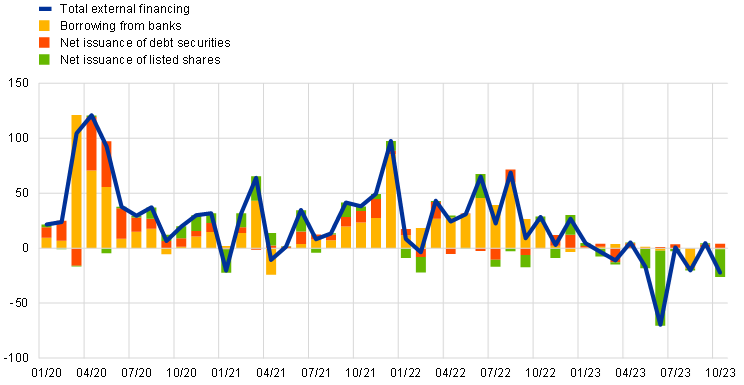
Sources: ECB, Eurostat, Dealogic and ECB calculations.
Notes: Net external financing is the sum of borrowing from banks (MFI loans), net issuance of debt securities and net issuance of listed shares. MFI loans are adjusted for loan sales, securitisation and cash-pooling activities. The latest observations are for October 2023.
The reallocation of overnight deposits to time deposits intensified in October. The annual growth rate of overnight deposits continued its double-digit decline in October, down to ‑11.5% from ‑11.4% in September (Chart 26). The rise in interest rates has translated into a large and widening spread between time and overnight deposits given that interest rates on overnight deposits have adjusted to policy rate changes more slowly than those on time deposits, in line with previous tightening cycles. This has pushed up the opportunity cost of holding liquid assets and is driving the ongoing fund reallocation from overnight to time deposits. For households, October saw the largest monthly shift from overnight to time deposits since the start of the tightening cycle. Firms switched between these two instruments at a more rapid pace, as was the case in the first half of 2023.
Chart 26
M3, M1 and overnight deposits
(annual growth rate, adjusted for seasonal and calendar effects)
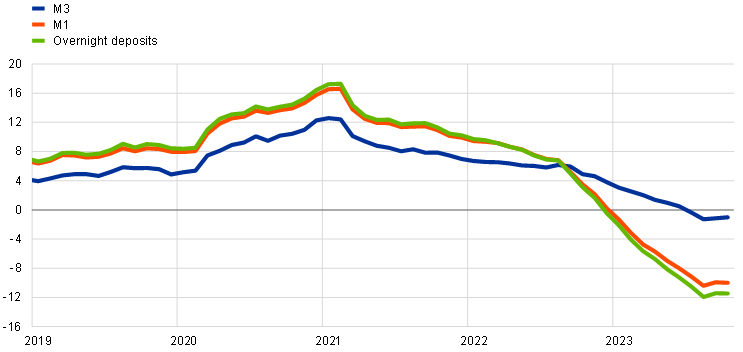
Source: ECB.
Note: The latest observations are for October 2023.
In October 2023 money growth continued to contract – with annual rates close to recent historical lows – driven by high opportunity costs, subdued credit growth and the reduction in the Eurosystem balance sheet. Annual broad money (M3) growth in the euro area stood at ‑1.0% in October, up from ‑1.2% in September (Chart 26). Annual narrow money (M1) growth declined at double-digit rates, with overall contractionary monetary dynamics being reinforced by portfolio shifts. In October it stood at ‑10.0%, down slightly from ‑9.9% in September. As in previous months, the Eurosystem’s balance sheet reduction and bank bond acquisitions by money holders continued to have a contractionary effect on monetary dynamics. In addition, repayments of TLTRO funds and the higher opportunity cost for depositors of holding liquid assets are leading banks to issue bonds with longer maturities not included in M3. At the same time, monetary dynamics have been increasingly underpinned by purchases of government bonds by banks and foreign investors, thereby bringing new money into the system, and a growing current account surplus leading to higher monetary inflows from the rest of the world.
6 Fiscal developments
According to the December 2023 Eurosystem staff macroeconomic projections, the euro area general government budget balance is estimated to have improved moderately in 2023 and is expected to also improve moderately in 2024. This would be followed by only marginal further improvements in 2025 and 2026. Broadly reflecting these developments, the euro area fiscal stance is likely to have tightened moderately in 2023 and is expected to tighten more significantly in 2024. Over the subsequent two years, only very minor further tightening is expected. The ratio of euro area debt to GDP is projected to decline only marginally over the projection horizon, from an estimated 89% in 2023 to around 88% in 2026, representing a slowing down of the decline observed since the highs of the pandemic. As the energy crisis fades, governments should continue to roll back the related support measures. This is essential to avoid driving up medium-term inflationary pressures, which would otherwise call for even tighter monetary policy. Fiscal policies should be designed to make the euro area economy more productive and gradually bring down high public debt. It is important that Member States swiftly agree on the reform of the EU’s economic governance framework.
According to the December 2023 Eurosystem staff macroeconomic projections, the euro area general government budget balance will improve slowly over the whole projection horizon.[11] According to the projections, the euro area budget deficit is estimated to have declined to 3.1% of GDP in 2023 and will continue declining to 2.8% of GDP in 2024, 2.7% in 2025 and 2.6% in 2026 (Chart 27). This path is expected to be driven primarily by smaller negative cyclically adjusted primary balances, while the cyclical component is expected to be fairly stable over the projection horizon. Interest payments are projected to increase slightly over the projection horizon, but the increase will be moderate compared to that in market interest rates as the pass-through will be gradual owing to long sovereign debt residual maturities, for which the euro area average is currently just below 8 years (up from 6.5 years in 2015). The fall in the cyclically adjusted primary deficit, which is concentrated in 2023 and 2024, is largely driven by the scaling back of government fiscal support measures as the energy shock and high inflation fade. It is now estimated that, at the euro area level, these measures amounted to 1.3% of GDP in 2023, will decline significantly to 0.4% of GDP in 2024 and will decline further to around 0.1% of GDP in 2025 and 2026. This improvement in the cyclically adjusted primary balance is also affected by the recent decision of the German Federal Constitutional Court regarding the use of emergency credits and the impact on the “debt brake”. However, uncertainty remains regarding this impact given that the German federal budget for 2024 has not yet been finalised.
Chart 27
Budget balance and its components
(percentages of GDP)
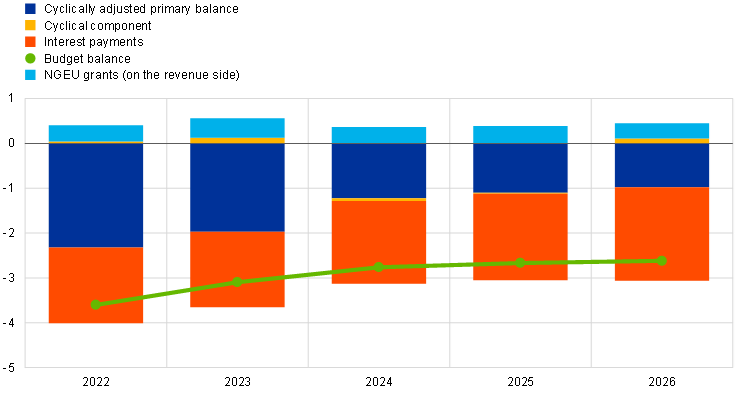
Sources: ECB calculations and Eurosystem staff macroeconomic projections for the euro area, December 2023.
Notes: The cyclically adjusted primary balance is adjusted for Next Generation EU (NGEU) grants on the revenue side. The data refer to the aggregate general government sector of all 20 euro area countries (including Croatia).
Compared with the September 2023 ECB staff macroeconomic projections, the budget balance is up marginally by 0.1 percentage point in 2023, unchanged in 2024 and up moderately by 0.3 percentage points in 2025. These revisions can be traced back to an upward revision of the cyclical component over the whole projection horizon (by 0.4 percentage points per annum), which in 2023 and 2024 is almost fully offset by a more adverse cyclically adjusted primary balance. In 2025, however, the upward revision of the cyclical component is offset only to a smaller degree. The contribution from interest expenditures remains unchanged over the projection horizon.
The euro area fiscal stance is projected to tighten moderately over the forecast horizon, most notably in 2024.[12] The annual change in the cyclically adjusted primary balance, adjusted for grants extended to countries under the NGEU programme, points to a significant tightening of fiscal policies in the euro area in 2023 and 2024 taken together as a large share of the energy and inflation support measures introduced in 2022 are phased out. Nonetheless, taking into account past measures, including measures in response to the outbreak of the pandemic in 2020 and, more recently, measures in response to the energy and inflation shock, the level of fiscal support in the euro area is expected to remain largely accommodative over the whole projection horizon. The minor expected tightening of the fiscal stance in 2025 and 2026 does little to change this overall assessment.
The ratio of euro area government debt to GDP is projected to remain above its pre-pandemic level and to decline only slowly from an estimated 88.7% in 2023 to 88.1% in 2026. The debt ratio increased by approximately 13 percentage points to around 97% in 2020 but has gradually fallen since and is expected to continue to fall over the projection horizon, albeit at a significantly slower pace. The projected decline is based on narrowing but still negative differentials between interest rates and nominal GDP growth, which are partly offset by the continuing primary deficits and by expected positive deficit-debt adjustments in the second half of the projection horizon (Chart 28).
Chart 28
Drivers of change in euro area government debt
(percentages of GDP, unless otherwise indicated)
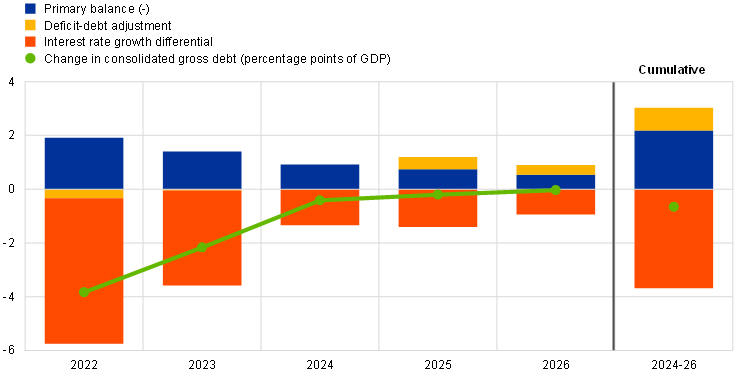
Sources: ECB calculations and Eurosystem staff macroeconomic projections for the euro area, December 2023.
Note: The data refer to the aggregate general government sector of all 20 euro area countries (including Croatia).
As the energy shock fades, governments should continue to roll back the related support measures. This is essential to avoid driving up medium-term inflationary pressures, which would otherwise call for even tighter monetary policy. In its statement of 7 December, the Eurogroup called on those Member States that still have significant measures in place to phase them out as soon as possible in 2024 and to use the related savings for deficit reduction. The Eurogroup considered that, while policies should remain agile in view of the prevailing uncertainty, an overall restrictive fiscal stance for the euro area in 2024 was appropriate to enhance public finance sustainability and avoid fuelling inflationary pressures. Beyond this, it will be important that fiscal policies are designed to make the euro area economy more productive and gradually bring down high public debt. This can best be achieved within a robust EU framework for economic and fiscal policy coordination and surveillance. In its opinion of 5 July 2023 on a proposal for economic governance reform in the Union, the ECB urged EU legislators to come to an agreement on the reform of the economic governance framework as soon as possible, and at the latest by the end of 2023.[13]
Boxes
1 US Treasury market conditions and global market reactions to US monetary policy
The market for US Treasury securities is the largest and most liquid market for government securities in the world. With over USD 25 trillion of outstanding securities, this market is used to finance the US Government and plays a central role in the implementation of the monetary policy of the US Federal Reserve System. US Treasury securities also act as a key benchmark for both US domestic private sector financing and international markets. As such, changes in liquidity conditions in this market can have noticeable consequences for global financial markets.
More2 Geopolitical risk and oil prices
The relation between geopolitical developments and oil prices is not clear-cut. Historically, there is no clear relationship between oil prices and geopolitical events, such as emerging tensions between countries or terrorist attacks. For example, immediately after the 9/11 attacks, Brent prices increased by 5% (about five times the average daily change in the Brent price between 2000 and 2023). However, within 14 days the price dropped by around 25% on the back of concerns about weakening oil demand. When Russia invaded Ukraine in February 2022, Brent prices increased by almost 30% within the first two weeks following the invasion. However, prices then decreased again, returning to their pre-invasion levels after around eight weeks. More recently, Brent prices increased by about 4% after the terrorist attacks in Israel on 7 October 2023 before subsequently stabilising.[14] Taking a more comprehensive perspective, Chart A plots the global geopolitical risk (GPR) index of Caldara and Iacoviello (2022) against the log of the Brent crude oil price.[15] The index is constructed by applying text analysis methods to newspaper articles and tracking the news coverage of events related to geopolitical tensions globally.[16] Large spikes in the index, which capture major geopolitical events, are not systematically associated with higher or more volatile oil prices. On the contrary, after many events, oil prices remain weak for several months.
More3 Potential output in times of temporary supply shocks
According to the estimates of major international institutions, the euro area output gap has remained negative or very close to zero in recent years, despite the rise in euro area core inflation.[17] Motivated by policy considerations related to fiscal, financial and external sustainability, the potential output estimates produced by international institutions such as the International Monetary Fund (IMF), the Organisation for Economic Co-operation and Development (OECD) and the European Commission are computed under the assumption that potential output mostly only fluctuates in response to medium-run – i.e. either permanent or highly persistent – structural shocks.[18] This approach was maintained during the pandemic and the associated supply shock, which many assumed would be transitory given the reversal of containment measures and the supporting role of macroeconomic policies.[19]
More4 Monetary policy and the recent slowdown in manufacturing and services
Economic activity in the euro area has slowed down in both manufacturing and services.[20] Since the end of 2021, economic activity, measured in terms of real gross value added, has grown at a significantly faster pace in the market services sector – i.e. services excluding public administration, education, health and social services – than in the manufacturing sector (Chart A). This has reflected, on the one hand, relatively buoyant demand for contact-intensive services, supported by the reopening of the economy following the pandemic, and, on the other hand, weak demand for goods, global supply bottlenecks and, later, the tightening of financing conditions induced by the monetary policy response to the rapid and strong increase in inflation.[21] However, services activity, which typically follows manufacturing in the business cycle, has also weakened recently.[22] This box looks at the leading properties of manufacturing activity in the euro area for market services, focusing on the role of monetary policy.
More5 A primer on measuring household income
In the light of recent survey results, this box reviews the latest developments in household disposable income, focusing on some conceptual and measurement issues. Evidence from the ECB’s Consumer Expectations Survey (CES) at the end of September 2023 shows that about 21% of households in the euro area reported an increase in their income above or equal to inflation in the past 12 months, while 54% of respondents reported an increase below inflation and 25% reported a decrease in their income (Chart A, panel a). This relatively negative assessment of recent real income dynamics was shared quite evenly along the income distribution.[23] Moreover, this assessment is in line with the European Commission’s survey results which indicate that consumers’ perceptions of their financial situation over the last 12 months have recently been significantly below their long-term average, especially since the surge in inflation following the outbreak of the war in Ukraine (Chart A, panel b). However, it contrasts with the positive momentum in household disposable income as measured in the national accounts, which increased by an average of 8.6%, year on year, in the first half of 2023 (Chart B), corresponding to an increase in real disposable income of 1.1% in the same period.[24] This divergence between survey results and national accounts data calls for a detailed look at recent trends in household disposable income and their implications for the outlook for private consumption.
More6 Liquidity conditions and monetary policy operations from 2 August to 31 October 2023
This box describes liquidity conditions and the Eurosystem’s monetary policy operations during the fifth and sixth reserve maintenance periods of 2023. Together, these two maintenance periods ran from 2 August to 31 October 2023 (the “review period”).
More7 Net interest income of households and firms[25]
This box focuses on developments in the net interest income of households and firms amid rising interest rates. After a decade of low interest rates the ECB started a series of policy rate hikes in July 2022. Changes in policy rates affect the interest rates received on interest-bearing assets, such as bank deposits, and those paid on interest-bearing liabilities, such as loans and bonds. These, in turn, affect the interest income received and paid by households and firms, as does the size, remaining maturity and time to repricing of their interest-bearing assets and liabilities. Net interest income, i.e. interest received minus interest paid, captures a direct channel through which ECB policy rate changes are transmitted to savers and borrowers via the interest rates for the assets and liabilities they hold.[26] This is in addition to the incentives provided by the interest rates offered on new loans and savings instruments, as well as other transmission channels affecting households and firms that are beyond the scope of this box.[27]
More8 Monetary dynamics during the tightening cycle
The policy rate hiking cycle that started in mid-2022 has led banks to increase the deposit rates they offer. So far, the ECB has raised its three key interest rates by 450 basis points over the tightening cycle. Compared with the levels seen at the end of May 2022, shortly before the intention to hike interest rates was announced at the June press conference, interest rates on newly agreed time deposits have risen by 372 basis points and those on overnight deposits by 50 basis points.
MoreArticle
1 Central bank money settlement of wholesale transactions in the face of technological innovation
Through its TARGET Services, the Eurosystem facilitates the settlement of wholesale financial transactions in central bank money, the safest and most liquid settlement asset. The possibility to settle such transactions in central bank money (that is, in the form of reserves held by financial institutions at the central bank) helps to reduce risks to the financial system and to support financial stability and trust in the currency. The provision of settlement infrastructures is part of how the Eurosystem carries out its basic task of promoting the smooth operation of payment systems.[28]
MoreStatistics
https://www.ecb.europa.eu/pub/pdf/ecbu/ecb.eb_annex202308~cbdc29975a.en.pdf© European Central Bank, 2024
Postal address 60640 Frankfurt am Main, Germany
Telephone +49 69 1344 0
Website www.ecb.europa.eu
All rights reserved. Reproduction for educational and non-commercial purposes is permitted provided that the source is acknowledged.
For specific terminology please refer to the ECB glossary (available in English only).
The cut-off date for the statistics included in this issue was 13 December 2023.
PDF ISSN 2363-3417, QB-BP-23-0012-EN-N
HTML ISSN 2363-3417, QB-BP-23-0012-EN-Q
The cut-off date for data included in this issue of the Economic Bulletin was 13 December 2023.
Given the focus of this section on developments in the global environment, all references to world and/or global aggregate economic indicators exclude the euro area.
See also the box entitled “Monetary policy and the recent slowdown in manufacturing and services” in this issue of the Economic Bulletin.
The subdued outlook for private consumption may also reflect consumers’ pessimistic assessment of recent developments in real income. See the box entitled “A primer on measuring household income” in this issue of the Economic Bulletin.
See the box entitled “Net interest income of households and firms” in this issue of the Economic Bulletin.
See “Eurosystem staff macroeconomic projections for the euro area, December 2023”.
The cut-off date for data included in this issue of the Economic Bulletin was 13 December 2023. Eurostat’s final release on 19 December 2023 confirmed euro area HICP inflation at 2.4% in November.
See “ECB recalibrates targeted lending operations to help restore price stability over the medium term”, press release, ECB, 27 October 2022.
The purpose of loan negotiations is to make it easier for the borrower to keep up with future payments and to ensure that the lender will eventually be paid back.
Owing to lags in the data available on the cost of borrowing from banks, data on the overall cost of financing for NFCs are only available up to October 2023.
See “Eurosystem staff macroeconomic projections for the euro area, December 2023”, published on the ECB’s website on 14 December 2023.
The fiscal stance reflects the direction and size of the stimulus from fiscal policies to the economy beyond the automatic reaction of public finances to the business cycle. It is measured here as the change in the cyclically adjusted primary balance ratio net of government support to the financial sector. Given that the higher budget revenues related to NGEU grants from the EU budget do not have a contractionary impact on demand, in this context the cyclically adjusted primary balance is adjusted to exclude those revenues. For more details on the euro area fiscal stance, see the article entitled “The euro area fiscal stance”, Economic Bulletin, Issue 4, ECB, 2016.
On 21 December 2023, and thus after the December Governing Council meeting covered by this issue of the Economic Bulletin, the European Council reached agreement on a reform of the EU’s economic governance which opens the way for a trialogue between the Commission, the Council and the European Parliament.
After one month, the Brent price stood below the level observed on the day before the attacks, at USD 79 per barrel.
Caldara, D. and Iacoviello, M., “Measuring Geopolitical Risk”, American Economic Review, American Economic Association, Vol. 112, No 4, 2022, pp. 1194-1225.
The index is based on ten newspapers (Chicago Tribune, The Daily Telegraph, Financial Times, The Globe and Mail, The Guardian, Los Angeles Times, The New York Times, USA Today, The Wall Street Journal and The Washington Post) and is constructed by counting the number of articles related to adverse geopolitical events in each newspaper for each month (as a share of the total number of news articles). It is separately constructed for the global economy and 44 countries.
See “Autumn 2023 Economic Forecast: A modest recovery ahead after a challenging year”, European Commission, Brussels, November 2023, “World Economic Outlook: Navigating Global Divergences”, IMF, Washington D.C., October 2023, and “Economic Outlook: Restoring growth”, OECD, Paris, November 2023.
See Chalaux, T. and Guillemette, Y., “The OECD Potential Output Estimation Methodology”, Economics Department Working Papers, No 1563, OECD, Paris, 2019, Havik, K. et al., “The Production Function Methodology for Calculating Potential Growth Rates and Output Gaps”, Economic Papers, 535, European Commission, Brussels, November 2014, and De Resende, C., “IEO Evaluation Report”, IMF Forecasts, Independent Evaluation Office of the International Monetary Fund, Washington D.C., April 2014, Chapter 5.
For more details, see the article entitled “The impact of COVID-19 on potential output in the euro area”, Economic Bulletin, Issue 7, ECB, Frankfurt am Main, 2020.
The measure for manufacturing activity refers to the euro area aggregate excluding Ireland, on account of the considerable volatility in Irish intellectual property products. See the box entitled “Intangible assets of multinational enterprises in Ireland and their impact on euro area GDP”, Economic Bulletin, Issue 3, ECB, 2023.
See the box entitled “What role do reopening effects play across countries and sectors?”, Economic Bulletin, Issue 6, ECB, 2023; the box entitled “The impact of higher energy prices on services and goods consumption in the euro area”, Economic Bulletin, Issue 8, ECB, 2022; as well as the article entitled “The role of supply and demand in the post-pandemic recovery in the euro area”, Economic Bulletin, Issue 4, ECB, 2023.
For a survey-based analysis, see the box entitled “The drivers of recent developments in business activity expectations across sectors”, Economic Bulletin, Issue 7, ECB, 2023.
While the percentage of low-income households reporting a decline in their income is higher than for households in other income brackets, the percentage of respondents reporting an increase in their real income is relatively low and stable across the income distribution.
Specifically, disposable income of households is measured in official statistics in the so-called sector accounts, which contain detailed national accounts data broken down by institutional sector, including households and non-profit institutions serving households, general government, and financial and non-financial corporations. In this box, the term “national accounts” is used when referring to official data on disposable income.
This text has been updated on 30 January 2024 by deleting text associated with household net interest income developments in Spain. The previous version contained an error in Chart C for households in Spain, which led to an overstatement of developments in Spain.
The focus of this box is on net interest income before the allocation of financial intermediation services indirectly measured (FISIM), as this more accurately reflects the effective interest rates encountered for loans and deposits. This is unlike the measurement of net interest income in the national accounts, which is recorded after FISIM allocation, meaning interest paid and interest received are computed as if deposits and loans are paid based on a reference rate, or the interbank refinancing rate. FISIM is used in the national accounts to compute the value of intermediation services provided by financial institutions that do not have explicit service charges. For more information, see Chapter 14 of Regulation (EU) No. 549/2013 of the European Parliament and of the Council of 21 May 2013 on the European system of national and regional accounts in the European Union (OJ L 174, 26.6.2013, p. 1), and “Household Income”, Economic Outlook, INSEE, 15 December 2022.
For more information on this topic, see the box entitled “Low interest rates and households’ net interest income”, Economic Bulletin, Issue 4, ECB, 2016. For a description of the main monetary policy transmission channels, see Lane, P. R., “The banking channel of monetary policy tightening in the euro area”, remarks at the Panel Discussion on Banking Solvency and Monetary Policy, NBER Summer Institute 2023 Macro, Money and Financial Frictions Workshop, 12 July 2023.
Article 127 of the Treaty on the Functioning of the European Union (OJ C 326, 26.10.2012, p. 47).