
Economic, financial and monetary developments
Overview
Inflation continues to decline but is still expected to remain too high for too long. The Governing Council is determined to ensure that inflation returns to its 2% medium-term target in a timely manner. In order to reinforce progress towards its target, the Governing Council decided at its meeting on 14 September 2023 to raise the three key ECB interest rates by 25 basis points.
The rate increase reflects the Governing Council’s assessment of the inflation outlook in light of the incoming economic and financial data, the dynamics of underlying inflation, and the strength of monetary policy transmission. The September 2023 ECB staff macroeconomic projections for the euro area see average inflation at 5.6% in 2023, 3.2% in 2024 and 2.1% in 2025. This is an upward revision for 2023 and 2024 and a downward revision for 2025. The upward revision for 2023 and 2024 mainly reflects a higher path for energy prices. Underlying price pressures remain high, even though most indicators have started to ease. ECB staff have slightly revised down the projected path for inflation excluding energy and food, to an average of 5.1% in 2023, 2.9% in 2024 and 2.2% in 2025. The Governing Council’s past interest rate increases continue to be transmitted forcefully. Financing conditions have tightened further and are increasingly dampening demand, which is an important factor in bringing inflation back to target. With the increasing impact of this tightening on domestic demand and the weakening international trade environment, ECB staff have lowered their economic growth projections significantly. They now expect the euro area economy to expand by 0.7% in 2023, 1.0% in 2024 and 1.5% in 2025.
Based on its current assessment, the Governing Council considers that the key ECB interest rates have reached levels that, maintained for a sufficiently long duration, will make a substantial contribution to the timely return of inflation to the target. The Governing Council’s future decisions will ensure that the key ECB interest rates will be set at sufficiently restrictive levels for as long as necessary. The Governing Council will continue to follow a data-dependent approach to determining the appropriate level and duration of restriction. In particular, the Governing Council’s interest rate decisions will be based on its assessment of the inflation outlook in light of the incoming economic and financial data, the dynamics of underlying inflation, and the strength of monetary policy transmission.
Economic activity
The economy is likely to remain subdued in the coming months. It broadly stagnated over the first half of the year, and recent indicators suggest it has also been weak in the third quarter. Lower demand for the euro area’s exports and the impact of tight financing conditions are dampening growth, including through lower residential and business investment. The services sector, which had so far been resilient, is now also weakening. Over time, economic momentum should pick up, as real incomes are expected to rise, supported by falling inflation, rising wages and a strong labour market, and this will underpin consumer spending.
The labour market has so far remained resilient despite the slowing economy. The unemployment rate stayed at its historical low of 6.4% in July. While employment grew by 0.2% in the second quarter, momentum is slowing. The services sector, which has been a major driver of employment growth since mid-2022, is now also creating fewer jobs.
The short-term outlook for growth in the euro area has deteriorated, while over the medium term the economy should gradually return to moderate growth as both domestic and foreign demand recover. Euro area economic activity grew at a subdued pace in the first half of 2023, despite the elevated level of manufacturing order backlogs and the unwinding of high energy prices. Moreover, these effects have largely waned, and short-term indicators point to stagnation in the near term in the face of tighter financing conditions, weak business and consumer confidence and low foreign demand in the context of a strengthening of the euro. Growth is expected to pick up from 2024 as foreign demand approaches its pre-pandemic trend and real incomes improve, underpinned by declining inflation, strong nominal wage growth and still low, though slightly increasing, unemployment. However, growth will continue to be dampened as the ECB’s monetary policy tightening and adverse credit supply conditions feed through to the real economy and as fiscal support is gradually withdrawn. Overall, annual average real GDP growth is expected to slow down from 3.4% in 2022 to 0.7% in 2023, before recovering to 1.0% in 2024 and to 1.5% in 2025. Compared with the June 2023 Eurosystem staff projections, the outlook for GDP growth has been revised down by 0.2 percentage points for 2023, 0.5 percentage points for 2024 and 0.1 percentage points for 2025, reflecting a significant downgrade of the short-term outlook, amid deteriorating survey indicators, tighter financing conditions – including more adverse credit supply effects – and the stronger euro exchange rate.
As the energy crisis fades, governments should continue to roll back the related support measures. This is essential to avoid driving up medium-term inflationary pressures, which would otherwise call for an even stronger monetary policy response. Fiscal policies should be designed to make the euro area economy more productive and to gradually bring down high public debt. Policies to enhance the euro area’s supply capacity – which would be supported by the full implementation of the Next Generation EU programme – can help reduce price pressures in the medium term, while supporting the green transition. The reform of the EU’s economic governance framework should be concluded before the end of 2023 and progress towards capital markets union should be accelerated.
Inflation
Inflation declined to 5.3% in July but remained at that level in August, according to Eurostat’s flash estimate.[1] Its decline was interrupted because energy prices rose compared with July. Food price inflation has come down from its peak in March but was still almost 10% in August. In the coming months, the sharp price increases recorded in the autumn of 2022 will drop out of the yearly rates, thus pulling inflation down.
Inflation excluding energy and food fell to 5.3% in August, from 5.5% in July. Goods inflation declined to 4.8% in August, from 5.0% in July and 5.5% in June, owing to better supply conditions, previous drops in energy prices, easing price pressures in the earlier stages of the production chain and weaker demand. Services inflation edged down to 5.5% but was still kept up by strong spending on holidays and travel and by the high growth of wages. The annual growth rate of compensation per employee remained constant at 5.5% in the second quarter of the year. The contribution of labour costs to annual domestic inflation increased in the second quarter, in part owing to weaker productivity, while the contribution of profits fell for the first time since early 2022.
Most measures of underlying inflation are starting to fall as demand and supply have become more aligned and the contribution of past energy price increases is fading out. At the same time, domestic price pressures remain strong.
Most measures of longer-term inflation expectations currently stand at around 2%. But some indicators have increased and need to be monitored closely.
Headline inflation in the euro area is projected to continue to decline over the projection horizon owing to easing cost pressures and supply bottlenecks, as well as the impact of monetary policy tightening. HICP inflation excluding energy and food is also expected to gradually decline. However, it is projected to stand above headline inflation until early 2024. The projected disinflation is due to fading effects of the past energy price shocks and other pipeline price pressures, with strong growth in labour costs gradually becoming the dominant driver of HICP inflation excluding energy and food. Wage growth is expected to decline gradually from mid-2023, albeit remaining high over the projection horizon, driven by increases in minimum wages and inflation compensation, in a context of a tight, though cooling, labour market. Profit margins, which expanded notably last year, are expected to provide a buffer to the pass-through of labour costs to final prices in the medium term. In addition, the tighter monetary policy should increasingly dampen underlying inflation. Overall, with medium-term inflation expectations assumed to remain anchored at the ECB’s inflation target, headline HICP inflation is expected to decrease from an average of 8.4% in 2022 to 5.6% in 2023, 3.2% in 2024 and 2.1% in 2025, reaching the target in the third quarter of 2025. Compared with the June 2023 projections, HICP inflation has been revised up for 2023 and 2024, driven by higher energy futures prices, and down for 2025, as the impacts from the appreciation of the euro, tighter financing conditions and weaker cyclical conditions are seen to dampen HICP inflation excluding energy and food.
Risk assessment
The risks to economic growth are tilted to the downside. Growth could be slower if the effects of monetary policy are more forceful than expected, or if the world economy weakens, for instance owing to a further slowdown in China. Conversely, growth could be higher than projected if the strong labour market, rising real incomes and receding uncertainty mean that people and businesses become more confident and spend more.
Upside risks to inflation include potential renewed upward pressures on the costs of energy and food. Adverse weather conditions, and the unfolding climate crisis more broadly, could push food prices up by more than expected. A lasting rise in inflation expectations above the Governing Council’s target, or higher than anticipated increases in wages or profit margins, could also drive inflation higher, including over the medium term. By contrast, weaker demand – for example due to a stronger transmission of monetary policy or a worsening of the economic environment outside the euro area – would lead to lower price pressures, especially over the medium term.
Financial and monetary conditions
The monetary policy tightening continues to be transmitted strongly to broader financing conditions. Funding has again become more expensive for banks, as savers are replacing overnight deposits with time deposits that pay more interest and the ECB’s targeted longer-term refinancing operations are being phased out. Average lending rates for business loans and mortgages continued to increase in July, to 4.9% and 3.8% respectively.
Credit dynamics have weakened further. Loans to firms grew at an annual rate of 2.2% in July, down from 3.0% in June. Loans to households also grew less strongly, by 1.3%, after 1.7% in June. In annualised terms based on the last three months of data, household loans declined by 0.8%, which is the strongest contraction since the start of the euro. Amid weak lending and the reduction in the Eurosystem balance sheet, the annual growth rate of M3 fell from 0.6% in June to an all-time low of -0.4% in July. In annualised terms over the past three months, M3 contracted by 1.5%.
Monetary policy decisions
At its meeting on 14 September 2023 the Governing Council decided to raise the three key ECB interest rates by 25 basis points. Accordingly, the interest rate on the main refinancing operations and the interest rates on the marginal lending facility and the deposit facility were increased to 4.50%, 4.75% and 4.00% respectively, with effect from 20 September 2023.
The asset purchase programme portfolio is declining at a measured and predictable pace, as the Eurosystem no longer reinvests the principal payments from maturing securities.
As concerns the pandemic emergency purchase programme (PEPP), the Governing Council intends to reinvest the principal payments from maturing securities purchased under the programme until at least the end of 2024. In any case, the future roll-off of the PEPP portfolio will be managed to avoid interference with the appropriate monetary policy stance.
The Governing Council will continue applying flexibility in reinvesting redemptions coming due in the PEPP portfolio, with a view to countering risks to the monetary policy transmission mechanism related to the pandemic.
As banks are repaying the amounts borrowed under the targeted longer-term refinancing operations, the Governing Council will regularly assess how targeted lending operations and their ongoing repayment are contributing to its monetary policy stance.
Conclusion
Inflation continues to decline but is still expected to remain too high for too long. The Governing Council is determined to ensure that inflation returns to its 2% medium-term target in a timely manner. In order to reinforce progress towards its target, the Governing Council decided at its meeting on 14 September 2023 to raise the three key ECB interest rates by 25 basis points. Based on its current assessment, the Governing Council considers that the key ECB interest rates have reached levels that, maintained for a sufficiently long duration, will make a substantial contribution to the timely return of inflation to the target. The Governing Council’s future decisions will ensure that the key ECB interest rates will be set at sufficiently restrictive levels for as long as necessary. The Governing Council will continue to follow a data-dependent approach to determining the appropriate level and duration of restriction.
In any case, the Governing Council stands ready to adjust all of its instruments within its mandate to ensure that inflation returns to its medium-term target and to preserve the smooth functioning of monetary policy transmission.
1 External environment
After rebounding strongly at the start of 2023, the global economy is set to expand at a more moderate pace in the remainder of the year, mainly reflecting a loss of momentum in China’s economic recovery. However, the outlook for global growth embedded in the September ECB staff macroeconomic projections for the euro area remains broadly similar to the June Eurosystem staff macroeconomic projections. In fact, while global growth remains steady overall over the projection horizon, its country composition has changed, as the growth outlook for China was revised significantly downwards while real GDP growth was revised upwards in the United States owing to the resilience displayed by its economy so far. Weak global trade growth in 2023 reflects the composition of global economic activity, which is being driven by less trade-intensive countries (emerging economies), demand components (consumption) and products (services). Global trade growth is expected to pick up again over the rest of the projection horizon and increase broadly in line with global activity. Compared with the June projections, both global imports growth and euro area foreign demand growth were revised downwards for 2023, largely on account of further downward revisions to historical data and weaker than estimated outturns in the second quarter at the cut-off date for the projections. However, the growth of foreign demand over the rest of the projection horizon remains comparable with the June projections. Global headline consumer price index (CPI) inflation is receding gradually but underlying inflationary pressures remain strong, particularly among advanced economies. However, euro area competitor export prices are projected to decline sharply, driven by commodity price developments.
After a strong start at the beginning of 2023, global economic activity is now moderating, mainly reflecting a loss of momentum in China’s recovery. In the September projections, global growth is expected to ease in the second half of the year. Despite remaining broadly in line with the June projections, its underlying country composition has changed.[2] In key advanced economies, including the United States and the United Kingdom, economic activity remained more resilient than anticipated, while in China it slowed more sharply than previously estimated, as problems in the residential real estate sector resurfaced and dampened the consumption-led recovery. The expected moderation in global economic activity is also confirmed by incoming high-frequency data. The global composite output Purchasing Managers’ Index (PMI) remains on a downward trend, albeit staying in expansionary territory in both advanced and emerging economies. The same is true for the services output PMI, while the manufacturing output PMI has fallen deeper into contractionary territory across advanced economies but edged up in emerging market economies, narrowing the gap in relation to the services sector (Chart 1).
Chart 1
PMI output by sector across advanced and emerging market economies
a) Advanced economies (excluding the euro area)
(diffusion indices)

b) Emerging market economies
(diffusion indices)
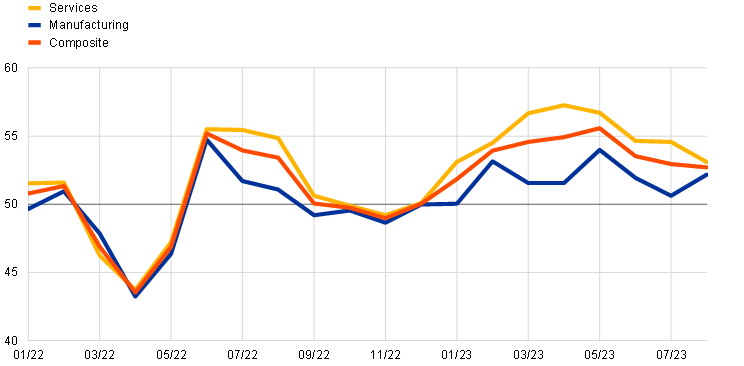
Sources: S&P Global Market Intelligence and ECB staff calculations.
Note: The latest observations are for August 2023.
The overall global growth outlook in the September projections is close to that of the June projections but prospects across major economies were reassessed. Global real GDP is now projected to expand by 3.2% in 2023, 3.0% in 2024 and 3.2% in 2025, reflecting only small revisions compared with the June projections (+0.1 percentage points in 2023 and -0.1 percentage points in both 2024 and 2025). However, growth prospects in China have been revised substantially downwards, owing to the aforementioned dynamics in the country’s residential real estate sector.[3] Economic activity in major advanced economies, by contrast, was revised upwards for 2023, reflecting stronger labour market resilience, although the growth outlook is expected to weaken further along the projection horizon. Emerging market economies remain a key driver of global economic growth, despite projected growth being somewhat slower than in the June projections.
World trade growth is expected to remain weak this year and recover gradually thereafter. Sluggish global trade this year contrasts with relatively resilient global activity. Global imports are projected to grow only marginally this year (+0.2%) because imports across advanced economies are expected to contract, reflecting weak demand resulting from tighter financial conditions and composition effects related, in part, to the post-pandemic recovery. Three compounding compositional effects continue to explain weak trade in 2023, as activity is being driven by less trade-intensive geographies (emerging economies), demand components (consumption) and products (services). However, the weakness in global trade has bottomed out and momentum is expected to gradually improve in the remainder of 2023. This is in line with the latest data for global trade in goods (Chart 2) and also reflects the strong post-pandemic recovery in services trade, such as tourism. For the period 2024-25, global trade is projected to regain some further momentum, and to grow more in line with real GDP, expanding by 3.2% in 2024 and 3.3% in 2025. Euro area foreign demand growth is projected to remain flat this year and to increase by 3% annually over the period 2024-25. Compared with the June 2023 projections, both world imports and euro area foreign demand growth have been revised downwards in 2023 (by 1.1 percentage points and 0.4 percentage points respectively), largely on account of further downward revisions to historical data at the turn of the year and weaker than previously estimated imports in the second quarter at the cut-off date for the projections. For 2024 and 2025, downward revisions are smaller, amounting to around 0.1 percentage points per year.
Chart 2
Merchandise trade momentum
(real imports, three-month-on-three-month percentage changes)
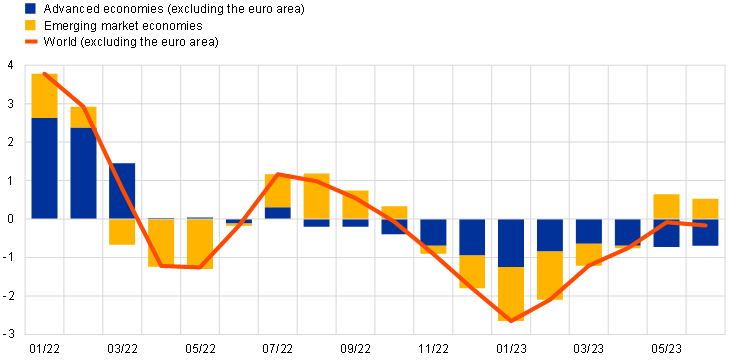
Sources: CPB and ECB staff calculations.
Note: The latest observations are for June 2023.
Headline CPI inflation has been declining globally, supported by lower energy and food prices but core inflation remains high. Headline and core (excluding food and energy) CPI inflation across the member countries of the Organisation for Economic Co-operation and Development (OECD) increased slightly in July to 5.9% (up from 5.7% in June) and to 6.7% (up from 6.6%) respectively. This was mainly attributable to annual inflation in Türkiye, which jumped by 10 percentage points to 48%, in July. Excluding Türkiye, headline inflation remained broadly stable in July (at 4.4%, down slightly from 4.5% in June) and core inflation declined slightly (to 5.0%, down from 5.2% in June). Persistently high core inflation can largely be ascribed to developments in services. Goods price inflation fell sharply as global demand-supply imbalances were resolved in the goods market. Inflation momentum, measured as the three-month-on-three-month annualised percentage changes, eased in July for headline inflation, down to 2.8% from 3.5% in the previous month (Chart 3), and core inflation, down to 4.3% from 5.3%. Euro area competitor export prices have been on a downward path since mid-2022, owing to falling commodity prices and a gradual easing in domestic and foreign pipeline pressures. Export prices of euro area competitors have been revised downwards for this year compared with the June projections, reflecting a decline in export price inflation in key trading partners, whereas they have been revised slightly upwards for 2024, owing to higher commodity prices.
Chart 3
OECD headline inflation momentum
(three-month-on-three-month annualised percentage changes)
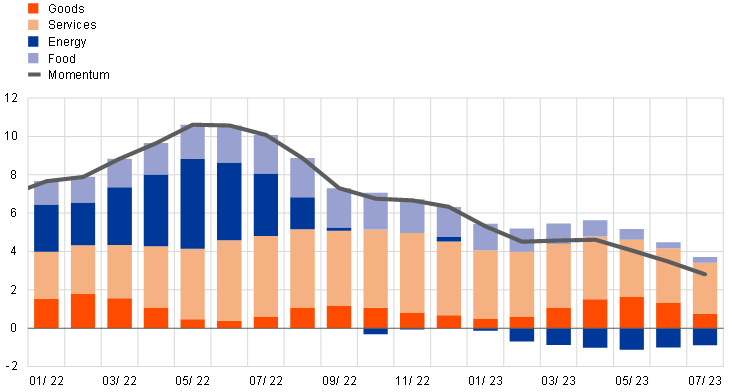
Sources: OECD and ECB calculations.
Notes: The chart excludes Türkiye. Contributions of respective components of OECD headline inflation momentum reported in the chart are constructed bottom-up using available country data, which jointly account for 84% of the OECD area aggregate. Goods inflation is computed as the residual of the contribution of total goods, less those of energy and food. The latest observations are for July 2023.
Crude oil prices are higher than in the June projections, following Saudi Arabia and Russia’s agreement to extend their production cuts. In early September, Saudi Arabia and Russia extended their one-month production cuts to the rest of 2023. The production cuts correspond to around 1.3% of global supply and add to previously agreed production cuts in the OPEC+ group and further tighten the oil market which, according to the International Energy Agency, is now in a deficit of supply. The effects of the supply cuts acted as a counterweight to weaker demand in China. European gas prices have shown some volatility amid supply shortages, related to outages in Norway and more recently to strikes at liquified natural gas terminals in Australia, but declined since the June projections, as the EU reached its 90% storage target three months ahead of schedule. While this implies that risks to supply in the short term remain limited, they cannot be ruled out fully because there may be supply outages for a prolonged period. In general, the European gas market remains very sensitive to supply disruptions, as recently illustrated by price volatility caused by outages and strikes.
Global financial conditions tightened slightly across advanced and emerging market economies. In the United States, the modest tightening of financial conditions mainly reflected an increase in long-term sovereign bond yields and an appreciation in the US dollar nominal effective exchange rate, which was partly offset by favourable risk sentiment in the domestic corporate bond market. These developments took place against a background of positive macroeconomic surprises and a further easing in inflationary pressures. Financial conditions also tightened slightly in other advanced and emerging market economies, mostly reflecting higher long-term interest rates. In emerging markets, domestic currencies that are weaker against the US dollar also contributed somewhat to tighter financial conditions, as early and aggressive interest rate hikes in some countries allowed their central banks to pause and, in some cases, to cut policy rates, while sovereign spreads and equity valuations remained stable.
In the United States, economic activity remained resilient but is expected to moderate towards the end of the year as tighter monetary policy restrains activity. Recent data on household spending and services activity suggest GDP growth will remain strong in the third quarter. Nonetheless, household consumption growth is expected to moderate somewhat amid some loosening labour market conditions. Tighter lending standards are expected to weigh on investment, leading to positive but below-potential GDP growth in the period 2024-25. A tepid recovery in real GDP growth is projected in 2025. Headline CPI inflation ticked up slightly to 3.2% in July (down from 3.0% in June), owing to a smaller disinflationary contribution from the energy component. Core inflation declined only slightly to 4.7% in July (down from 4.8% in June) amid a continued easing of goods inflation, while among services a rebound in transportation and recreation services inflation partly offsets the ongoing slow decline in shelter services inflation. Headline inflation is expected to decline, despite decreasing – albeit still strong – wage growth exerting persistent upward pressure on non-housing services inflation.
In China, growth experienced a sharp loss of momentum in the second quarter. After rebounding strongly in the first quarter of 2023, following the easing of COVID-19 related containment measures, growth momentum slowed markedly in the second quarter, driven by a renewed downturn in the housing market, which also weighed on consumer confidence. While consumption activity, especially for services, continued to normalise, net exports and private investment were weaker than expected in the June projections. Available high-frequency indicators up to August suggest continued weakness in the housing market and moderating growth in services but some stabilisation in manufacturing activity. Annual headline CPI inflation fell into negative territory in July (-0.3% year on year), while core CPI inflation continued to increase (+0.8% year on year) driven mainly by prices for services. In month-on-month terms, headline and core inflation increased slightly, following decreases over the previous months. This suggests that annual inflation may start to pick up, yet weak domestic and external demand are likely to limit inflationary pressures.
In Japan, the economy expanded significantly in the first half of 2023, albeit amid shifting dynamics. While domestic demand was a key driver of growth earlier in the year, the surprisingly strong growth outturn in the second quarter was driven almost entirely by net exports, whereas domestic demand stagnated. Looking ahead, economic activity is projected to remain on a moderate growth trajectory. While domestic demand is expected to recover to some extent in the third quarter, growth is likely to slow compared with the first half of the year, reflecting a recovery in imports. Annual headline inflation remained unchanged at 3.3% in July, as falling energy inflation was offset by rising food inflation and higher accommodation and mobile phone charges. In the same month, core inflation increased slightly from 2.6% to 2.7%, reflecting firms’ underlying price momentum. Headline inflation is expected to moderate in the second half of this year as cost pressures ease, in line with the recent deceleration in producer price inflation and falling import prices.
In the United Kingdom, growth has been muted over the past year amid high inflation and tightening financing conditions, albeit displaying some resilience. Growth in economic activity is also expected to remain subdued in the coming quarters, reflecting more persistent inflationary pressures than were expected in the June projections, while households and firms also face higher interest rates on the back of further monetary policy tightening. Recent survey data have added downside risks to the short-term outlook, with the composite PMI output index falling six points over the past four months. Activity is projected to pick up next year, supported by the recovery in real wages as inflation continues to recede. Headline CPI inflation declined strongly to 6.8% in July (down from 7.9% in June) mainly as a result of a large fall in energy bills and lower food price inflation. At the same time, core inflation remained unchanged at 6.9%, owing to persistently high services price inflation. Headline inflation is expected to decrease over time, reaching the Bank of England’s target of 2% at the beginning of 2025.
2 Economic activity
The euro area economy broadly stagnated over the first half of the year. In the second quarter of 2023, real GDP growth was 0.1%, as in the first quarter. Recent indicators suggest it has also been weak in the third quarter. Lower demand for euro area exports and the impact of tight financing conditions are dampening growth, including through lower residential and business investment. The slowdown in activity is spreading to all sectors of the economy. Manufacturing output has been contracting since the fourth quarter of 2022 and is expected to remain weak, as the past impulse to production from order backlogs is declining and new orders remain subdued. Activity in the services sector, which had been more resilient, showed clear signs of slowdown at the beginning of the third quarter, suggesting that the post-pandemic boost to services demand might be fading away. Over time, economic momentum should pick up, as real incomes are expected to rise, supported by falling inflation, rising wages and a strong labour market, which should underpin consumer spending.
This outlook is broadly reflected in the September 2023 ECB staff macroeconomic projections for the euro area, which foresee annual real GDP growth slowing down to 0.7% in 2023, before recovering to 1.0% in 2024 and to 1.5% in 2025. Compared with the June 2023 Eurosystem staff macroeconomic projections, the outlook for GDP growth has been revised down over the entire projection horizon, by 0.2 percentage points in 2023, 0.5 percentage points in 2024 and 0.1 percentage points in 2025. The risks to economic growth are tilted to the downside.
The euro area economy grew by 0.1% in the second quarter of 2023, amid large variations between countries. The positive contributions of inventory accumulation and, to a lesser extent, of domestic demand were partly offset by a negative net trade contribution (Chart 4). This modest growth in activity reflects divergent dynamics across sectors: services activity grew, while manufacturing and construction activity declined. It also masked considerable divergence across the largest euro area countries, reflecting the varying extent to which these were affected by the slowdown in the global trade of goods and by the recovery of the contact-intensive services sector. Quarter on quarter, GDP increased by 0.5% in France and by 0.4% in Spain, while it remained unchanged in Germany and decreased by 0.4% in Italy and by 0.3% in the Netherlands.
Chart 4
Euro area real GDP and its components
(quarter-on-quarter percentage changes; percentage point contributions)
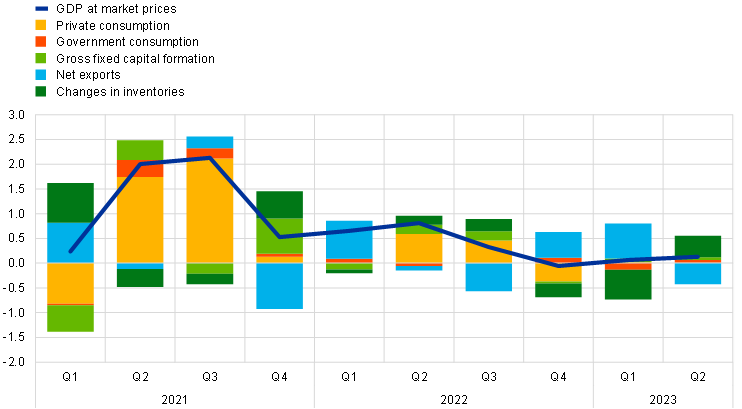
Sources: Eurostat and ECB calculations.
Note: The latest observations are for the second quarter of 2023.
Activity in the third quarter of 2023 is expected to remain weak. Incoming survey data point to subdued economic growth in the third quarter of 2023, driven not only by a continued weakness in manufacturing activity, but also by a deceleration in services, which had previously shown resilience. The composite output Purchasing Managers’ Index (PMI) for the euro area continued to fall further below the growth threshold of 50 in July and August. The PMI for manufacturing remained in contractionary territory, as the support from the improvement of supply chain conditions has run its course, backlogs of work are easing and new orders are falling (Chart 5, panel a). However, in recent months the weakness spread to the services sector, with the PMI for services activity dropping below the zero-growth threshold in August (Chart 5, panel b). This outcome reflects the fading effect of the post-pandemic reopening on services demand, which was, until recently, a significant driver of the growth differential between manufacturing and contact-intensive services.[4] The European Commission’s Economic Sentiment Indicator declined further in August across sectors, pointing to a clear weakening in growth dynamics in the third quarter. Consumer confidence declined slightly in August, interrupting the recovery that started in late 2022, and stands well below its long-term average. This suggests a weak outlook for domestic demand. Overall, the recent indicators suggest that GDP growth remains weak in the third quarter, as the subdued foreign demand and the tightening financing conditions are expected to weigh on economic growth in the euro area.
Chart 5
PMI indicators across sectors of the economy
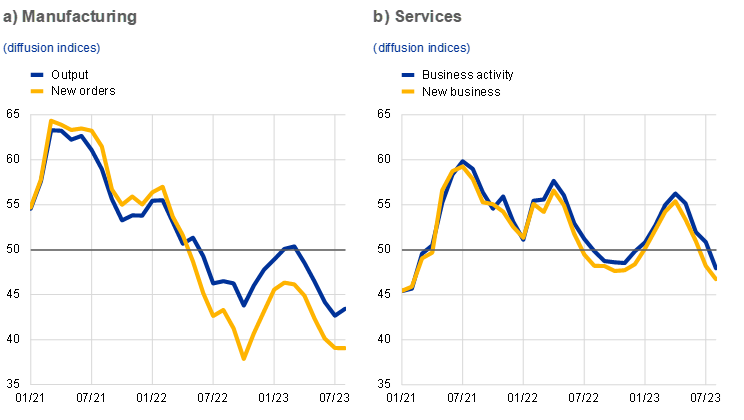
Source: S&P Global Market Intelligence.
Note: The latest observations are for August 2023.
The labour market remained resilient in the second quarter, but employment growth slowed amid weakened economic activity. Employment and total hours worked increased by 0.2% in the second quarter of 2023. Since the fourth quarter of 2019, employment has increased by 3.3% and the total number of hours worked has risen by 1.9% (Chart 6). This implies a 1.4% decline in average hours worked. This decline is related to ongoing labour hoarding (the part of labour input which is not fully utilised by a company during its production process at any given point in time), as well as to other factors. The implied labour force is estimated to have increased by about 600,000 people between January and July, but growth has slowed since April.[5] The unemployment rate in July was 6.4%, broadly unchanged compared with June and remaining at its lowest level since the creation of the euro. Labour demand remains strong, with the job vacancy rate broadly stable at 3.0%, 0.2 percentage points lower than its highest level since the start of the series.
Chart 6
Euro area employment, the PMI assessment of employment and the unemployment rate
(left-hand scale: quarter-on-quarter percentage changes, diffusion index; right-hand scale: percentages of the labour force)
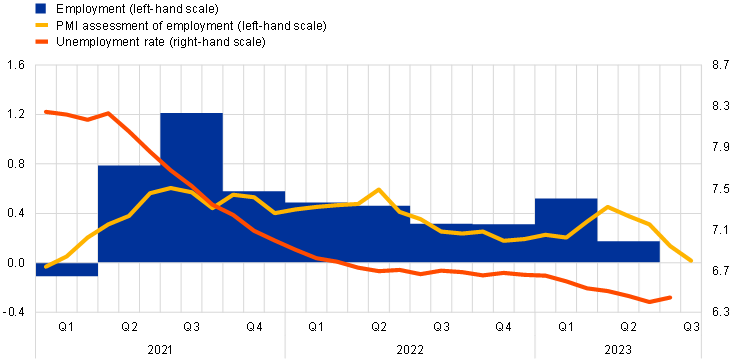
Sources: Eurostat, S&P Global Market Intelligence and ECB calculations.
Notes: The two lines indicate monthly developments, while the bars show quarterly data. The PMI is expressed in terms of the deviation from 50 divided by 10. The latest observations are for the second quarter of 2023 for employment, August 2023 for the PMI assessment of employment and July 2023 for the unemployment rate.
Short-term labour market indicators suggest a further slowdown in employment growth in the third quarter of 2023. The monthly composite PMI employment indicator declined from 51.4 in July to 50.2 in August; a value below the threshold of 50 indicates a decrease in employment. This indicator has declined substantially since April, when it reached 54.5. The recent decline has been sharper in the services sectors but the PMI remains in expansionary territory, while manufacturing and construction are below the 50 threshold. Among the services sectors, there was a larger decline in those more closely linked to manufacturing activity, such as transport and professional services.
Private consumption stagnated in the second quarter of 2023, as the continued drop in spending on goods offset the still positive demand for services (Chart 7, panel a). Quarter on quarter, retail sales increased by just 0.1% in the second quarter of 2023 before declining by 0.2% in July 2023, while new passenger car registrations fell by 0.5% in the second quarter of 2023 but rebounded by 3.7% in July. In contrast to the decline in spending on goods, in particular on durable products and food, household consumption of services increased by 0.5% in the second quarter, still benefiting from the lingering reopening effects.[6]
Chart 7
Real private consumption indicators

Sources: Eurostat, European Commission (Directorate-General for Economic and Financial Affairs) and ECB calculations.
Notes: In panel a), the levels of consumption components (domestic concept) are scaled to match the level of total private consumption (national concept). For panel b), expected demand for contact-intensive services in the next three months is standardised over the period 2005-19, while expected retail trade business situation in the next three months is standardised over the period 1985-2019. The latest observations are for the second quarter of 2023 for panel a) and for August 2023 for panel b).
While surveys suggest a continued weakness in spending on goods, expectations about demand for contact-intensive services have not yet been adjusted down. The European Commission’s consumer confidence indicator declined in August, interrupting its recovery since late 2022, and remained below its long-term average. This reflects deteriorating expectations about the general economic outlook and households’ own financial situations. At the same time, the Commission’s indicators of expected major purchases by consumers and expected retail trade business situation remained subdued. In contrast, the expected demand for contact-intensive services had not yet seen any strong downward correction since May 2023 and continued to be above its historical average in August (Chart 7, panel b). Similarly, the ECB’s Consumer Expectations Survey from July showed a drop in expected purchases of home appliances and other major items, thus pointing to ongoing weak spending for durable goods, but still resilient expected demand for holiday bookings. The transmission of tighter financing conditions to the real economy would likely curb household borrowing, maintain high incentives to save and keep consumer spending growth subdued in the near term.
Business investment growth slowed markedly in the second quarter of 2023 and is expected to contract in the third quarter. Excluding volatile Irish intellectual property products (IPP) data, euro area non-construction investment decelerated strongly in the second quarter (slowing to 0.4% quarter on quarter, compared with 1.2% in the first quarter).[7] The slowdown was fairly broad-based across countries but more varied across asset classes, with investment in transport goods rebounding, IPP growing at its long-term average, and investment in machinery and equipment excluding transport contracting modestly (Chart 8).[8] The PMI capital goods’ output indicator fell deep into contractionary territory in August, amid ongoing declines in both new orders and outstanding business. Confidence continues to wane and the European Commission’s latest survey shows a quarter of capital goods firms now citing a lack of demand as a limit to production. The outlook remains highly uncertain. Earnings calls into August suggest an ongoing recovery since last autumn in profit sentiment (which tends to track corporate gross operating surplus reasonably well, although both indicators lag the most recent dynamics), while ongoing needs for green and digital investment, crowded in by NGEU funds, and elevated labour shortages in some sectors offer further incentives to invest.[9] However, headwinds to investment remain substantial against the backdrop of a global slowdown and worsening credit conditions.[10] Earnings calls show financial risk sentiment remains at an unprecedented level, while the S&P Global Business Outlook Survey, produced three times each year, suggests lower investment over the next 12 months, reflecting worsening expectations for activity and profitability ahead.
Chart 8
Non-construction investment and asset class contributions
(quarter-on-quarter percentage changes and percentage point contributions)
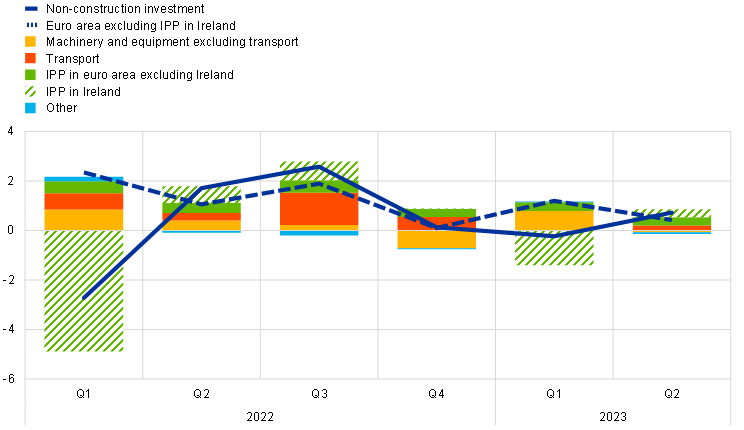
Sources: Eurostat and ECB calculations.
Notes: IPP refers to (mainly intangible) intellectual property products. The latest observations are for the second quarter of 2023.
Following a decline in the second quarter of 2023, housing investment is likely to fall further in the near term. Quarter on quarter, housing investment decreased by 1.0% in the second quarter of 2023 following a 0.8% increase in the first quarter. Short-term indicators point to further declines in the coming quarters. Building construction output fell significantly in June, implying a negative carry-over to growth in the third quarter. Moreover, the European Commission’s indicator for the development in building construction activity in the last three months fell well below its average for the second quarter in July and August, while the housing output PMI fell further below the growth threshold to 35.7 in August, its lowest level so far this year. The weak outlook for housing investment is consistent with the marked downward trend in residential building permits, which is also increasingly reflected in firms’ poorer assessment of order books in the European Commission’s survey. Housing sentiment, as measured by the Commission’s quarterly survey of households’ short-term intentions to renovate, buy or build a house, fell somewhat in the third quarter of 2023. The negative mood is mainly due to the significant rise in interest rates and its adverse impact on housing affordability, although this is offset to some extent by falling house prices. This decline in housing affordability, together with the tightening of banks’ lending criteria for housing loans, is weighing on the momentum of housing investment.
Export growth remained subdued in the second quarter, reflecting weak global demand, the earlier appreciation of the euro and high energy prices. Quarterly growth in export volumes was negative in the second quarter, as weak global trade dampened foreign demand for euro area goods. In addition, the euro’s appreciation, which started in September 2022, has weakened euro area competitiveness, and the energy price increase of 2022 contributed to export weakness, especially in energy-intensive sectors. At the same time, the reduction in order backlogs observed during the previous quarters seems to be fading as a key factor supporting exports, as export order books have returned to pre-pandemic levels. Import growth turned slightly positive in the second quarter, largely reflecting a rebound from the sharp decrease in the first quarter. In year-on-year terms, however, imports declined amid weak domestic demand. Overall, net trade contributed negatively to GDP growth in the second quarter. Forward-looking indicators point to continued near-term weakness in euro area export volumes. The relative strength in services exports observed so far seems to be fading, as exporters in this sector reported a deterioration in their order books. This seems to reflect both a slowdown in pent-up demand for services following the post-pandemic reopening of contact-intensive services and some spillover from the weakness in manufacturing, where exporters reported a further decline in new orders.
Beyond the near term, euro area activity is expected to recover, supported by an increase in real incomes. GDP growth is expected to strengthen, supported by the abating inflationary pressures and resilient labour income growth, allowing for a recovery in real disposable income and private consumption. However, the impact of these positive factors should be offset by the impact of higher interest rates and tighter credit supply conditions increasingly feeding through to the real economy.
The September 2023 ECB staff macroeconomic projections for the euro area foresee annual real GDP growth slowing down to 0.7% in 2023, before recovering to 1.0% in 2024 and to 1.5% in 2025 (Chart 9). Compared with the June 2023 Eurosystem staff projections, the outlook for GDP growth has been revised down by 0.2 percentage points for 2023, 0.5 percentage points for 2024 and 0.1 percentage points for 2025, reflecting a significant downgrade of the short-term outlook on the back of deteriorating survey indicators, tighter financing conditions (including more adverse credit supply effects) and the stronger euro.
The risks to economic growth are tilted to the downside. Growth could be slower if the effects of monetary policy are more forceful than expected, or if the world economy weakens, for instance owing to a further slowdown in China. Conversely, growth could be higher than projected if the strong labour market, rising real incomes and receding uncertainty mean that people and businesses become more confident and spend more.
Chart 9
Euro area real GDP (including projections)
(index: fourth quarter of 2019 = 100; seasonally and working day-adjusted quarterly data)

Sources: Eurostat and the September 2023 ECB staff macroeconomic projections for the euro area.
Note: The vertical line indicates the start of the projection horizon.
3 Prices and costs
According to Eurostat’s flash estimate, inflation was at 5.3% in August 2023, the same as it was in July.[11] This unchanged headline inflation rate for August concealed lower rates for all main subcomponents except for energy inflation, which was less negative than in the previous month. Upside risks to inflation include potential renewed upward pressures on the costs of energy and food. Adverse weather conditions, and the unfolding climate crisis more broadly, could push food prices up by more than expected. Indicators of underlying inflation continued to decline, but remained at elevated levels that reflect, inter alia, high wage pressures. A lasting rise in inflation expectations above our target, or higher than anticipated increases in wages or profit margins, could also drive inflation higher, including over the medium term. The September 2023 ECB staff macroeconomic projections for the euro area foresee headline inflation continuing its downward path, averaging 5.6% in 2023, 3.2% in 2024 and 2.1% in 2025.
After decreasing successively for nine months following a peak in October 2022, Harmonised Index of Consumer Prices (HICP) inflation was unchanged in August 2023 (Chart 10). The unchanged headline inflation rate of 5.3% resulted from a less negative energy inflation rate offsetting lower rates for food, non-energy industrial goods (NEIG) and services. The increase in energy inflation from -6.1% in July to -3.3% in August reflects a strong month-on-month increase resulting from higher oil and, consequently, fuel prices. Food inflation declined further, falling from 10.8% in July to 9.8% in August as a result of lower rates for both unprocessed and processed food components. However, processed food inflation remained in double digits (10.4%) in August, as the recent softening in pipeline pressures is yet to show in retail prices. HICP inflation excluding energy and food (HICPX) declined to 5.3% in August, down from 5.5% in July, owing to slight decreases in both its main components, NEIG and services. NEIG inflation declined further from 5.0% in July to 4.8% in August, reflecting the easing of past pipeline price pressures from supply bottlenecks and energy prices, as well as weaker demand. By and large, services inflation remained more persistent, standing at 5.4% in June, 5.6% in July and 5.5% in August. This was likely supported by travel and hospitality-related items and by high wage growth.
Chart 10
Headline inflation and its main components
(annual percentage changes; percentage point contributions)
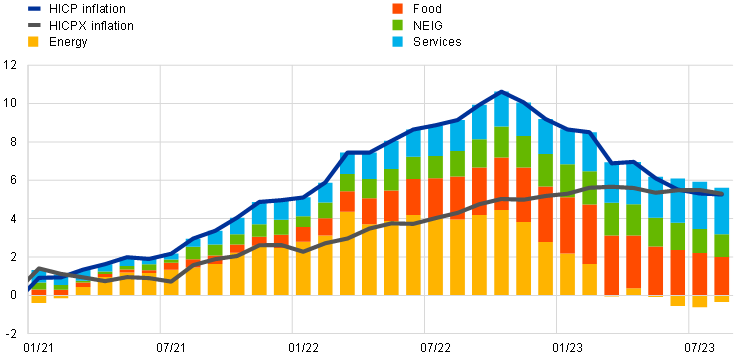
Sources: Eurostat and ECB calculations.
Note: The latest observations are for August 2023 (flash estimate).
Although they remained high overall, most indicators of underlying inflation continued to decrease, reflecting the fading effect of previous shocks to energy costs and supply chains as well as demand-supply mismatches (Chart 11). While HICPX inflation is available for August, the latest available data for other indicators of underlying inflation refer to July. Most indicators in July displayed a decline in their annual growth rates. The Supercore indicator, which comprises HICP items sensitive to the business cycle, declined from 6.0% in June to 5.8% in July, while the model-based Persistent and Common Component of Inflation (PCCI) measure declined from 2.8% to 2.6%. Although the indicators are mostly decreasing, uncertainty surrounding underlying inflation dynamics is still high, as can be seen from the wide range across measures and their elevated levels.
Chart 11
Indicators of underlying inflation
(annual percentage changes)
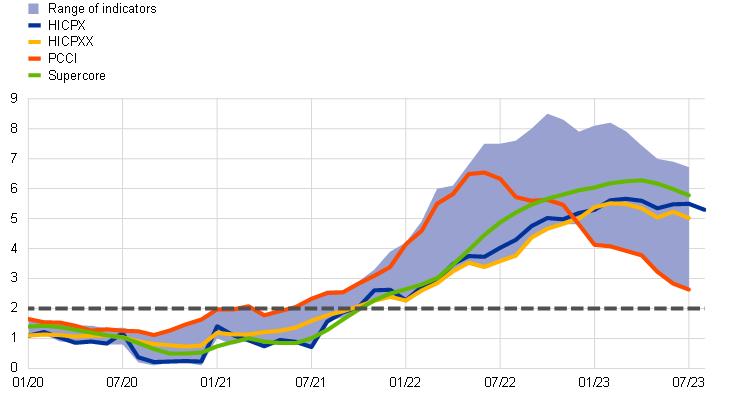
Sources: Eurostat and ECB calculations.
Notes: The range of indicators of underlying inflation includes HICP excluding energy, HICP excluding energy and unprocessed food, HICPX, HICP excluding energy, food, travel-related items, clothing and footwear (HICPXX), 10% and 30% trimmed means, PCCI and a weighted median. The grey dashed line represents the ECB’s inflation target of 2% over the medium term. The latest observations are for August 2023 (flash estimate) for HICPX and July 2023 for the remaining items.
Pipeline pressures continued to ease as the cumulative effects of past price shocks further dissipated (Chart 12). At the early stages of the pricing chain, price pressures continued to decrease substantially in July. Domestic producer price inflation for intermediate goods has been negative since May and declined to ‑4.0% in July, down from -2.8% in June, while import prices for the same goods fell to ‑8.9%. Producer price inflation for energy, which has been negative since April, fell substantially to -24.3% in July, down from -16.5% in June, reflecting the fading effects of previous energy price shocks. At the later stages of the pricing chain, domestic producer price inflation for non-food consumer goods declined to 5.0% in July, confirming the gradual easing of accumulated pipeline pressures for consumer goods. The same is true for pipeline pressures in the consumer food segment, with producer price inflation for manufactured food declining further in July, though remaining at a high level of 6.6%. The annual growth rate in import prices for these categories kept declining to negative terms in July. Movements in the euro exchange rate in the past months continue to affect the magnitude and movement of import price dynamics, with its recent strengthening contributing to the easing of price pressures.
Chart 12
Indicators of pipeline pressures
(annual percentage changes)

Sources: Eurostat and ECB calculations.
Note: The latest observations are for July 2023.
Domestic cost pressures, as measured by the growth in the GDP deflator, were unchanged in the second quarter of 2023, as increasing contributions from labour costs were offset by lower contributions from profits (Chart 13). The year-on-year growth rate of the GDP deflator stood at 6.2% in the second quarter of 2023, unchanged from the previous quarter. The contribution of unit profits to the GDP deflator declined to 2.3 percentage points from 3.2 percentage points in the previous quarter, offsetting the larger contribution of unit labour costs, which rose to 3.6 percentage points from 3.3 percentage points in the previous quarter, and unit taxes (net of subsidies). The rise in unit labour costs stemmed from a more negative annual growth in labour productivity, while the annual growth in compensation per employee was unchanged at 5.5%. Negotiated wage growth was also broadly unchanged in the second quarter of 2023, standing at 4.3% after 4.4% in the previous quarter. Forward-looking information from recently concluded wage negotiations does not yet show clear signals of a turning point in wage growth.
Chart 13
Breakdown of the GDP deflator
(annual percentage changes; percentage point contributions)
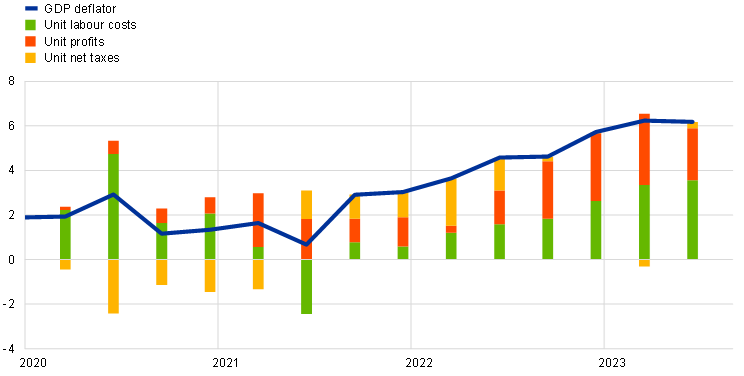
Sources: Eurostat and ECB calculations.
Notes: The latest observations are for the second quarter of 2023. Compensation per employee and labour productivity both contribute to changes in unit labour costs.
Survey-based measures of longer-term inflation expectations, as well as market-based measures of inflation compensation adjusted for risk premia, remained around 2%. In both the ECB Survey of Professional Forecasters for the third quarter of 2023 and the September 2023 ECB Survey of Monetary Analysts, the median longer-term expectations were at 2.0%. Market-based measures of inflation compensation (based on HICP excluding tobacco) increased across maturities over the review period, as higher energy prices and persistence in underlying inflation prompted market participants to revise their inflation outlook upwards (Chart 14). These factors were, however, partially counterbalanced by the worse-than-expected growth outlook for the euro area during the latter part of the review period. Overall, the one-year forward inflation-linked swap rate one year ahead increased by around 20 basis points to 2.6%. At the longer end, the five‑year forward inflation-linked swap rate five years ahead rose by 15 basis points to around 2.6%, slightly below the multi-year peak that it reached in early August. Despite following a similar pattern to those of their US breakeven counterparts, longer-term inflation-linked swap rates in the euro area remain high by historical standards. It should, however, be noted that these market‑based measures of inflation compensation are not a direct gauge of the genuine inflation expectations of market participants, as these measures include inflation risk premia, which compensate for inflation risks. Model-based estimates indicate that inflation risk premia account for a significant portion of the increase in the market pricing of inflation compensation at shorter maturities and for most of the increase at longer maturities. On the consumer side, the July 2023 ECB Consumer Expectations Survey reported that median expectations for headline inflation over the next year remained unchanged at 3.4%, while those for three years ahead increased from 2.3% to 2.4%. Although measures of inflation uncertainty from the Consumer Expectations Survey have decreased slightly from their peak levels, these remain relatively high.
Chart 14
Market-based measures of inflation compensation
(percentages per annum)
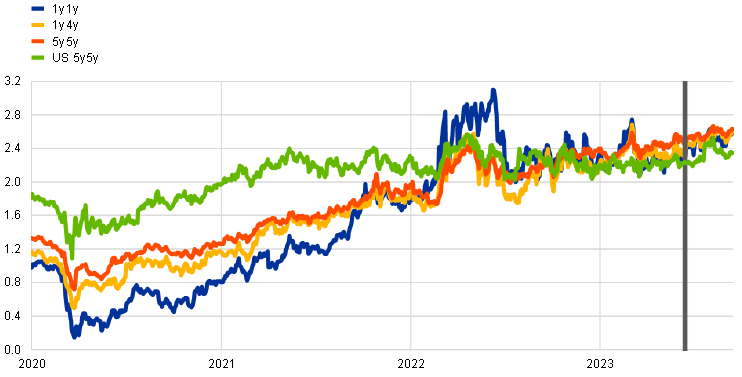
Sources: Refinitiv, Bloomberg and ECB calculations.
Notes: The chart shows inflation-linked swap forward rates over different horizons for the euro area and the five-year forward breakeven inflation rate five years ahead for the United States. The latest observations are for 13 September 2023.
The September 2023 ECB staff macroeconomic projections foresee headline inflation continuing its downward path, averaging 5.6% in 2023, 3.2% in 2024 and 2.1% in 2025 (Chart 15). This disinflationary path towards the 2% target reflects the fading effects of past energy shocks and other pipeline pressures, and the fact that longer-term inflation expectations remain anchored. The profile is also initially affected by strong downward base effects relating to energy and food inflation. Wage growth is expected to decline gradually from mid-2023 onwards, but it will remain high over the projection horizon and become the main driver of HICPX inflation. It is driven by increases in minimum wages and inflation compensation, in a context of a tight, but cooling, labour market. Profit margins, which expanded significantly last year, are expected to provide a buffer to the pass-through of labour costs to final prices in the medium term. In addition, tighter monetary policy should increasingly dampen underlying inflation. Compared with the June 2023 projections, the projections for headline inflation have been revised up by 0.2 percentage points for both 2023 and 2024 owing to a higher path for energy prices, and revised down by 0.1 percentage points for 2025, reflecting the dampening effects of the appreciation of the euro, tighter financing conditions and weaker cyclical conditions.
Chart 15
Euro area HICP and HICPX inflation
(annual percentage changes)
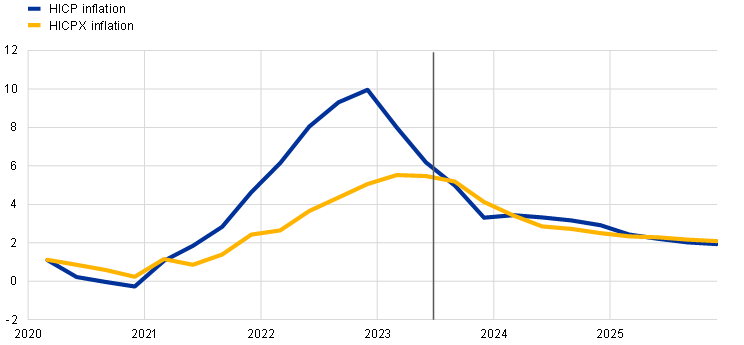
Sources: Eurostat and the September 2023 ECB staff macroeconomic projections for the euro area.
Notes: The vertical line indicates the start of the projection horizon. The latest observations are for the second quarter of 2023 for the data and the fourth quarter of 2025 for the projections. The September 2023 ECB staff macroeconomic projections were finalised at the end of August and the cut-off date for the technical assumptions was 22 August 2023. Both historical and actual data for HICP and HICPX inflation are at quarterly frequency.
4 Financial market developments
Euro area financial markets ended the review period (15 June to 13 September 2023) little changed overall, with some intra-period movements. Euro area short-term interest rates increased as expectations of policy tightening firmed amid some upward pressures on the inflation outlook. These policy rate expectations were tempered by weaker domestic data on the real economy and some moderation in global economic growth momentum. As a result, at the end of the review period, the euro short-term rate (€STR) forward curve peaked at around 4.0% in the first quarter of 2024, thus pricing in a moderate further tightening of monetary policy. Euro area long-term interest rates increased along with, but less than, market-based measures of inflation compensation as growth concerns weighed on government bond yields. Sovereign bond spreads were resilient to the negative macroeconomic surprises. In addition, the announced end of reinvestments under the asset purchase programme (APP) as of July 2023 have been smoothly absorbed. Spreads on non-financial corporate bonds of high-yield issuers widened slightly, consistent with the high exposure of such issuers to the economic cycle. Broad stock market indices declined in the euro area, as weaker earnings prospects depressed the stock market valuation of non-financial corporations (NFCs), despite the recovery in bank stock prices. In foreign exchange markets, the euro appreciated in trade-weighted terms.
At the end of the review period the peak of the €STR forward curve, at around 4.0% in the first quarter of 2024, was somewhat higher than at the beginning of the review period in mid-June (Chart 16). The benchmark €STR averaged 3.5% over the review period and closely followed the changes in the deposit facility rate, which the Governing Council had raised by 25 basis points (from 3.25% to 3.5%) at its monetary policy meeting on 15 June 2023 and by an additional 25 basis points (from 3.5% to 3.75%) at its meeting on 27 July. Excess liquidity decreased by €463 billion to stand at €3,681 billion, mainly reflecting repayments of the third series of targeted longer-term refinancing operations (TLTRO III). Short and medium-term overnight index swap (OIS) forward rates, which are based on the €STR, increased following the June meeting, as market participants revised their policy rate expectations upwards. Subsequently, the forward rates fell somewhat on account of a deterioration in the domestic and global macroeconomic outlook but increased again towards the end of the review period as expectations of policy tightening further firmed. The Governing Council’s decision in July to increase policy rates and set the remuneration of minimum reserves at 0% did not significantly affect the forward rates. At the end of the review period, the peak of the forward curve, at around 4.0% in the first quarter of 2024, was somewhat later than implied by the forward rates in mid-June. The policy rate expectations inferred from the forward curve are broadly in line with those elicited in surveys.
Chart 16
(percentages per annum)
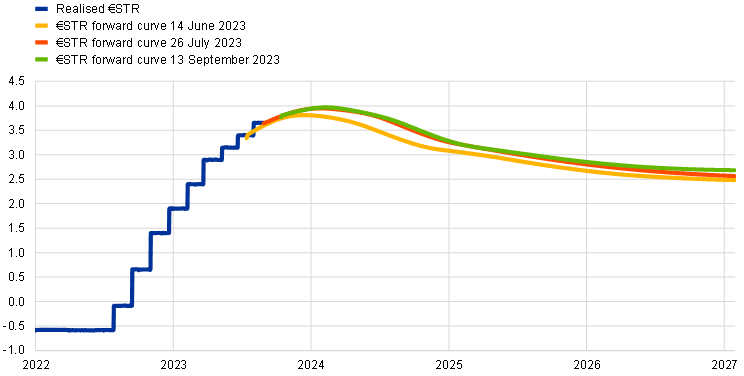
Sources: Thomson Reuters and ECB calculations.
Note: The forward curve is estimated using spot OIS (€STR) rates.
Euro area long-term risk-free rates increased slightly, only partially mirroring the increases in their US counterparts (Chart 17). Long-term risk-free rates in the euro area rose moderately, with the ten-year euro OIS rate increasing by 14 basis points to around 3.0% over the review period. The ten-year GDP-weighted euro area sovereign bond yield increased by a similar amount to 3.3%. Long-term interest rates across the euro area followed the evolution of market-based measures of inflation compensation, which rose largely on account of higher inflation risk premia (see Section 3). Long-term government bond yields increased by more in the United States than in the euro area on account of a more benign macroeconomic outlook. The divergence in macroeconomic prospects weighed on euro area long-term interest rates, especially during the latter part of the review period, as negative macroeconomic surprises led to a partial reversal of the previous increases. The inversion of the risk-free yield curve subsided slightly over the review period but remains at historically high levels.
Chart 17
Ten-year sovereign bond yields and the ten-year OIS rate based on the €STR
(percentages per annum)

Sources: Refinitiv and ECB calculations.
Notes: The vertical grey line denotes the start of the review period on 15 June 2023. The latest observations are for 13 September 2023.
Euro area sovereign bond spreads rose only modestly, despite the weakening economic outlook and the discontinuation of reinvestments under the APP (Chart 18). The GDP-weighted euro area average sovereign bond spread over the OIS rate based on the €STR increased by 6 basis points over the review period, to a level only moderately above that prevailing before the start of the ECB’s monetary policy normalisation. The sovereign spreads in different jurisdictions rose unevenly, with the Italian and Spanish spreads recording the largest increases of 20 and 15 basis points, respectively. The sovereign bond markets showed resilience not only to the deterioration in the macroeconomic outlook but also to the reduced market presence of the Eurosystem. The absence of significant upward pressures on spreads, despite the discontinuation of the reinvestment under the APP as of July and the usual summer trough in liquidity conditions, suggests that private investors are continuing to absorb the bonds no longer purchased by the Eurosystem without major difficulties.
Chart 18
Ten-year euro area sovereign bond spreads vis-à-vis the ten-year OIS rate based on the €STR
(percentage points)

Sources: Refinitiv and ECB calculations.
Notes: The vertical grey line denotes the start of the review period on 15 June 2023. The latest observations are for 13 September 2023.
Non-financial corporate bond spreads widened slightly amid a worsening domestic economy. Spreads on corporate bonds issued by NFCs increased by 5 basis points in the high-yield segment. Financial corporations, by contrast, witnessed a narrowing of their corporate bond spreads. The divergence reflects a stronger impact of the deterioration in the economic outlook on riskier NFCs than on financial corporations, as the latter continue to benefit from higher interest rates. Gross bond issuance by high-yield NFCs remained subdued, while investment-grade NFCs issued bonds at a similar pace as in previous years, mirroring the evolution of bond spreads across the rating spectrum.
Euro area equity prices fell over the review period, as weaker earnings prospects depressed the stock market valuation of NFCs (Chart 19). Broad stock market indices in the euro area declined by 2.9% over the review period, while those in the United States increased by 1.1%. The weaker performance in the euro area reflects decreases in the stock prices of NFCs attributable to negative earnings surprises and downward revisions of expected earnings. Within the non-financial sector, stock prices fell most in the consumer discretionary, industrial and technology sectors, strongly influenced by the deterioration in the domestic and global macroeconomic outlook. By contrast, stock prices of euro area banks increased by 3.9%, outperforming their counterparts in the United States.
Chart 19
Euro area and US equity price indices
(index: 1 January 2016 = 100)
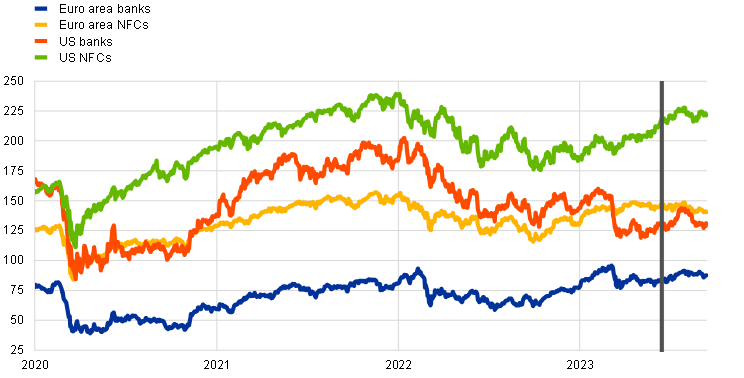
Sources: Refinitiv and ECB calculations.
Notes: The vertical grey line denotes the start of the review period on 15 June 2023. The latest observations are for 13 September 2023.
In foreign exchange markets, the euro appreciated in trade-weighted terms despite depreciating slightly against the US dollar (Chart 20). Over the review period the nominal effective exchange rate of the euro – as measured against the currencies of 41 of the euro area’s most important trading partners – appreciated modestly (1.5%). In terms of bilateral exchange rate movements against major currencies, the euro depreciated slightly against the US dollar (-0.8%), as recent economic news has been more positive in the United States than in the euro area. Thus, the appreciation of the euro in nominal effective terms was supported by a strengthening vis-à-vis most other currencies. The euro strengthened against the Japanese yen (by 3.5%) and against the Chinese renminbi (0.8%) amid policy interventions by the Chinese authorities to counteract downward pressure on their currency linked to a deterioration in the growth outlook. The euro also appreciated against the Turkish lira (12.9%) over the review period, but it has stabilised in recent weeks amid rate increases by the Central Bank of the Republic of Türkiye.
Chart 20
Changes in the exchange rate of the euro vis-à-vis selected currencies
(percentage changes)

Source: ECB.
Notes: EER-41 is the nominal effective exchange rate of the euro against the currencies of 41 of the euro area’s most important trading partners. A positive (negative) change corresponds to an appreciation (depreciation) of the euro. All changes have been calculated using the foreign exchange rates prevailing on 13 September 2023.
5 Financing conditions and credit developments
The transmission of the ECB’s monetary policy tightening to broader financing conditions has continued to be strong. Banks’ funding costs continued to rise, reflecting further increases in deposit rates and the ongoing reduction in excess liquidity. In July 2023 bank lending rates also increased further, reaching their highest levels since 2008 for firms and since 2012 for households. Over the period from 15 June to 13 September 2023, both the costs for non-financial corporations (NFCs) of market-based debt financing and, more noticeably, of equity financing increased. Weakness in bank lending to firms and households continued in July amid higher lending rates, lower loan demand on the back of spending plan cuts and tighter credit standards, as well as solid retained earnings. By July, monetary aggregates were contracting at the fastest annual pace on record, driven by subdued credit growth and a reduction in the Eurosystem balance sheet.
Euro area bank funding costs continued to rise, reflecting further increases in deposit rates. The composite cost of debt financing for euro area banks rose further in July 2023, reaching its highest level in more than ten years (Chart 21, panel a). This increase principally reflects higher deposit rates, given that bank bond yields remained broadly stable, moving in line with risk-free rates at longer maturities (Chart 21, panel b).[12] Deposit rates continued to rise steadily, with some variation across instruments and sectors (i.e. deposit rates for firms were higher than for households). Depositors have been reacting to the widening spread between time and overnight deposit rates by shifting their overnight holdings to time deposits and other instruments with higher remuneration. The pass-through to deposit rates of increases in the key ECB interest rates has varied significantly across banks. This, in turn, has been accompanied by a redistribution of deposits between banks. Savers have moved deposits from banks offering less attractive remuneration to banks that have raised their deposit rates at a faster pace. Issuances of bank bonds that are remunerated above deposit rates and the key ECB interest rates have increased since September 2022, amid the winding-down of targeted longer-term refinancing operations (TLTROs) and the decline in overnight deposits. The ongoing phase-out of TLTROs, which also contributed to a reduction in excess liquidity in an environment of still ample liquidity, has led banks to increase their reliance on debt securities and money market instruments, as well as to compete more actively for deposits.
Chart 21
Composite bank funding rates in selected euro area countries
(annual percentages)
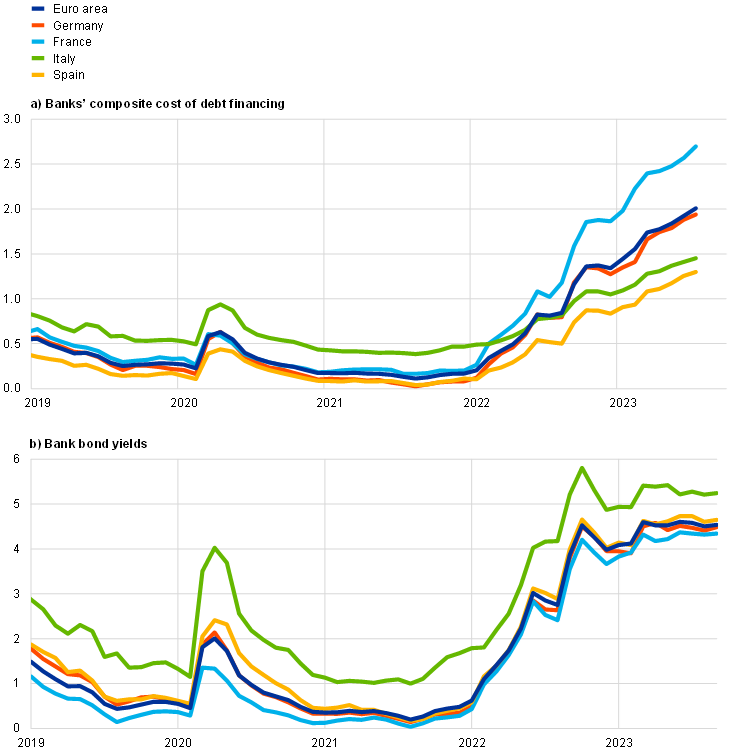
Sources: ECB, S&P Dow Jones Indices LLC and/or its affiliates and ECB calculations.
Notes: Composite bank funding rates are a weighted average of the composite cost of deposits and unsecured market-based debt financing. The composite cost of deposits is calculated as an average of new business rates on overnight deposits, deposits with an agreed maturity and deposits redeemable at notice, weighted by their respective outstanding amounts. Bank bond yields are monthly averages for senior-tranche bonds. The latest observations are for July 2023 for banks' composite cost of debt financing and 13 September 2023 for bank bond yields.
Bank balance sheets have been robust overall, despite a weakening economic environment. In the first few months of 2023, banks continued to increase their capitalisation in spite of larger payout commitments (see Box 7) and the latest stress test has confirmed the ability of euro area banks to cope with financial and economic shocks under an adverse scenario. A well-capitalised banking system is key to ensuring the sustainable provision of credit to the real economy under adequate conditions. Despite rising bank funding costs and lower lending volumes, bank profitability benefited from higher net interest rate margins in early 2023. In parallel, banks’ non-performing loan ratios increased marginally amid weaker economic prospects, while provisioning costs continued to be contained.
Lending rates have increased more rapidly than in previous hiking cycles, mainly reflecting the faster pace of policy rate hikes. ECB policy rates have risen substantially over a short period of time, namely by a total of 425 basis points between July 2022 and 13 September 2023. These higher ECB policy rates are being transmitted to bank lending conditions, with lending rates rising and credit standards tightening sharply. The increase in lending rates is stronger for firms than for households across both countries (Chart 22) and interest rate fixation periods. Bank rates on new loans to NFCs rose to 4.93% in July, their highest level since the end of 2008. This compares with 4.78% in June 2023 and 1.83% in June 2022, before the ECB started to raise its key interest rates. This increase in loan rates was widespread, with the largest rises being for loans with an interest rate fixation period of more than one year, with some heterogeneity across countries. The spread between bank rates on small and large loans for euro area firms increased somewhat in July (to 48 basis points), albeit, historically speaking, it has remained stable at low levels and with some variation across euro area countries. In July, bank rates on new loans to households for house purchase also rose, standing at 3.75% – their highest level since January 2012 – compared with 1.97% in June 2022 and 3.70% in June 2023. The increase in July was due to higher rates on fixed rate mortgages, and more particularly on flexible rate mortgages, with some differences across countries. The results of the July 2023 ECB Consumer Expectations Survey suggest that consumers expect mortgage rates to stabilise somewhat above the current levels over the next 12 months, possibly reflecting the advanced stage of the tightening cycle. A large net percentage of survey respondents perceived credit standards to be tight and expected housing loans to become harder to obtain over that same period.
Chart 22
Composite bank lending rates for NFCs and households in selected countries
(annual percentages; standard deviation)
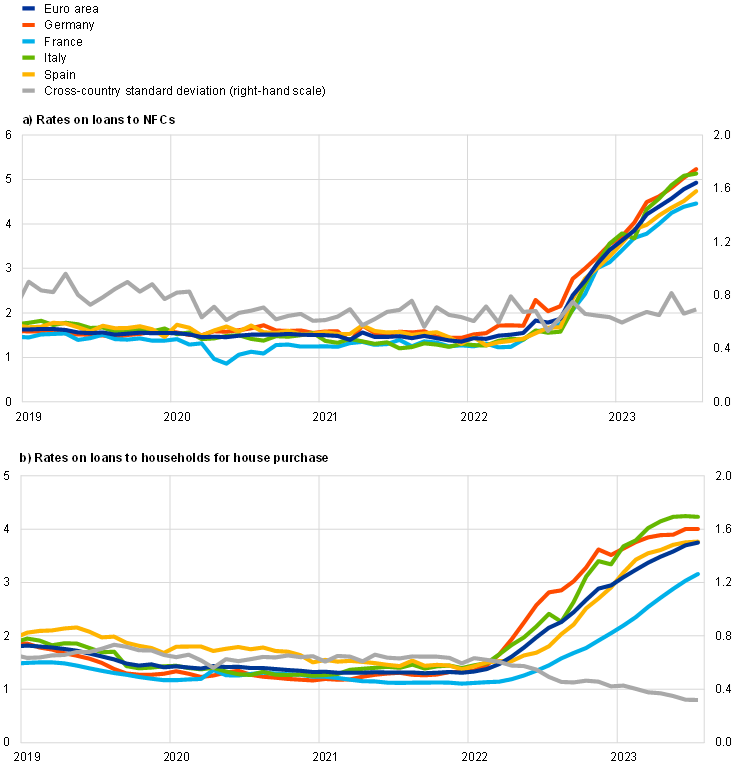
Source: ECB.
Notes: Composite bank lending rates for non-financial corporations (NFCs) are calculated by aggregating short and long-term rates using a 24-month moving average of new business volumes. The cross-country standard deviation is calculated using a fixed sample of 12 euro area countries. The latest observations are for July 2023.
From 15 June to 13 September 2023, the cost for NFCs of both market-based debt and, more significantly, equity financing increased. In July 2023, the overall cost of financing for NFCs – i.e. the composite cost of bank borrowing, market-based debt and equity – stood at 6.2%, that is to say, virtually unchanged from the previous month (Chart 23).[13] This was the result of the increase in the cost of both short-term and long-term borrowing from banks having been offset by a decline in the cost of equity and market-based debt financing over the period from the end of June to the end of July. As a result, the overall cost of financing in July remained close to the elevated levels reached in September 2022 and previously seen at the end of 2011.[14] Over the review period (i.e. until 13 September 2023), both the cost of market-based debt and the cost of equity rose. The increase in the cost of market-based debt was the result of higher risk-free rates and a slight widening of the spreads on bonds issued by non-financial firms in the high-yield segment (see Section 4). The increase in the risk-free rate (approximated by the ten-year overnight index swap rate), combined with the strengthening equity risk premium, led to the substantial rise in the cost of equity over the review period.
Chart 23
Nominal cost of external financing for euro area NFCs, broken down by component

Sources: ECB and ECB estimates, Eurostat, Dealogic, Merrill Lynch, Bloomberg and Thomson Reuters.
Notes: The overall cost of financing for non-financial corporations (NFCs) is based on monthly data and is calculated as a weighted average of the cost of borrowing from banks (monthly average data), market-based debt and equity (end-of-month data), based on their respective outstanding amounts. The latest observations are for 13 September 2023 for the cost of market-based debt and cost of equity (daily data) and July 2023 for the overall cost of financing and the cost of borrowing from banks (monthly data).
Bank lending to firms and households continued to be weak in July, amid higher lending rates, lower loan demand and tighter credit standards. The annual growth rate of loans to NFCs declined to 2.2% in July, down from 3.0% in June, and was still supported by base effects (Chart 24, panel a). The slowdown was experienced across the largest euro area economies, with some country heterogeneity, and reflected the strong decrease in loan demand, in part owing to higher borrowing rates and associated spending plan cuts, as well as to a further tightening of credit standards. Monthly flows of loans to NFCs have been close to zero since November 2022 and to households negative since May 2023. The annual growth rate of loans to households declined from 1.7% in June to 1.3% in July (Chart 24, panel b), amid negative housing market prospects, a further tightening of banks’ credit standards and higher lending rates. The decline was driven by all components, namely housing loans, consumer credit and loans to sole proprietors (i.e. unincorporated small businesses). The net monthly flows of lending to households were negative for the third month in a row, and, as a result, the short-term three-month annualised growth rate has now also declined to stand at -0.8%
– its lowest level since the start of the euro area.
Chart 24
MFI loans in selected euro area countries
(annual percentage changes; standard deviation)

Source: ECB.
Notes: Loans from monetary financial institutions (MFIs) are adjusted for loan sales and securitisation; in the case of non-financial corporations (NFCs), loans are also adjusted for notional cash pooling. The cross-country standard deviation is calculated using a fixed sample of 12 euro area countries. The latest observations are for July 2023.
The growth of net external financing of euro area firms decreased further in the second quarter of 2023 and nearly came to a halt in July, reflecting, among others, the lower financing needs of firms. The annual growth rate of net external financing declined from 1.8% in April 2023 to 0.3% in July (Chart 25). During this period, loan flows were close to zero, reflecting firms’ lower financing needs given faltering economic activity, solid retained earnings, ongoing rises in lending rates and tightening bank credit standards. The net issuance of debt securities also stagnated on the back of sustained gross issuance and redemptions of similar size. The net issuance of listed shares was subdued and became negative in May and June, reflecting one-off factors (e.g. one multinational company bought back shares and another large company was nationalised). More generally, activity in terms of initial public offerings and mergers and acquisitions has been low since 2022.
Chart 25
Net external financing flows for euro area NFCs
(monthly flows; EUR billions)

Sources: ECB, Eurostat, Dealogic and ECB calculations.
Notes: Net external financing for non-financial corporations (NFCs) is the sum of borrowing from banks (monetary financial institution (MFI) loans), net issuance of debt securities and net issuance of listed shares. MFI loans are adjusted for loan sales, securitisation and cash-pooling activities. The latest observations are for July 2023.
Overnight deposits contracted further in July, driven by the reallocation of funds to instruments with higher remuneration. After dropping by 9.2% year on year in June, the growth rate for overnight deposits fell further in July, bringing their annual growth rate down to -10.5%, the largest contraction seen since the start of Economic and Monetary Union (EMU) in 1999 (Chart 26). While interest rates are rising, the spread between time and overnight deposits has continued to widen, increasing the opportunity cost of holding liquid assets and driving the ongoing fund reallocation from overnight to time deposits. This reflects the fact that interest rates on overnight deposits have adjusted to policy rate changes more slowly than those on time deposits. This large spread provides a strong incentive for households and firms to shift their overnight and redeemable deposits to time deposits. The fact that the ECB’s policy tightening has been faster than in previous tightening cycles explains the extraordinary volumes being reallocated.
Chart 26
M3, M1 and overnight deposits
(annual growth rate, adjusted for seasonal and calendar effects)

Source: ECB.
Note: The latest observations are for July 2023.
By July 2023 monetary aggregates were contracting at the fastest annual pace on record, driven by subdued credit growth and the reduction in the Eurosystem balance sheet. Euro area narrow money (M1) growth contracted further, by 9.2% in July, after having fallen by 8.0% in June; this is the largest reduction by far in its entire history. Annual broad money (M3) growth in the euro area slipped into negative territory for the first time since February 2010, dropping from 0.6% in June to -0.4% in July (Chart 26) – its lowest rate since EMU began. This marked decline in the annual M3 growth rate resulted from a large monthly outflow and base effects. Persistent monthly outflows reflected several factors. First, the contribution to monetary dynamics of lending to households and firms has fallen to zero in recent months. Second, the discontinuation in July 2023 of reinvestments of principal payments from maturing securities under the asset purchase programme has led to a reduction in the Eurosystem’s asset portfolio, thereby draining liquidity from the financial system. In addition, the substitution in bank funding of long-term bonds for deposits has contributed to keeping M3 growth in negative territory. Monetary inflows from the rest of the world have, however, so far cushioned the negative impact of the other components to some extent. These inflows reflect foreign investors’ preference for euro area securities due to their relatively attractive yields and the current resilient confidence levels. Without this impetus from foreign investors, the monetary dynamics for the euro area would have slid even further into negative territory.
6 Fiscal developments
According to the September 2023 ECB staff macroeconomic projections, the euro area general government budget balance will improve moderately in 2023 and 2024 but deteriorate slightly in 2025. It is anticipated that the euro area fiscal stance will be broadly neutral in 2023 and tighten significantly in 2024, before turning broadly neutral again in 2025. Cumulatively over the projection horizon, there will be some tightening of fiscal policy. The ratio of euro area debt to GDP is projected to decline from 91% in 2022 to around 88% in 2025, but to remain well above pre-pandemic levels. As the energy shock fades, governments should continue to roll back the related support measures promptly and in a concerted manner to avoid driving up medium-term inflationary pressures, which would otherwise call for an even stronger monetary policy response. Fiscal policies should be designed to make the euro area economy more productive and to gradually bring down high public debt. In its opinion published on 5 July 2023, the ECB urged European Union (EU) legislators to come to an agreement on the reform of the EU’s economic governance framework as soon as possible, and at the latest by the end of 2023.
According to the September 2023 ECB staff macroeconomic projections, the euro area general government budget balance will improve moderately in 2023 and 2024 but deteriorate slightly in 2025.[15] Specifically, the euro area budget deficit is projected to decline to 3.2% of GDP in 2023 and 2.8% of GDP in 2024, before increasing to 2.9% of GDP in 2025 (Chart 27). The decline in the first part of the projection horizon is driven by expectations of a lower cyclically adjusted primary deficit, while the cyclical component is expected to remain broadly stable. Interest payments are projected to increase slightly over the projection horizon. The fall in the cyclically adjusted primary deficit is shaped by the scaling back of the fiscal support measures implemented by governments in response to the energy shock and high inflation. It is now estimated that at the euro area level these measures will amount to 1.4% of GDP in 2023, declining significantly to 0.4% of GDP in 2024 and to around 0.2% of GDP in 2025.
Chart 27
Budget balance and its components
(percentages of GDP)

Sources: ECB calculations and ECB staff macroeconomic projections for the euro area, September 2023.
Notes: NGEU stands for Next Generation EU. The data refer to the aggregate general government sector of all 20 euro area countries (including Croatia).
The euro area fiscal stance is projected to be broadly neutral in 2023 and to tighten significantly in 2024, before turning broadly neutral again in 2025.[16] The annual change in fiscal support, adjusted for grants extended to countries under the Next Generation EU (NGEU) programme, points to cumulative tightening of fiscal policies in the euro area over the forecast period. This tightening is anticipated to mainly take place in 2024, when around 75% of the energy and inflation-related fiscal support put in place by euro area governments is expected to be phased out. In 2025 the fiscal stance is expected to be neutral as the further unwinding of the energy measures is partly offset by higher investment, supported by the NGEU programme and increased defence spending. Meanwhile, the cumulative tightening of fiscal policies over the projection horizon is not driven by average public wages and pensions, which are projected to grow at rates higher than inflation in 2024 and 2025, while overall spending on these items grows at or above the nominal potential growth rate.
The ratio of euro area government debt to GDP is projected to remain above its pre-pandemic level, declining to 89% of GDP in 2023 and broadly stabilising in 2024 and 2025. The debt ratio increased by approximately 13 percentage points to around 97% in 2020. In 2023 it is expected to decline to around 89% of GDP, followed by marginal falls in 2024 and 2025. The developments in the latter two years also reflect expectations for a significant narrowing in the negative differentials between interest rates and nominal GDP growth compared with those observed between 2021 and 2023 (Chart 28). Additionally, primary deficits and positive deficit-debt adjustments are both expected to put upward pressure on the debt level. As a result, despite the decline of more than 3 percentage points between 2023 and 2025, the euro area aggregate debt ratio at the end of the horizon is expected to remain almost 5 percentage points above its pre-pandemic level.
Chart 28
Drivers of change in euro area government debt
(percentages of GDP, unless otherwise indicated)
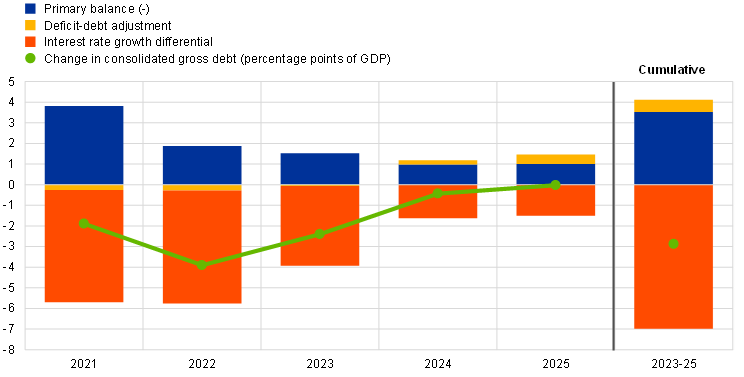
Sources: ECB calculations and ECB staff macroeconomic projections for the euro area, September 2023.
Note: The data refer to the aggregate general government sector of all 20 euro area countries (including Croatia).
The euro area budget balance for 2023 remains unchanged compared with the June 2023 Eurosystem staff macroeconomic projections but is now showing a moderately smaller improvement than previously expected in both 2024 and 2025. These downward revisions for 2024 and 2025 are mainly driven by projected changes in the primary balance resulting from higher than initially forecast primary expenditures, including higher spending on unemployment benefits as activity is expected to be weaker. In cyclically adjusted terms, revisions over the whole horizon are projected to be negligible.
As the energy shock fades, governments should roll back the related support measures promptly and in a concerted manner. This avoids driving up medium-term inflationary pressures, which would otherwise call for an even stronger monetary policy response. Fiscal policies should be designed to make the euro area economy more productive and to gradually bring down high public debt. This can best be achieved within a robust EU framework for economic and fiscal policy coordination and surveillance. As pointed out in its opinion published on 5 July 2023, the ECB welcomes the Commission’s proposals on the reform of the EU’s economic governance framework and offers some specific, technical observations and suggestions with a view to further enhancing the new framework and ensuring it becomes more transparent and predictable. Notably, the ECB urges EU legislators to come to an agreement on the reform of the economic governance framework as soon as possible, and at the latest by the end of 2023. As the general escape clause contained in the EU’s Stability and Growth Pact will have been deactivated by then, such an agreement will be critical in order to anchor expectations for debt sustainability and sustainable and inclusive growth. Failure to swiftly agree on and put in place a credible, transparent and predictable fiscal framework could create uncertainty and unduly delay the necessary fiscal adjustment and impetus for reforms and investment.
Boxes
1 Risks to global food commodity prices from El Niño
The almost certain arrival of an El Niño phenomenon towards the end of 2023 implies risks to global food commodity prices. In June, the US National Oceanic and Atmospheric Administration (NOAA) announced that El Niño conditions had arrived, with an El Niño episode likely to develop at the end of this year. An El Niño event is defined as taking place when the three-month rolling average of the ocean surface temperature in the East-Central tropical Pacific has stayed at least 0.5 degrees Celsius above the 30-year average for five consecutive, overlapping three-month periods in a row.[17] The latest weather forecast points to a 99% probability that an El Niño episode will emerge in the last quarter of 2023 and a 66% probability that it will be strong – with a temperature deviation of at least 1.0 degree Celsius above the 0.5-degree threshold defining an El Niño phenomenon (Chart A).[18] This year’s El Niño episode marks a departure from the previous three years, which were dominated by its colder counterpart, La Niña.[19] El Niño is likely to affect equatorial and global food supplies and prices as it affects weather developments around the globe. This box discusses the likely effects of the El Niño phenomenon on global food commodities and examines the risks to food commodity prices in case it develops into a strong El Niño. While the box focuses mainly on the impact of a strong El Niño, which might amplify the effects on food commodity prices next year, various studies show that the arrival of any El Niño conditions is likely to affect global food commodities, regardless of intensity.[20]
More2 What role do reopening effects play across countries and sectors?
This box analyses the recent dispersion of economic activity across countries and sectors and assesses the role that reopening effects have played following the lifting of coronavirus (COVID-19) restrictions last year. Output growth in the euro area has weakened significantly since the beginning of 2022. This has been accompanied by a declining, albeit persistent, dispersion of growth across countries and sectors. This persistent growth dispersion has reflected a two-speed economy, with relatively subdued growth in manufacturing, partly induced by weaker global demand and tighter euro area financing conditions, and relatively robust growth in services, supported by reopening effects. However, recent survey data suggest that this dispersion may narrow in the near future: while the impulse from reopening effects is weakening, the propagation of other forces across sectors is strengthening.
More3 The euro area labour force: recent developments and drivers
One notable recent development in the euro area labour market has been a strong rebound in the labour force. In particular, over the last year and a half, the main source of employment growth has been the strong inflow of people joining the labour force rather than a sharp decline in the number of unemployed. This box provides an overview of recent euro area labour force developments using data from Eurostat and the ECB Consumer Expectations Survey (CES). It also analyses the drivers of the euro area labour force using a mixed-frequency Bayesian vector autoregression (MF-BVAR) to disentangle the push and pull factors behind the labour force dynamics.[21]
More4 What do consumers think is the main driver of recent inflation?
Consumers’ perceptions of the factors driving inflation can be an important determinant of their economic behaviour and their inflation expectations. In general, individual beliefs driven by prevailing narratives have an impact on both actions and expectations.[22] One such narrative that can impact economic behaviour is beliefs about the sources of inflation. The question of what is mainly behind rising prices has become more acute of late.[23] This matters, as it can affect consumer expectations about future inflation and their actual behaviour.[24] Against this backdrop, in June 2023 the ECB’s Consumer Expectations Survey asked consumers what they believed was the main factor driving changes in the general level of prices for goods and services in their country over the past 12 months.[25] They were offered three possible answers, reflecting the three main accounting factors that can drive pricing from the corporate side (profits, wages and other input costs).[26]
More5 Climate change and euro area firms’ green investment and financing ‒ results from the SAFE
This box examines how euro area firms perceive climate change risks as well as their investment plans and financing needs to mitigate the impacts of climate change. Between 25 May and 26 June 2023 the European Central Bank (ECB) conducted a pilot round of the Survey on the Access to Finance of Enterprises (SAFE), which for the first time included specific questions related to the impact of climate change on euro area firms.[27] Specifically, firms were asked about: i) the importance they attach to the consequences of physical and transition risks, ii) their investment behaviour to mitigate risks or reduce the negative environmental impact of their economic activities; iii) different financing sources chosen to fund climate change-related investments and iv) potential impediments to the necessary financing.
More6 Liquidity conditions and monetary policy operations from 10 May to 1 August 2023
This box describes liquidity conditions and the Eurosystem’s monetary policy operations during the third and fourth reserve maintenance periods of 2023. Together, these two maintenance periods ran from 10 May to 1 August 2023 (the “review period”).
More7 Banks’ capital distributions and implications for monetary policy
Banks distribute capital to equity investors by either paying dividends or buying back shares, with ambiguous implications for the transmission of monetary policy via banks. On one hand, capital distributions can be beneficial for monetary transmission in the long run by making banks attractive to investors. First, a capital distribution signals managers’ confidence in their bank’s expected stream of profits or an assessment that the bank’s current stock price is undervalued. Second, dividend distributions enable investors to increase control of the cash generated by the bank and benefit from the accompanying payouts, rather than keeping it fully at the disposal of management. Through these two channels, capital distribution can signal the soundness of a bank to equity investors. This feeds into a lower cost of equity for the bank, making it easier for it to tap financial markets. Ultimately, a lower cost of equity can support banks’ financial health, preserving their ability to smoothly transmit monetary policy. On the other hand, capital distributions lower banks’ capital ratios, all other factors being equal. These distributions could be a manifestation of past or future economic weakness, as banks may distribute capital that they did not have the opportunity, and do not anticipate the need, to deploy to satisfy loan demand for investments. Distributions would then be consistent with the transmission of monetary policy tightening. Moreover, the reduced intermediation capacity would also feed into the bank-based transmission of the tightening of monetary policy, as lower capital buffers would help to tighten credit conditions. However, in particular during times of uncertainty, excessive or ill-timed payouts can amplify stress and hamper the smooth transmission of monetary policy in a situation where the financial system has been hit by a shock.[28] In some circumstances, this may make the financial system more prone to the risk of financial instability. Banks should therefore follow prudent payout policies.
More8 The fiscal impact of financial sector support measures 15 years after the great financial crisis
During and after the global financial crisis, most euro area governments provided support to individual financial institutions to safeguard financial stability.[29] Interventions included measures such as injecting capital, nationalising banks, taking over impaired assets through public financial defeasance structures (also known as “bad banks”) and providing loans. This box looks at the direct impact of the assistance on euro area public finances, which is still visible 15 years later. The impact on public finances can be summarised as follows:
- Where these operations showed a clear loss for the government, they are classified as capital transfers that increase the budget deficit.
- Where the government received shares in a bank or debt securities considered of equal value to the capital injection provided, the support measure is considered a financial transaction that affects general government gross debt, but not the deficit.
- Where the government also issued guarantees to support the financial sector, these represent contingent liabilities that only affect public finances should they be called on.
Articles
1 The euro area current account after the pandemic and energy shock
In 2022 the euro area current account balance recorded a deficit of 0.8% of euro area GDP compared with a surplus of 2.8% in 2021 – a deterioration of 3.6 percentage points.[30] This constituted the biggest annual change in the euro area current account balance on record as the terms-of-trade shock from rising energy prices following Russia’s invasion of Ukraine triggered a substantial worsening of the euro area trade balance.[31] Since the introduction of the euro in 1999, the euro area current account balance has been through several distinct phases. After being in deficit in the early 2000s, it maintained a roughly balanced position until the global financial crisis, when it sharply deteriorated to reach a historically high deficit of close to 2% of GDP in 2008. Following a period of consolidation, the euro area current account balance then recorded sustained surpluses between 2013 and 2019, before exhibiting some pandemic-induced volatility already in 2020 and 2021.[32]
More2 How climate change affects potential output
Climate change and the actions taken to tackle it will profoundly change economic activity in the coming decades. Eliminating carbon emissions requires changes to how people consume and how businesses produce. Without sufficient progress in reducing emissions, average temperatures will increase, sea levels will rise, and climate extremes will become more frequent and more powerful.[33]
More3 SESFOD@10 – credit terms and conditions in euro-denominated securities financing and over-the-counter derivatives markets since 2013
Credit terms and conditions are an essential component of financing conditions and central to determining market participants’ risk appetite. Financing conditions affect market participants’ investment decisions. Looser credit terms and conditions may favour the build-up of leverage and increased risk-taking in the financial system. Building on the lessons from the global financial crisis, the ECB has been running the three-monthly survey on credit terms and conditions in euro-denominated securities financing and over-the-counter derivatives markets (SESFOD) since March 2013.[34]
MoreStatistics
https://www.ecb.europa.eu/pub/pdf/ecbu/ecb.eb_annex202306~3327012e3e.en.pdf© European Central Bank, 2023
Postal address 60640 Frankfurt am Main, Germany
Telephone +49 69 1344 0
Website www.ecb.europa.eu
All rights reserved. Reproduction for educational and non-commercial purposes is permitted provided that the source is acknowledged.
This Bulletin was produced under the responsibility of the Executive Board of the ECB. Translations are prepared and published by the national central banks.
The cut-off date for the statistics included in this issue was 13 September 2023.
PDF ISSN 2363-3417, QB-BP-23-006-EN-N
HTML ISSN 2363-3417, QB-BP-23-006-EN-Q
The cut-off date for the statistics included in this issue was 13 September 2023. According to the final release on 19 September 2023, HICP inflation declined to 5.2% in August 2023 from 5.3% in July; this outcome was 0.1 percentage points below the flash release.
Given the focus of this section on developments in the global environment, all references to world and/or global aggregate economic indicators exclude the euro area.
In early September, Chinese authorities announced further support for the property market, including cutting interest rates on existing mortgages and reducing down payments. While these measures were announced after the cut-off date for the projections, it is still too early to see whether they will be sufficient to halt the projected decline in the property sector for the rest of 2023.
For an analysis of reopening effects and the dispersion of economic activity across countries and sectors, see the box entitled “What role do reopening effects play across countries and sectors?” in this issue of the Economic Bulletin.
For an analysis of the recent developments in the labour force and its drivers see the box entitled “The euro area labour force: recent developments and drivers” in this issue of the Economic Bulletin.
See also the box entitled “What role do reopening effects play across countries and sectors?”, op. cit.
The headline figure grew by 0.7% quarter on quarter in Q2, after contracting by 0.2% in Q1, reflecting strong inter-quarter volatility in Irish IPP data. For more on the longer-term impact of this volatility, see the box entitled “Intangible assets of multinational enterprises in Ireland and their impact on euro area GDP”, Economic Bulletin, Issue 4, ECB, 2023.
Of the six euro area countries reporting an acceleration in the second quarter, only France did so without improving merely on a contraction in the first quarter.
For more details on the methodology of earnings calls data, see the box entitled “Earnings calls: new evidence on corporate profits, investment and financing conditions”, Economic Bulletin, Issue 4, ECB, 2023. On the impact of climate change on investment, see also the box entitled “Climate change and euro area firms' green investment and financing – results from a euro area survey” in this issue of the Economic Bulletin.
The July BLS anticipated further declines in firms’ demand for long-term loans for fixed investment into Q3-Q4 2023, while the latest euro area projections anticipate stronger dampening effects on business investment from higher interest rates and associated credit supply restrictions (see “ECB staff macroeconomic projections for the euro area”, published on the ECB’s website on 14 September 2023).
In Eurostat’s final release, the headline inflation rate for August was revised down to 5.2% after the cut-off date.
If the increase in the cost of interbank borrowing had also been included in the composite bank funding costs calculation, funding costs as a whole would have risen even more steeply since the hiking cycle began – albeit starting from a lower level.
Owing to lags in the data available on the cost of borrowing from banks, data on the overall cost of financing for NFCs are only available up to July 2023.
See Box 5 in this issue of the Economic Bulletin for the implications of the cost of financing on euro area firms’ investments to mitigate natural hazard risks or to comply with stricter climate standards.
See “ECB staff macroeconomic projections for the euro area, September 2023”, published on the ECB’s website on 14 September 2023.
The fiscal stance reflects the direction and size of the stimulus from fiscal policies to the economy beyond the automatic reaction of public finances to the business cycle. It is measured here as the change in the cyclically adjusted primary balance ratio net of government support to the financial sector. Given that the higher budget revenues related to NGEU grants from the EU budget do not have a contractionary impact on demand, in this context, the cyclically adjusted primary balance is adjusted to exclude those revenues. For more details on the euro area fiscal stance, see the article entitled “The euro area fiscal stance”, Economic Bulletin, Issue 4, ECB, 2016.
Following the NOAA definition, El Niño is the warm phase of the oscillation in the equatorial Pacific Ocean (also called El Niño–Southern Oscillation). In the neutral phase of the oscillation, trade winds, which are the permanent winds that blow from east to west around the equator, push warm water from South America to Asia, where it evaporates more easily. This generates the upwelling process, which is when deep, cold water rises to the ocean surface to replace warm water. During El Niño, trade winds slow down and warm water is pushed back towards South America, which causes the upwelling process to weaken or even stop.
Historically, strong episodes have accounted for 8 out of the 23 El Niño episodes since 1950.
The definition of La Niña is similar to the El Niño definition, but with negative anomalies in ocean surface temperatures. A La Niña phase is generated by trade winds that are stronger than usual, which amplifies the upwelling process.
This box focuses on international food commodity prices and not on euro area consumer food prices, where the effects are expected to be smaller. Peersman (2022) shows that changes in international food commodity prices explain almost 30% of volatility in euro area inflation over the medium term. See Peersman, G., “International Food Commodity Prices and Missing (Dis)Inflation in the Euro Area”, The Review of Economics and Statistics, Vol. 104, No 1, 2022, pp. 85-100. Subsidies granted to domestic producers through the EU’s Common Agricultural Policy partially mitigate the effects of changes in international food commodity prices on euro area consumer food prices. See, for example, Ferrucci, G., Jiménez-Rodríguez, R. and Onorante, L., “Food Price Pass-Through in the Euro Area: Non-linearities and the Role of the Common Agricultural Policy”, International Journal of Central Banking, Vol. 8, No 1, 2012, pp. 179-217.
In addition to the analysis of labour force developments, a comprehensive analysis of the implications of employment growth for labour market tightness and wage growth needs to consider sectoral dimensions of the labour market and the contribution from average hours worked (intensive margin). See, for example, “More jobs but fewer working hours”, ECB Blog, 7 June 2023, on the differences between employment and total hours worked and the important role average hours worked played during the pandemic and the energy crisis. See also “The role of public employment during the COVID-19 crisis”, Economic Bulletin, Issue 6, ECB, 2022.
For how narratives drive events and behaviour, see, for example, Shiller, R.J., Narrative Economics: How Stories Go Viral and Drive Major Economic Events, Princeton University Press, 2019.
See Lagarde, C., “Breaking the persistence of inflation”, speech at the ECB Forum on Central Banking 2023 on “Macroeconomic stabilisation in a volatile inflation environment” in Sintra, Portugal, 27 June 2023; Bernanke, B. and Blanchard, C., “What Caused the U.S. Pandemic-Era Inflation?”, paper prepared for the “The Fed: Lessons learned from the past three years” conference at the Hutchins Center on Fiscal & Monetary Policy at the Hutchins Institution, 23 May 2023; Hansen, N.-J., Toscani, F. and Zhou, J., “Europe’s Inflation Outlook Depends on How Corporate Profits Absorb Wage Gains”, IMF Blog, International Monetary Fund, 26 June 2023.
If, for example, consumers believe that inflation is due to higher input costs (e.g. energy and raw material prices), they likely hold a more transitory view of inflation. This may lead inflation expectations to converge more quickly on the target. At the same time, if they believe that wages or profits are the main driver of inflation, this might imply more persistent and de-anchored future inflation expectations. Additionally, when consumers perceive that high prices are due to input costs for firms, they might be more willing to pay higher prices than if they think that firms’ profits are the main driver.
The question reads: “According to your view, what is the main factor driving the change in the general level of prices for goods and services in your country during the past 12 months”. The options were: “1. The main driver is firms’ profits”, “2. The main driver is wage costs for firms”, “3. The main driver is other input costs for firms (e.g. energy, raw material or other business costs)”. The sample included the six largest euro area economies (Belgium, Germany, Spain, France, Italy and the Netherlands) and consists of 10,308 responses across all countries (Belgium: 845, Germany: 1,797, Spain: 2,268, France: 2,264, Italy: 2,267, the Netherlands: 867).
Owing to the possibility of order effects, which could result in respondents favouring the first or last option, the ordering of the options was randomised for the more than 10,000 respondents. While the ordering of the options had a statistically significant impact on the responses, it was economically small and had no meaningful impact on the aggregate averages or rankings across the three options.
The aim of this SAFE pilot round was to assess several changes that are foreseen for the survey, namely (i) increasing the frequency of the survey from semi-annual to quarterly to provide more timely information on the financing conditions of firms, (ii) including new quantitative forward-looking questions on key economic variables and (iii) allowing for new ad-hoc questions. The results of this pilot round have not to date been published on the ECB website. The publication is envisaged after the completion of the quality assessment of the replies. The SAFE pilot round included a smaller sample of euro area firms compared with the regular survey. The sample was chosen using a stratified random sampling by country, size classes and economic activity to keep it representative of the population of euro area firms. The total sample size was 5,733 firms, of which 5,233 (91%) were SMEs (with fewer than 250 employees). The pilot survey covers firms in Austria, Belgium, Finland, France, Germany, Greece, Ireland, Italy, Netherlands, Portugal, Slovakia and Spain.
For instance, share buybacks could be the result of chief executive officers’ remuneration being tied to the share price. A capital distribution not driven by fundamentals could deplete bank intermediation capacity.
For a description of the financial crisis and fiscal and financial measures taken, see “Euro area fiscal policies and the crisis”, Occasional Paper Series, No 109, ECB, Frankfurt am Main, April 2010, and “Extraordinary measures in extraordinary times – public measures in support of the financial sector in the EU and the United States”, Occasional Paper Series, No 117, ECB, Frankfurt am Main, July 2010.
For more information on the statistical classification of support measures and their impact on public finances, see the article entitled “The fiscal impact of financial sector support during the crisis”, Economic Bulletin, Issue 6, ECB, 2015; “Financial assistance measures in the euro area from 2008 to 2013: statistical framework and fiscal impact”, Statistics Paper Series, No 7, ECB, Frankfurt am Main, April 2015; and the box entitled “The fiscal impact of financial sector support measures: where do we stand a decade on from the financial crisis?”, Economic Bulletin, Issue 6, ECB, 2018. The national accounts rules applicable to the statistical recording of support for financial institutions have been revised over time. As a consequence, the historical impact of the public interventions have sometimes changed significantly compared with these previous publications. Since Eurostat’s first decision on the statistical recording of public interventions to support financial institutions in 2009, the rules have been further revised until very recently (see the updated chapter 4.5 “Government intervention to support financial institutions: financial bailouts and defeasance structures” in the newly released 2022 edition of the Manual on Government Deficit and Debt).The evolution of the euro area current account balance is closely linked to economic developments abroad. It measures transactions between euro area residents and non-euro area residents. It consists of the balance of trade in goods and services, net income from abroad recorded as primary income (such as interest and dividends) and net transfers recorded as secondary income (such as remittances and transfers related to the EU budget).
The terms of trade measures export prices relative to import prices.
See “Developments in the euro area current account during the pandemic”, Economic Bulletin, Issue 4, ECB, 2021.
See Intergovernmental Panel on Climate Change, “Climate Change 2022: Impacts, Adaptation and Vulnerability, Summary for Policymakers”, Cambridge University Press, Cambridge and New York, 2022.
See the special feature entitled “New ECB Survey on Credit Terms and Conditions in Euro-denominated Securities Financing and Over-the-Counter Derivatives Markets (SESFOD)”, Financial Stability Review, ECB, May 2013.