


- 17 OCTOBER 2023 · RESEARCH BULLETIN NO 112
Forecasting euro area inflation with machine learning models
Inflation forecasts and their risks are central to monetary policy decisions. The strategy review concluded in 2021[2] highlighted that most Eurosystem models used to forecast inflation are linear. Linear models assume that changes in, for example, wages, always have the same fixed, proportional effect on inflation. A new machine learning model, recently developed at the ECB, captures very general forms of non-linearity, such as changes in the sensitivity of inflation dynamics to the prevailing economic circumstances. Forecasts from this machine learning model closely track Eurosystem staff inflation projections, suggesting that these projections capture mild non-linearity in inflation dynamics – likely owing to expert judgement – and are in line with state-of-the-art econometric methodologies.
Inflation forecasting
There are considerable lags in the effects of monetary policy on the economy (see, for example, Christiano et al. 1999; Giannone et al., 2019; Jarociński and Karadi, 2020; and Schnabel, 2023). That is why the mandate of the European Central Bank (ECB) is to maintain price stability over the medium term. The medium-term orientation implies that sources of fluctuations that only temporarily affect inflation can potentially be ignored. In contrast, more persistent driving forces may have an impact on monetary policy decisions. Inflation forecasts identify which effects are persistent and are therefore a key input for these decisions.
Economic forecasts are surrounded by uncertainty and, rather than relying on precise “point forecasts”, policy decisions hinge on “density forecasts”. These capture the likelihood of different potential future “risk” scenarios.[3] Modelling inflation dynamics in the euro area is challenging, owing to the many potential drivers and the difficulty in capturing their relationship with inflation dynamics (see, for example, Koester et al., 2021). One key point is whether inflation dynamics are well characterised by linear relationships with their many potential determinants. The assumption of linearity means that a change in an inflation determinant, such as wages, always implies a change in inflation in the same fixed proportion to the change in wages – regardless of the economic conditions prevailing at the time.
The Eurosystem modelling toolbox consists mostly of linear models, as highlighted in the description of the economic analysis provided in the context of the strategy review (see Darracq Pariès et al., 2021). However, economic theory argues that inflation dynamics are characterised by non-linearity.[4] For example, in response to large shocks firms may change their prices much faster and by proportionately larger amounts than they would in response to smaller shocks (see, for example, Cavallo et al., 2023).
Using machine learning for density forecasting
In Lenza, Moutachaker, and Paredes (2023), we describe a forecasting model for headline and core inflation[5] that captures potentially very general forms of non-linear inflation dynamics. The model is borrowed from the machine learning literature and is called the Quantile Regression Forest (QRF – Meinshausen, 2006), which is a variant of the popular Random Forest of Breiman (2001).[6] Given its success at forecasting macroeconomic variables,[7] this methodology is gaining ground in the applied economics literature and has also attracted the interest of policymakers. For the potential determinants of inflation, we chose a set of 60 variables, covering a range of measures of inflation expectations, cost pressures, real activity and financial variables.
How do our forecasts compare with those from a linear model?[8] We find that for core inflation, the non-linear model is generally more accurate than the linear model, though only by a small margin. For headline inflation, the non-linear model is better able to capture the prolonged period of low inflation before and during the coronavirus (COVID-19) pandemic – but it is outperformed by the linear model during the Great Recession and its aftermath. We conclude that euro area core inflation dynamics can be characterised by mild non-linearity, while the evidence for non-linearity in headline inflation dynamics is less compelling. This suggests that the dynamics in the energy and food components of consumer prices, which are part of headline inflation but not core inflation, are broadly linear. Consequently, especially during periods of high commodity price volatility, the energy and food components of headline inflation tend to overshadow the mild non-linearity observed in core inflation.
Our model allows us to break forecasts down into the marginal contributions of the different variables.[9] Such contributions are not meant to capture economic causality. They can however help both to identify the variables from which our model extracts the signal for the inflation outlook and to draw comparisons with other macroeconomic models. In addition, the way contributions of a specific variable evolve over the full sample may indicate the type of relationship between inflation and that variable, and help us spot potential non-linear patterns. Chart 1 shows the contributions to inflation of four variables in our set that turned out to be particularly relevant for headline and core inflation.
Chart 1
Contributions of different variables to headline and core inflation
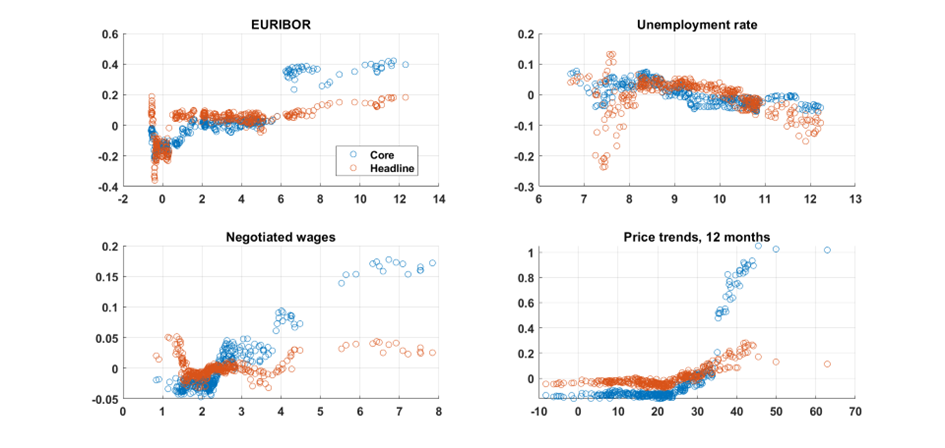
Notes: Vertical axis: in-sample contribution to the deviation from the mean of the variable specified in the title of each panel for headline inflation (red) and core inflation (blue). The values are expressed in terms of percentage points. Horizontal axis: value of the variable specified in the title of each panel.
For three of these variables, the relationship with inflation seems roughly linear. The EURIBOR (the euro interbank offered rate) is often used as a proxy for the ECB’s monetary policy stance. Its relationship with inflation reflects the systematic reaction of monetary policy to inflation; it is essentially linear. The only non-linearity seems to relate to the effective lower bound of nominal interest rates. The chart showing the unemployment rate suggests the existence of a generally linear (Phillips curve-type) relationship, with a slight negative slope. And finally, the relationship between wages and inflation also appears roughly linear. However, for the measure of inflation expectations reported in the chart, i.e. “price trends expected over the next 12 months”,[10] the relationship with headline and especially core inflation is clearly non-linear. Specifically, the chart suggests that, beyond a certain threshold in the share of survey respondents who expect higher inflation, inflation markedly accelerates.
How do the predictions of the non-linear model compare with forecasts that incorporate expert judgement, namely those from the ECB Survey of Professional Forecasters (SPF) and the Eurosystem staff inflation projections? We find that the SPF forecasts one year ahead are more accurate than those from the non-linear model, while for shorter horizons the non-linear model is more accurate. Comparing the non-linear model with the Eurosystem staff projections, we find that the two sets of forecasts are very similar and display similar patterns of non-linearity. Chart 2 reports the density forecasts for headline inflation six months ahead from the non-linear model, together with the Eurosystem staff projections and observed inflation for the period 2002-22. The striking similarity, highlighted in the chart, also implies that both sets of forecasts exhibit a similar deviation from the forecasts of the linear model mentioned above. Given the vast prevalence of linear models in the Eurosystem forecasting toolbox observed in Darracq Pariès et al. (2021), this finding suggests that the so-called expert judgement component of the Eurosystem staff inflation forecasts may help embed mild non-linearity in the inflation projections.
Chart 2
Headline inflation and forecasts
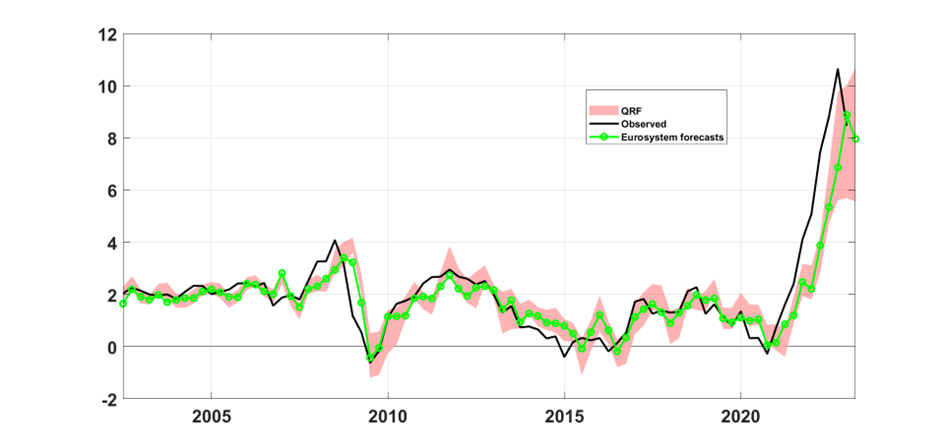
Note: Black solid line: year-on-year growth rate of the HICP (headline inflation); red area: 16th to 84th quantiles of the density forecasts from the non-linear model (QRF), with a horizon of six months ahead, for the year-on-year growth rate of the HICP; green line with circles: Eurosystem inflation projections, with a horizon of six months ahead, for the year-on-year growth rate of the HICP.
Conclusions
A state-of the-art machine learning model, the Quantile Regression Forest, is a valid addition to the Eurosystem projection toolbox. It is roughly comparable in accuracy to the linear models currently making up the bulk of the Eurosystem inflation forecasting toolbox. Accordingly, this new methodology should be seen as a complement to, rather than a substitute for, existing techniques. In addition, the assumption of linearity characterising most models in central banks’ toolboxes does not appear to be too wide of the mark. Our findings also show that the Eurosystem staff projections are in line with state-of-the-art econometric methodologies.
References
Breiman, L. (2001), “Random Forests”, Machine Learning, Vol. 45, pp. 5-32.
Cavallo, A., Lippi, F. and Miyahara, K. (2023), “Large Shocks Travel Fast”, NBER Working Paper, No 31659.
Christiano, L. J., Eichenbaum, M. and Evans, C. L. (1999), “Monetary Policy Shocks: What Have We Learned and to What End?”, in Taylor, J. B. and Woodford, M. (eds.), Handbook of Macroeconomics, Vol. 1, Chapter 2, pp. 65-148, Elsevier.
Clark, T. E., Huber, F., Koop, G., Marcellino, M. and Pfarrhofer, M. (2023), “Tail Forecasting with Multivariate Bayesian Additive Regression Trees”, International Economic Review, Vol. 64(3), pp. 979-1022.
Darracq Pariès, M., Notarpietro, A., Kilponen, J., Papadopoulou, N., Zimic, S., Aldama, P., Langenus, G., Alvarez, L. J., Lemoine, M. and Angelini, E. (2021), “Review of Macroeconomic Modelling in the Eurosystem: Current Practices and Scope for Improvement”, Occasional Paper Series, No 267, ECB.
Giannone, D., Lenza, M. and Reichlin, L. (2019), “Money, Credit, Monetary Policy, and the Business Cycle in the Euro Area: What Has Changed Since the Crisis?”, International Journal of Central Banking, Vol. 15(5), pp. 137-173, December.
Goodhart, C. (2023), “Should Central Banks abandon single point forecasts?”, VoxEU 29 August 2023, https://cepr.org/voxeu/columns/should-central-banks-abandon-single-point-forecasts.
Jarociński, M. and Karadi, P. (2020), “Deconstructing Monetary Policy Surprises – The Role of Information Shocks”, American Economic Journal: Macroeconomics, Vol. 12(2), pp. 1-43, April.
Koester, G., Lis, E., Nickel, C., Osbat, C. and Smets, F. (2021), “Understanding Low Inflation in the Euro Area from 2013 to 2019: Cyclical and Structural Drivers”, Occasional Paper Series, No 280, ECB.
Lenza, M., Moutachaker, I. and Paredes, J. (2023), “Density Forecasts of Inflation: A Quantile Regression Forest Approach”, Working Paper Series, No 2830, ECB.
Medeiros, M. C., Vasconcelos, G. F., Veiga, A. and Zilberman, E. (2021), “Forecasting Inflation in a Data-Rich Environment: The Benefits of Machine Learning Methods”, Journal of Business and Economic Statistics, Vol. 39, pp. 98-119.
Meinshausen, N. (2006), “Quantile Regression Forests”, Journal of Machine Learning Research, Vol. 7, pp. 983-999.
Schnabel, I. (2023), “The risks of stubborn inflation”, speech at the Euro50 Group conference on “New challenges for the Economic and Monetary Union in the post-crisis environment”.
This article was written by Michele Lenza (Head of Section, Directorate General Research, European Central Bank), Inés Moutachaker (INSEE) and Joan Paredes (Senior Economist, Directorate General Economics, European Central Bank). It is based on the paper entitled “Density forecasts of inflation: a quantile regression forest approach” by the same authors. The authors would like to thank Gareth Budden, Alexandra Buist, Michael Ehrmann, Alex Popov and Zoë Sprokel for their comments. The views expressed here are those of the authors and do not necessarily represent the views of the European Central Bank and the Eurosystem.
See also Goodhart (2023) on the desirability of abandoning point forecasts from a central bank perspective.
See Costain et al. (2022) for a survey and a specific theory supporting non-linear dynamics of inflation.
Headline and core inflation are proxied respectively by the growth rate of the Harmonised Index of Consumer Prices (HICP) and of the HICP excluding energy and food prices.
The Forests are ensemble models, meaning that their output is derived by combining the output of several different non-linear individual models, called regression trees. For example, the predictions of the Random Forest are derived by taking a simple average of the predictions of several regression trees
See, for example, Medeiros et al. (2021) and Clark et al. (2023).
The linear model is a combination of several vector autoregressive models, estimated by means of Bayesian techniques.
The forecast contributions we compute are called Shapley values.
The measure of expectations is defined in terms of a balance of survey respondents. A positive number indicates that a larger share of respondents expect an increase in prices rather than a decrease.