

- SPEECH
Getting disinflation right
Speech by Fabio Panetta, Member of the Executive Board of the ECB, at Bocconi University
Milan, 3 August 2023
In recent years, the euro area has seen multiple supply shocks hitting the economy at the same time. These shocks have combined to create an inflationary shock of such magnitude and persistence that inflation risked becoming entrenched.
These adverse developments coincided with a phase of highly accommodative monetary policy, following a long period of fighting too-low inflation and the risks to price stability associated with the pandemic shock. To avoid exacerbating inflationary pressures by stimulating demand and to prevent the de-anchoring of inflation expectations, we rapidly normalised our monetary policy stance. We increased rates by a total of 425 basis points in the space of just 12 months.
In parallel, the end of net asset purchases and reinvestments under the asset purchase programme (APP), coupled with the repayment of our targeted longer-term refinancing operations, is making our balance sheet shrink considerably.
With policy rates now firmly in restrictive territory, setting and communicating the direction of monetary policy has become more complex. Our monetary policy stance needs to be calibrated in a way that brings inflation back to target in a timely manner while avoiding unnecessary harm to economic activity.
This is a fine line to walk, as the effects of monetary policy emerge with a lag. While our past decisions have already led to a material tightening in credit conditions and loan dynamics, their effects have yet to be felt in full across the real economy.
At the same time, inflation remains elevated. Even if it is now falling as the effects of adverse supply shocks begin to fade and weaker growth eases price pressures, it will still take some time to reach levels compatible with price stability.
In order to successfully complete the disinflation of the European economy, we need to flexibly adapt our policy to the evolving inflation outlook. In the current context where policy rates are around the level necessary to deliver medium-term price stability, I will argue that monetary policy may operate not just by increasing rates but also by keeping the prevailing level of policy rates for longer. In other words, persistence matters as much as level.
This raises challenges for steering our policy stance. I will argue that our data-dependent approach, underpinned by our firm commitment to returning inflation to its target, is equipped to navigate these intricacies.
The transmission of inflation through the economy
Euro area inflation is largely due to a series of adverse supply shocks, notably the pandemic-induced supply chain disruptions and the energy shock triggered by Russia’s invasion of Ukraine.[1]
In 2022, energy prices were the main driver of inflation (Chart 1).[2] The energy shock translated into broad-based price pressures given the impact of rising energy prices on all components of inflation.
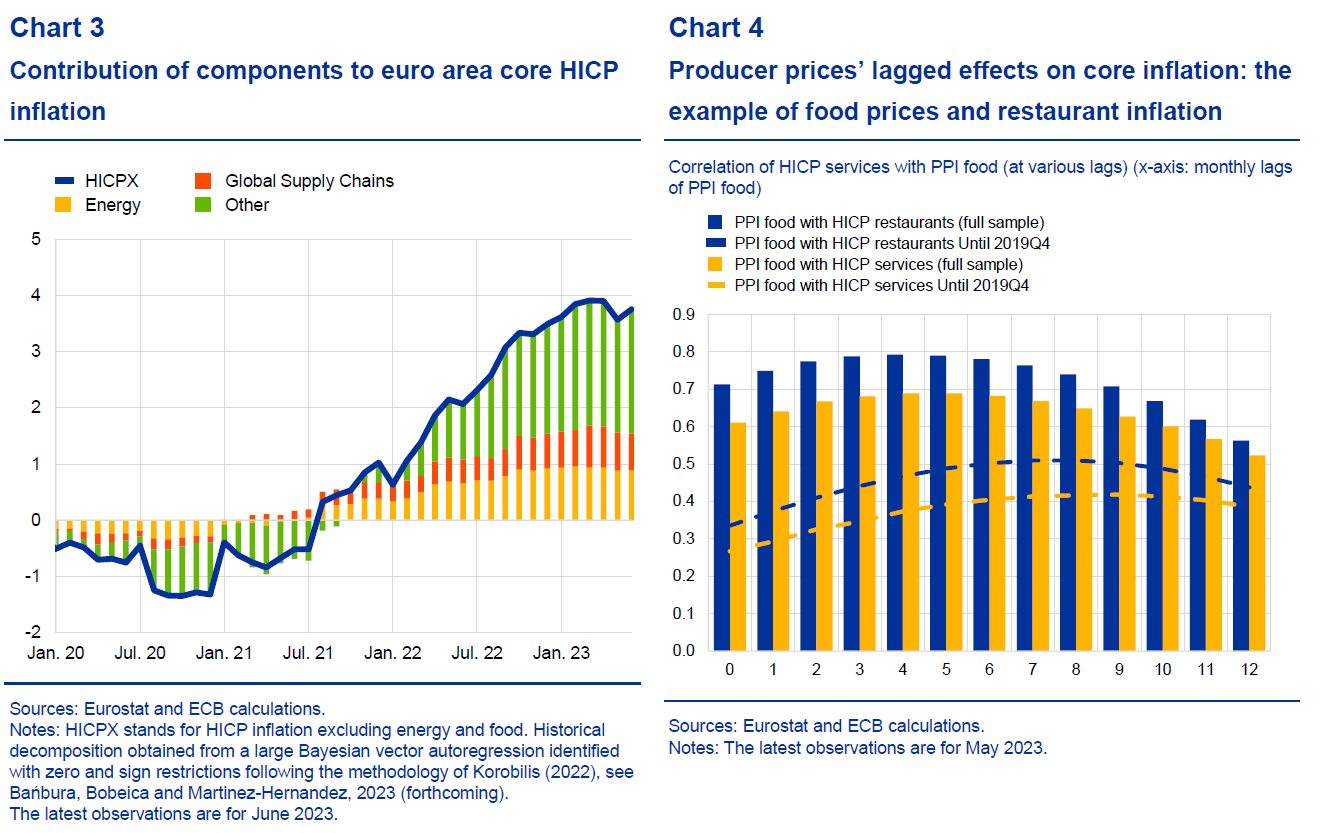
Chart 1
Contribution of components to euro area headline HICP inflation
(annual percentage changes; percentage points contributions)

Sources: Eurostat and ECB staff calculations.
Notes: HICP stands for Harmonised Index of Consumer Prices. NEIG stands for non-energy industrial goods. The latest observations are for June 2023.
Headline inflation across euro area countries lacks a clear correlation with the strength of domestic demand (Chart 2).
Chart 2
HICP in euro area countries vs. contribution of domestic demand to GDP growth
(y-axis: HICP annual percentage changes; x-axis: average contribution of domestic demand (excluding inventories) to GDP growth quarter on quarter for the fourth quarter of 2022 and the first quarter of 2023 in percentage points)

Sources: Eurostat and ECB calculations.
Notes: The observations for HICP are for June 2023. Observation for contribution of domestic demand to GDP growth in Croatia is missing.
While supply shocks are now unwinding, their lagged effects on inflation are still being felt as past increases in input costs are passed on to consumers.
The dynamics of food prices is a case in point. The energy shock and Russia’s war in Ukraine have contributed to a spike in food prices.[3] While the food producer price index peaked last October and food consumption has fallen in real terms in some euro area countries,[4] consumer food inflation has only recently started to moderate from elevated levels.
Core inflation – that is, inflation excluding energy and food – provides another example of these lagged effects. Empirical analyses indicate that the contribution to core inflation of higher input costs stemming from supply chain disruptions and the energy shock only peaked last March (Chart 3). Furthermore, movements of producer prices influence retail prices with a delay of some months (Chart 4).[5]
But there have also been other factors at play.
The reopening of the economy after the pandemic provided a boost to consumption in the summer of last year, with a significant shift in demand towards services such as travel, hospitality and restaurants. These sectors faced labour shortages in a tight job market.
Such sectoral demand-supply imbalances, coupled with the uncertainty generated by high and volatile inflation, have in turn allowed some firms to raise their profit margins.[6] This is consistent with the conspicuous increase in profits in specific sectors, on the back of retail prices rising quickly despite wholesale prices falling.[7]
In this context, even though we were not facing generalised and sustained excess demand – or a significant reduction in production capacity[8] – we recalibrated our policy for three main reasons.
The first was to avoid monetary policy adding to inflation risks. With inflation accelerating, failure to adjust policy rates would have made monetary policy more accommodative when the opposite was needed.
The second was to anchor inflation expectations. Although inflation expectations did remain anchored, we needed to stem the risk of a de-anchoring in the face of persistently high inflation. De-anchoring inflation expectations would have made our disinflationary policy costlier, requiring higher policy rates to obtain the same real rate. It would also have increased the risk of a wage-price spiral, which would have been very costly to stop.[9]
The third reason was to contain the risks connected to the strength of the labour market. With the unemployment rate at a historical low of 6.4% in June, firms tended to retain their workforce in response to slowing growth rather than resort to layoffs.
This increased the risk that a phase of wage catch-up could turn into a self-sustained and destabilising process. Given that wages make up as much as 40% of input costs for service providers, and with services inflation accounting for almost two-thirds of core inflation,[10] we continue to closely monitor this risk.
The shifting balance of risks
These factors that were initially driving our actions have now diminished in intensity.
First, the process of disinflation has been set in motion, pushing inflation expectations down.
From March onwards, we have observed a consistent decline in consumer expectations for inflation over a 12-month horizon.[11] Likewise, firms’ expectations regarding their selling prices for the coming quarter have markedly decreased from their peak of last year (Chart 5).[12]
Chart 5
Selling price expectations for the next three months in the EU
(percentage balances)

Sources: European Commission (including Eurostat) and ECB calculations.
Notes: Percentage balances are the difference between positive and negative answer options, expressed as a percentage of total answers. The latest observations are for July 2023.
Moreover, long-term inflation expectations derived from surveys have remained largely stable.[13] This allays concerns about a wage-price spiral. And so far wage developments have been in line with our staff projections, which envisage inflation reverting to 2% by the end of 2025.
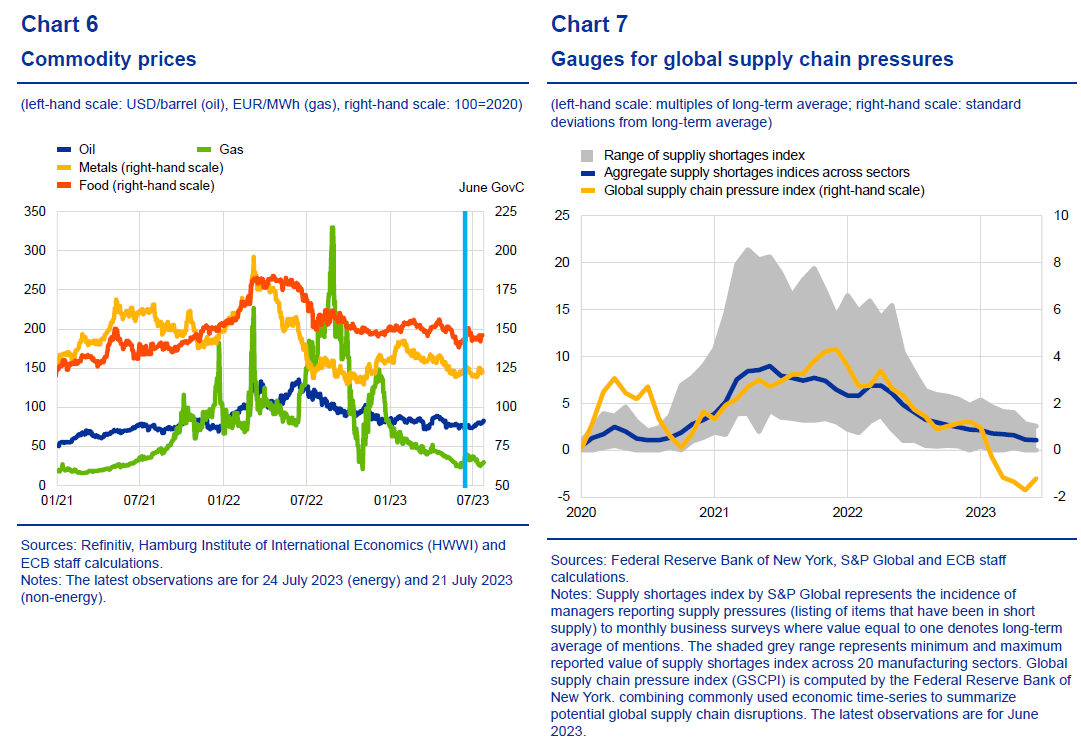
Second, as supply shocks recede, pipeline price pressures are diminishing, and the risks to inflation are becoming balanced. Supply chain pressures have substantially abated compared with last year. Commodity prices have fallen, although persistent upward pressures on energy and food prices due to geopolitical tensions and climatic events could reverse this trend (Charts 6 and 7).
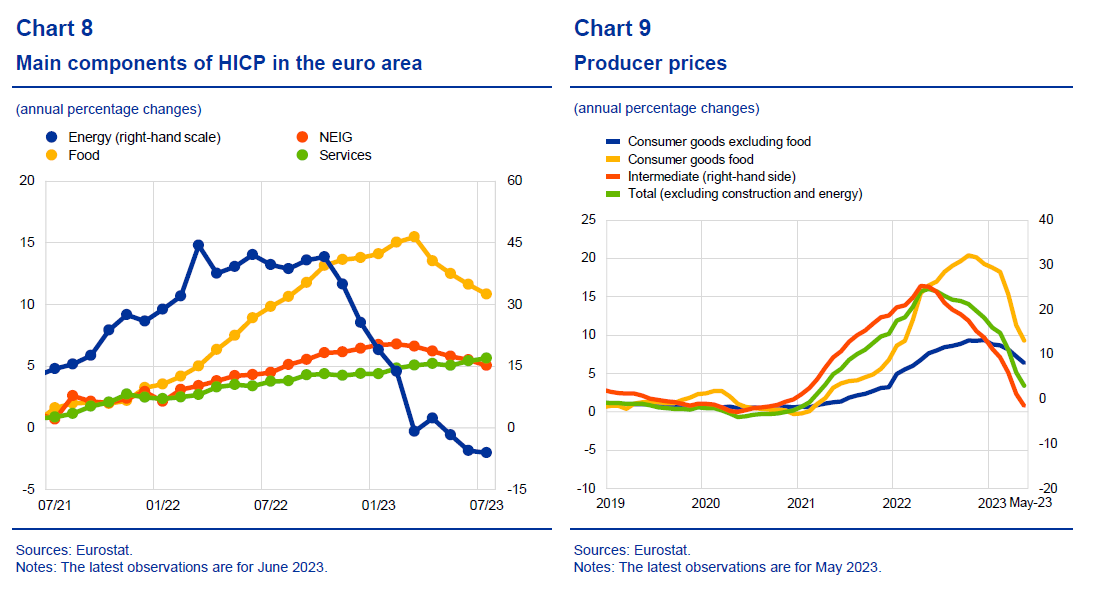
Falling energy prices have already pushed headline inflation lower: energy inflation, which had surged to 44.3% in March 2022, is now in negative territory (Chart 8). And most effects of the unwinding supply shocks on non-energy inflation are yet to emerge. Services inflation is still rising, owing to robust spending on holidays and travel as well as base effects. It is important to monitor this inflation component and its implications for the risks to overall inflation. Underlying inflation is moderating[14]. Inflation pressures at the early stages of the price formation process are easing, with producer price inflation (PPI) declining further in recent months (Chart 9).
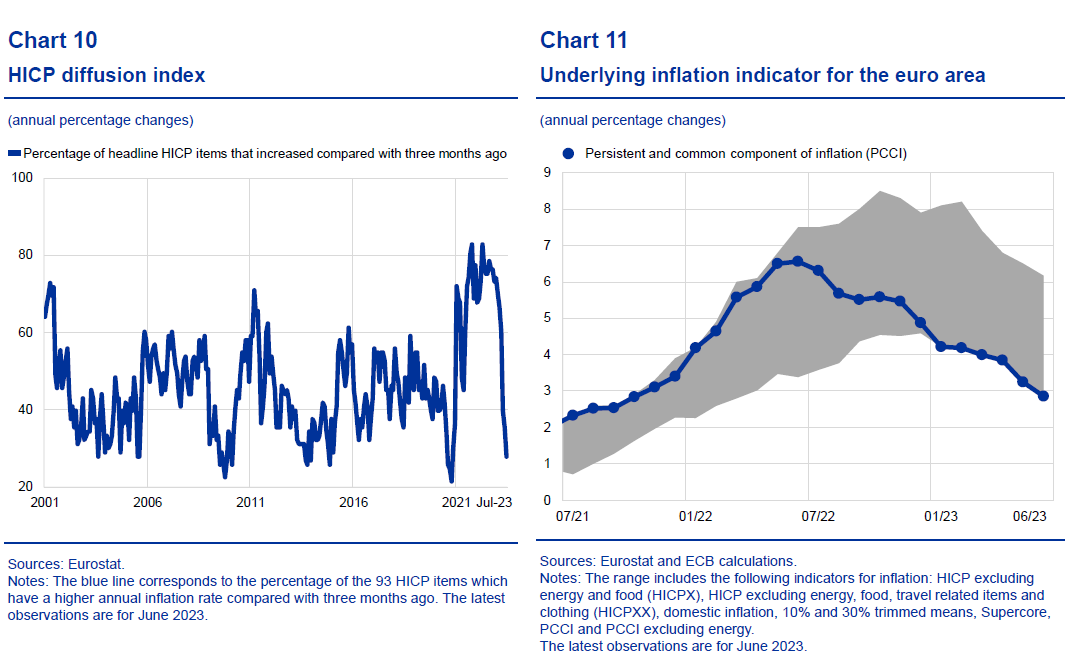
The proportion of items in the consumption basket that have a higher annual inflation rate compared with the previous quarter has fallen from a peak of 80% to less than 30% (Chart 10). Measures capturing the persistent and common component of inflation (PCCI) show increasing signs of softening (Chart 11).
Although core inflation is still elevated and is projected to remain around current levels throughout the summer,[15] empirical evidence suggests that it is a lagging – not a leading – indicator of inflation.[16] In other words, looking at core inflation today does not tell us much about where headline inflation will settle in the medium term. Just as higher energy prices seeped through the economy on the way up, they will also eventually do so on the way down.
Third, as the economic outlook deteriorates, the risks to economic activity are tilted to the downside. The “bullwhip effect” on inventories[17] seems to be reversing, contributing to a manufacturing recession. The downturn in the euro area manufacturing sector intensified in July, with the manufacturing PMI falling to its lowest level in over three years and prices charged by manufacturers falling at the steepest rate since 2009.[18]
The services sector continued to expand, but it did so at its slowest rate since the start of 2023, suggesting that the resurgence in services spending may be losing momentum.[19] The Citigroup Economic Surprise Index shows a divergence between the euro area and the United States, with the euro area registering mostly negative surprises in recent months (Chart 12).
Chart 12
Citigroup economic surprise indices
(percent)
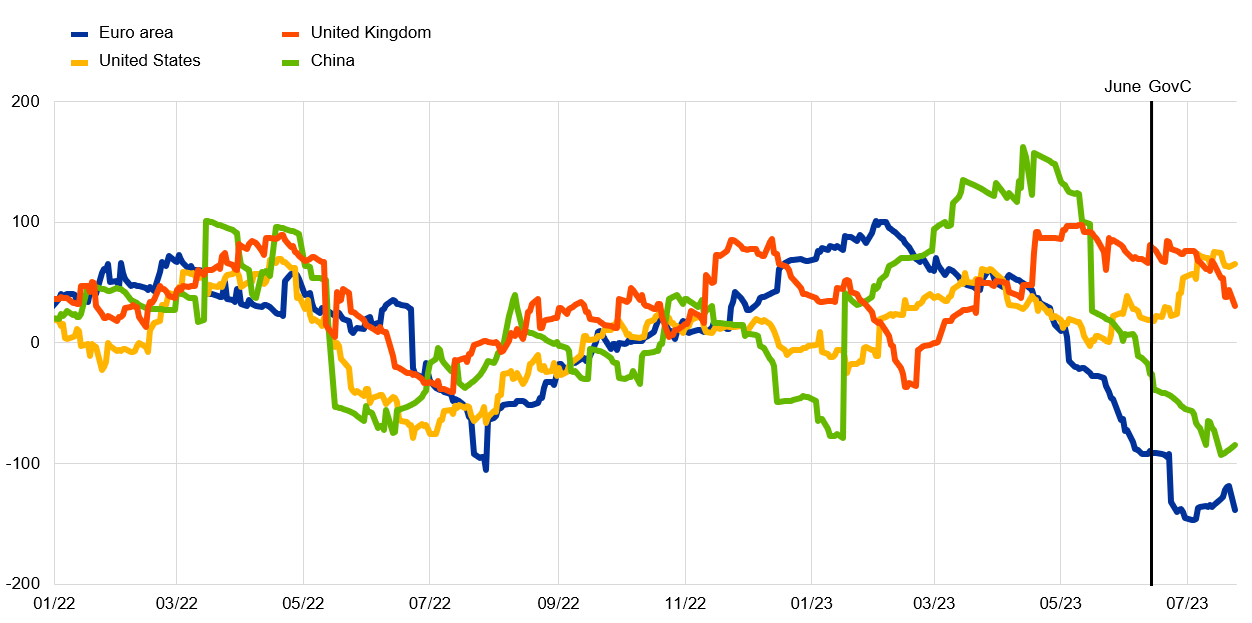
Sources: Citigroup via Haver Analytics.
Notes: The vertical line marks the date of the Governing Council meeting in June 2023. The latest observations are for 24 July 2023.
Demand conditions in the euro area are likely to remain weak as the impact of monetary policy strengthens, governments unwind the fiscal policy measures they adopted in response to the energy crisis and the consumption impulse from excess savings fades.
If downside risks to growth persist and materialise, high wage growth is less likely to be sustained. The decline in inflation could contain wage demands, and high profits may help to absorb them. And if firms start to anticipate a drop in future demand and labour needs, the economic strength represented by firms’ tendency to hoard labour could turn into a vulnerability.
The path ahead for monetary policy
So, what does this mean for how we calibrate monetary policy?
The current juncture is particularly challenging, given that the effects of our past tightening are yet to be felt in full.
We have clear indications that our monetary policy is being transmitted strongly to monetary and credit conditions.
Money growth has fallen dramatically (Chart 13), and both nominal and real rates have increased considerably since the start of the tightening cycle.
Chart 13
M1 and M3 growth in the euro area
(annual percentage changes)
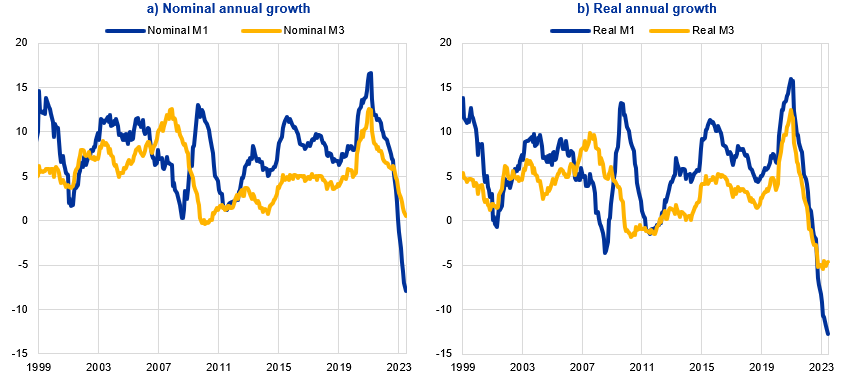
Sources: ECB (Balance sheet items (BSI), Harmonised indices of consumer prices (ICP)) and ECB calculations.
Notes: Real M3 and M1 are deflated by the HICP. The latest observations are for June 2023.
In the credit market, both quantities and rates have reacted to our tightening much faster than in the past.
Our bank lending survey finds that firms’ demand for loans in the second quarter of 2023 was at its lowest level since the survey was first launched two decades ago, while the tightening of lending standards since the start of the hiking cycle has been very substantial. These indications are consistent with the ongoing sharp deceleration of credit aggregates (Chart 14).[20] Rates for loans to firms and households are now at their highest levels since the end of 2008 and summer 2012, respectively. Moreover, the transmission of the rate hikes to time deposits – an important source of funding for banks – has been considerably stronger in the euro area than in the United States (Chart 15).[21]
Chart 14
Credit growth in the euro area
(three-month annualised percentage changes, seasonally adjusted)
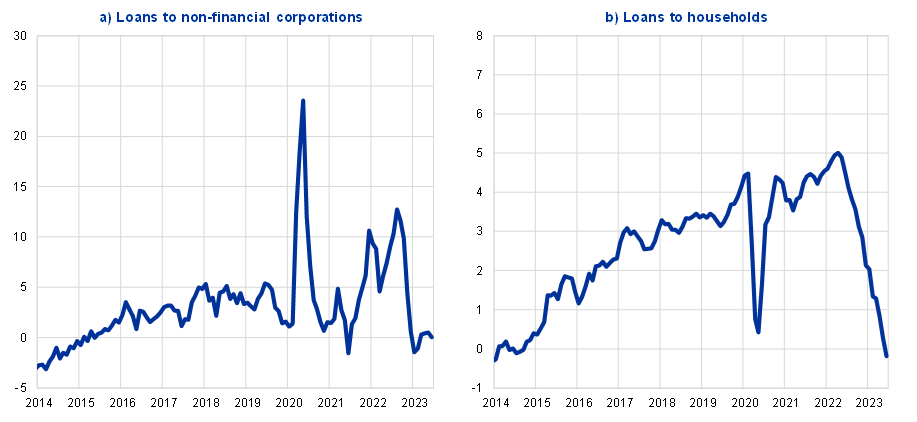
Sources: ECB (BSI).
Notes: In panel a), MFI loans are adjusted for sales, securitisation and cash pooling activities. In panel b), MFI loans are adjusted for sales and securitisation. The latest observations are for June 2023.
Chart 15
Deposit rate pass-through in the euro area and in the United States
(percentages per annum)

Sources: ECB (MFI interest rate statistics (MIR), Financial market data (FM)), RateWatch, Federal Deposit Insurance Corporation and ECB calculations.
Notes: US policy rate is the Federal Fund Rate. Left panel: time deposits in the United States are the average rate on a 12-month certificate of deposit with a minimum of USD10,000. Checking rates are the average rate on a USD 2,500 minimum checking account. time deposits in the United States are national rates on 12-month certificate of deposits for non-jumbo deposits (< USD 100,000). Checking rates are national rates on non-jumbo deposits. Right panel: Time deposits in the euro area are those with maturity of up to two years. The ECB policy rate is the main refinancing operations rate up to May 2014 and the deposit facility rate thereafter. The latest observations are for August 2023 for the policy rates and June 2023 for bank deposit rates.
Given these developments, we must be prudent in calibrating our monetary policy stance if we are to reach our inflation target without harming economic activity unnecessarily.
It is possible that the transmission of our monetary policy might be even stronger than the staff projections indicate. The rapid increase in interest rates and the fast contraction in our balance sheet may lead to stronger effects on monetary and credit conditions, and eventually on the economy and inflation. In addition, the tightening of monetary policy is being amplified by international policy spillovers.[22]
In these circumstances, our disinflationary monetary policy may be conducted by combining different approaches. One approach – the level approach – entails going higher than where the policy rate is currently, with the risk of then having to cut earlier and faster, as implicit in investors’ expectations about the future interest rate path. Another approach – the persistence approach – instead advocates delivering the same degree of overall restriction while avoiding ups and downs, namely by keeping policy rates at the prevailing level for an extended period.
Emphasising persistence may be particularly valuable in the current situation, where the policy rate is around the level necessary to deliver medium-term price stability, the risk of a de-anchoring of inflation expectations is low, inflation risks are balanced and economic activity is weak. Under such conditions, relying solely on an aggressive approach to rate hikes might amplify the risk associated with overtightening, which could subsequently require rates to be cut hastily in a deteriorating economic environment.
The persistence element can mitigate this risk, giving the central bank more time to assess the lagged effects of its past policy measures and fine-tune the calibration of its stance as new information comes to light over time. This “breathing space” is crucial given that – as I said before – the transmission of our monetary policy may actually turn out to be stronger than our projections indicate.
Moreover, favouring persistence would be in line with our previous proportionate response to the evolving challenges to price stability. We initially prioritised acting swiftly, hiking rates in large steps to normalise our monetary policy stance. We communicated a clear upward path for interest rates to signal commitment to this objective and we brought rates to restrictive levels to address the risks that inflation could remain too high for too long. Later, we reduced the speed, aware of the diminishing distance to our target and the increasing risk of policy misjudgements.
However, emphasising persistence might pose communication challenges. It might give rise to concerns about the effectiveness of our disinflationary policy. Or it might prompt worries that persistence could simply amount to delaying tangible actions, such as rate hikes, in favour of a strategy of keeping rates higher at a later stage – which eventually may or may not be internalised by investors in their anticipation of future policy.
Countering such misconceptions would require clear communication by the ECB. We need to explain that the same degree of restriction can be delivered with different combinations of rate levels and persistence.
In any case, the level approach is not immune to communication problems. For example, under such an approach, a pattern of hiking followed by subsequent rate cuts could undermine the disinflationary impact of our policy if the yield curve inverts in anticipation.[23] But if market participants were to understand persistence as a key element of our policy, the risk of a yield curve inversion would fade.
By determining the duration of a specific policy rate on the basis of incoming data, we can use persistence as a dynamic stabiliser. This would enable us to flexibly adapt our stance based on evolving risks without having to take decisions that might then need to be reversed, at a high cost.
This adaptive methodology aligns seamlessly with our data-dependent approach. And of course, should the inflation outlook materially deteriorate, a further rate adjustment would be warranted.
There are also financial stability aspects to consider, to the extent that they may affect the smooth transmission of our monetary policy. They would be ill-served by aggressive policies that could lead to atypical configurations of the term structure and interfere with usual asset and liability management practices, possibly exposing some intermediaries to substantial interest rate risks.
Conclusion
Let me conclude.
Calibrating monetary policy has become increasingly complex.
We are at a juncture where inflation is falling, with fading supply shocks, but past monetary tightening has yet to be felt in full. With rates now in restrictive territory, monetary policy needs to be calibrated in a way that allows us to reach our inflation target in a timely manner while avoiding unnecessary costs to the economy.
So we need to get disinflation right.
To this end, when steering the monetary policy stance, persistence is becoming as important as the level of our policy rates. This is particularly true given that risks to the inflation outlook have become more balanced, while risks to the economic outlook have shifted to the downside.
A stance that incorporates persistence offers greater scope to flexibly adjust our policy in light of the incoming data, while crucially leaving no room to waver in the fight against inflation. And indeed, let there be no doubt: we are fully committed to bringing inflation back to our target in a timely way.
De Santis, R. (2023), “The Great Supply Shocks: Impact on Euro Area Output and Prices”, presented at the 2023 International Journal of Central Banking Conference.
Arce, O., Koester, G. and Nickel, C. (2023), “One year since Russia’s invasion of Ukraine – the effects on euro area inflation”, The ECB Blog, 24 February.
Before the war, Russia and Ukraine accounted for about 25% and 17% of total global exports of wheat and maize respectively, while Russia was a crucial provider of raw materials used in fertilizers, such as potash.
In May 2023, euro area retail sales of food, drinks and tobacco were down 3.8% year on year in volume (and down 6.5% compared with January 2022).
For example, in the food sector the maximum correlation between food producer prices and restaurant inflation – which has been a significant contributor to the rise in services inflation – is reached with a lag of five months. Restaurants have increased in weight in the services consumption basket, with their contribution to services inflation currently two to three times higher than their long-term average.
Supply-demand mismatches limit competition and enable profit-maximising companies to increase their profit margins without losing market shares. High and volatile input price increases also facilitate widening of profit margins, as the extent to which increases in selling prices reflect the pass-through of increased costs or go beyond the cost increases and benefit profit margins is less clear in such environment.
Panetta, F. (2023), “Everything everywhere all at once: responding to multiple global shocks”, speech at a panel on “Global shocks, policy spillovers and geo-strategic risks: how to coordinate policies” at The ECB and its Watchers XXIII Conference, 22 March.
Panetta, F. (2023), “The complexity of monetary policy”, speech at the CEPR-EABCN conference on “Finding the Gap: Output Gap Measurement in the Euro Area” held at the European University Institute, 14 November.
Wage setting in the euro area is staggered and highly inertial.
Lagarde, C. (2023), “The path ahead”, speech at “The ECB and Its Watchers XXIII” conference, 22 March.
In the March, April and May editions of the ECB Consumer Expectations Survey, median inflation expectations 12 months ahead show a gradual decline. See Table 1 in ECB (2023), “Consumer Expectations Survey - Inflation perceptions and expectations”, 5 July.
European Commission (2023), “Economic Sentiment and Employment Expectations down in the EU and the euro area”, 28 July.
The latest results from the ECB Survey of Professional Forecasters and Survey of Monetary Analysts foresee long-run inflation at 2.1% and 2.0%, respectively. For the ECB Survey of Professional Forecasters, longer-term inflation expectations relate to the year 2028, while for the Survey of Monetary Analysts long-run inflation expectations are not tied to a specific year. See ECB (2023), “ECB Survey of Professional Forecasters – Survey results Q3 2023” and ECB (2023), “The ECB Survey of Monetary Analysts: Aggregated Results”, July.
The ECB monitors several indicators of underlying inflation. These can be broadly grouped into three categories: (i) exclusion-based measures, (ii) trimmed measures, and (iii) model-based measures. These measures aim to capture more persistent price developments (for instance, by excluding more volatile items from headline inflation) to provide a clearer signal for medium-term inflation developments.
The persistence of core inflation over the summer months is due to high demand for services and base effects.
Following the approach of Lenza and Reichlin (2011), ECB staff have conducted empirical analysis in which core inflation is compared with timely and smooth measures of underlying inflation. Centred and unilateral two-year moving averages (MA) of headline inflation are constructed and then compared with core inflation. The centred MA measure leads headline inflation, since it is by construction a linear combination of past and future observations. By contrast, the unilateral MA measure lags headline inflation, as it is solely based on past data. Euro area core inflation tracks the lagging indicator very closely. This result provides prima facie evidence that core inflation is not a timely indicator of medium-term inflation. Moreover, using current core inflation to forecast future headline inflation does not produce substantial gains compared to a simple autoregressive model, especially over short horizons. See also Lenza, M., and Reichlin, L. (2011), “Should the ECB use core inflation as a signal for medium-term inflation?”, VoxEU Column, 24 June.
Firms reacted to the threat of shortages by ordering more and earlier than usual, which has in turn pushed up inflation along the pricing chain, a phenomenon known as the “bullwhip effect”. See Rees, D. and Rungcharoenkitkul, P. (2021), “Bottlenecks: causes and macroeconomic implications”, BIS Bulletin, No 48, 11 November.
S&P Global (2023), “HCOB Flash Eurozone PMI”, 24 July.
Ibid.
ECB (2023), Euro area bank lending survey, July.
Lane, P. R. (2023), “The banking channel of monetary policy tightening in the euro area”, remarks at the Panel Discussion on Banking Solvency and Monetary Policy, NBER Summer Institute 2023 Macro, Money and Financial Frictions Workshop, 12 July.
ECB staff analysis finds that a simultaneous monetary policy tightening across the United States, United Kingdom and the euro area doubles the negative impact on inflation in 2023 compared with a scenario without spillovers.
We recently saw evidence of this in the results of the Survey of Monetary Analysts (SMA). Starting at end-2022, a systematic pattern emerged in the evolution of SMA respondents’ expectations across successive rounds whereby the continuous increase in the expected peak level of policy rates was accompanied by expectations of a shorter duration at peak (measured as the time length from peak to the first expected rate cut). According to the SMA of July 2023, the median expected timing of the next rate decrease is February 2024. See ECB (2023), “The ECB Survey of Monetary Analysts: Aggregated Results”, June.
European Central Bank
Directorate General Communications
- Sonnemannstrasse 20
- 60314 Frankfurt am Main, Germany
- +49 69 1344 7455
- media@ecb.europa.eu
Reproduction is permitted provided that the source is acknowledged.
Media contacts