


Assessing liquidity vulnerabilities in open-ended bond funds: a fund-level redemption coverage ratio approach
Published as part of the Financial Stability Review, November 2023.
Recent changes in the macroeconomic and financial landscape have underscored the need to reassess how liquidity vulnerabilities have evolved for euro area open-ended bond funds. The higher interest rate environment may have implications for open-ended investment funds exposed to interest rate-sensitive assets and sectors, such as high-yield corporate debt. This, together with recent episodes of liquidity stress in the fund sector (such as that seen in March 2020), highlights the need to re-examine the resilience of bond funds to liquidity shocks. Based on a newly constructed, granular dataset of funds’ portfolio holdings and flows,[1] this box explores how funds’ resilience has evolved since the coronavirus (COVID-19) pandemic and resulting market turmoil. It considers the share of high-quality liquid assets (HQLA) in fund portfolio assets as well as funds’ redemption coverage ratio (RCR), calculated by dividing the value of available HQLA stock by net outflows experienced in a severe but plausible scenario lasting 30 days.[2]
Overall reduced HQLA levels for bond funds would suggest that they have greater liquidity mismatch, which would increase vulnerabilities should the sector face severe outflows. Despite ongoing de-risking by the sector, the median share of HQLA holdings has generally fallen across the sample since the end of 2019, reflecting revaluations of underlying assets[3] and suggesting that overall liquidity risk in the sector is higher than it was before the pandemic (Chart A, panel a). In particular and by definition, relatively less liquid Level 2 assets represent the bulk of the liquidity stock of investment-grade corporate bond funds. This exposes such funds to potentially higher liquidity risk, as the underlying market liquidity for these assets is prone to fall during stressed periods (Chart A, panel b). Moreover, although the aggregate net assets of bond funds in the sample have decreased,[4] the overall sectoral market footprint has remained broadly stable over time and is relatively high in certain market segments.[5] Any procyclical sell-off of less liquid assets during stressed periods could thus have an adverse impact on underlying markets.
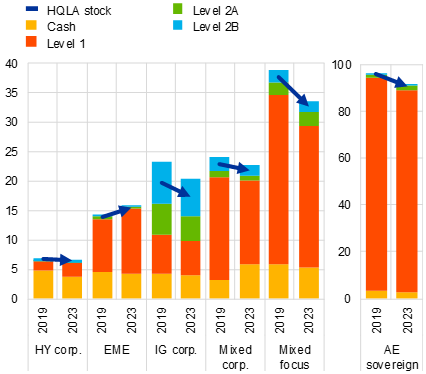
Chart A
Euro area bond funds’ liquid asset holdings have declined, increasing exposure to potentially higher liquidity risk
a) Median HQLA stock, redemption shock and fund group size | b) Weighted average HQLA holdings and stock, by liquidity level |
|---|---|
(x-axis: Jan. 2007-Dec. 2019 (transparent), Jan. 2007-June 2023 (solid), percentages of total net assets; bubble size: Dec. 2019, June 2023, € millions; y-axis: Dec. 2019, June 2023, percentages of total net assets) | (Dec. 2019, June 2023; percentages of total net assets) |
 |  |
Sources: LSEG Lipper IM, ECB (CSDB) and ECB calculations.
Notes: Panel a: redemption shocks (plotted on x-axis) are calculated, for each fund type, as the 5% expected shortfall of the distribution of monthly net flows experienced by funds between January 2007 and December 2019 (transparent bubbles) and January 2007 and June 2023 (solid bubbles) – in line with the methodology applied by ESMA*. The expected shortfall averages net flows below the 5th percentile of the distribution. The size of the bubbles shows the total size of the fund groups in millions of euro for December 2019 (transparent bubbles) and June 2023 (solid bubbles). Panel b: HQLA holdings and stock are weighted by funds’ total net assets. Arrows connect the weighted average HQLA stock per sub-group in Q1 2019 and Q2 2023. Funds’ holdings are classified at the security-level according to the Basel Liquidity Coverage Ratio requirements for HQLA. HQLA Level 1 assets include cash, cash equivalents and qualifying government bonds; Level 2A and 2B include less liquid assets such as qualifying covered bonds, corporate bonds, asset-backed securities and stocks. The HQLA stock is then calculated by applying no haircut to cash and Level 1 assets, 15% to Level 2A assets and 40% to Level 2B assets. Both panels: funds are categorised into six sub-groups based on their portfolio holdings, i.e. when 60% or more of their total net assets are invested in the corresponding asset category. “AE sovereign” includes government bonds issued by advanced economies in accordance with the IMF country classification; for “Mixed corp.”, HY and IG corporate bonds collectively meet the 60% threshold; “Mixed focus” includes the remainder of funds not reaching the 60% threshold. AE stands for advanced economies; IG stands for investment grade; HY stands for high yield; EME stands for emerging market economies.
*) See ESMA, “Stress simulation for investment funds”, ESMA Economic Report, 2019.
The redemption coverage of bond funds in a severe outflow scenario has generally deteriorated since 2019. The RCR results suggest that funds in the sample are generally less resilient to redemption shocks now than they were four years ago. In particular, a large share of corporate and emerging-market bond funds would not have sufficient liquid assets to cover potentially large redemptions over a one-month period[6] (Chart B, panel a). This is because such funds invest in less liquid markets and have historically suffered higher outflows than the other sub-groups. While the share of entities with an RCR of below one has generally increased, the number of funds with a liquidity shortfall[7] – defined as net outflows minus liquid assets – has decreased overall. However, shortfall levels remain quite high (i.e. more than 10% of total net assets) for a considerable share of funds in each group (Chart B, panel b). This is with the sole exception of investment-grade corporate bond funds, for which an increase in funds with a high liquidity shortfall suggests an even larger uptick in vulnerabilities than for the other groups.
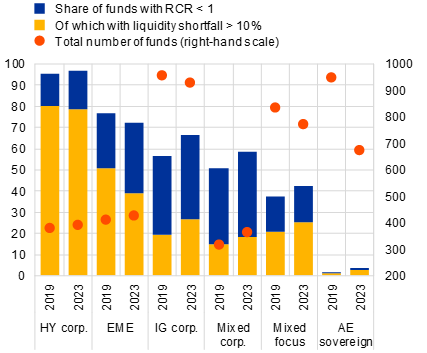
Chart B
Corporate and emerging-market bond funds show signs of material liquidity mismatch amid a sector-wide deterioration in resilience to severe redemptions
a) Distribution of fund-level RCR, by fund type | b) Share of funds with RCR < 1 and a high liquidity shortfall, by fund type |
|---|---|
(Dec. 2019, June 2023; ratios) | (Dec. 2019, June 2023; left-hand-scale: percentages of funds in group, right-hand scale: number of funds in group) |
 |  |
Sources: LSEG Lipper IM, ECB (CSDB) and ECB calculations.
Notes: Panel a: the RCR is the ratio between the fund-level HQLA stock and the calculated group-level redemption shock, both expressed as a percentage of total net assets. Two shocks are applied for 2019 and 2023 respectively, the calibration of which is described in the notes to Chart A, panel a. The box plots display the distribution per fund group of the resulting fund-level RCRs in December 2019 and June 2023. Panel b: liquidity shortfall is defined as the redemption shock (net outflows) minus HQLA stock. The bars display the share of funds, in each fund category, with an RCR < 1 and a liquidity shortfall > 10% of total net assets.
Heightened liquidity vulnerabilities indicate that large-scale redemptions could lead to stress within the bond fund sector, with negative repercussions for the underlying markets. The RCR results are relevant in the current market environment where negative surprises concerning the credit and growth outlook could trigger large redemptions. This, in turn, increases the potential for forced asset sales, increasing the likelihood that stressed funds could amplify negative movements in underlying market prices and liquidity. Consequently, the results also highlight the need to better align asset liquidity with fund redemption terms, in line with the Financial Stability Board recommendations that seek to address structural liquidity mismatch in open-ended investment funds.[8]
The dataset combines fund-level holdings and flows from Lipper and security-level data from the ECB’s Centralised Securities Database (CSDB) for a sample (around 35%) of euro-area domiciled bond funds.
The RCR builds on the Basel Liquidity Coverage Ratio requirements, according to which assets are considered HQLA if they can be easily and immediately converted into cash with little or no loss of value. See also Bouveret, A., “Liquidity Stress Tests for Investment Funds: A Practical Guide”, IMF Working Papers, No 2017/226, IMF, 2017; Metadjer, N. and Moloney K., “Liquidity analysis of Bond and Money Market Funds”, Economic Letter Series, Vol. 2017, No 10, Central Bank of Ireland, 2017; and “Stress simulation for investment funds”, ESMA Economic Report, ESMA, 2019.
Euro area investment funds have been increasing purchases of investment-grade sovereign and corporate bonds, while the latter have also suffered negative revaluations (see Chapter 4 in this issue of the Financial Stability Review).
The sample’s aggregate net assets decreased by 10%, in line with the 8% fall for euro area bond funds between Q4 2019 and Q2 2023 reported under ECB Investment Funds Balance Sheet Statistics (IVF).
For example, the market share of euro area investment funds in euro area corporate bonds remained stable at 24% between Q4 2019 and Q2 2023, and that of euro area high yield corporate bonds at 40%, reported under ECB Securities Issues Statistics (CSEC) and Securities Holdings Statistics (SHS).
Assuming funds first sold liquid asset to meet outflows.
For funds with a RCR of less than 1, a larger liquidity shortfall implies that the fund would need to sell more illiquid assets to cover severe redemptions.
See “Addressing Structural Vulnerabilities from Liquidity Mismatch in Open-Ended Funds – Revisions to the FSB’s 2017 Policy Recommendations: Consultation report”, FSB, 2023.