


10 July 2024
The green transition will significantly increase demand for key minerals over the coming decades. The impact on energy prices will ultimately depend on how supply adjusts. The ECB Blog looks at the geopolitical risks involved.
The green transition relies on certain key minerals, in particular lithium, copper, nickel, cobalt, manganese, and graphite. Assuming that the transition takes place in accordance with the Paris Agreement, demand for these key inputs will almost quadruple by 2040.[1] The impact on energy prices will depend on how supply adjusts. Ensuring the necessary supply of these “green minerals” is therefore vital.
Russia’s attack on Ukraine illustrated how geopolitical developments can significantly affect commodity markets and inflation.[2] IMF research confirms this and underlines that geopolitical fragmentation might disrupt the green transition by impairing access to green minerals.[3] The questions are therefore: what are the geopolitical risks to green minerals supply? What are the political relationships between main consumers and suppliers? And what can be done to contain demand for and secure supplies of green minerals?
What could cause supply disruptions?
The mining of raw minerals is mainly concentrated in developing and emerging market economies in South America and Africa (Chart 1). Supplies of green minerals are currently more concentrated than for other commodities such as oil, even compared to when OPEC was formed (Chart 2). The concentration of mine production makes green minerals particularly susceptible to supply chain disruptions and trade restrictions. In fact, all minerals explored in this blog are currently subject to export restrictions.[4]
Chart 1
Share of three largest mine producers (left) and reserve holders (right)
(percent)
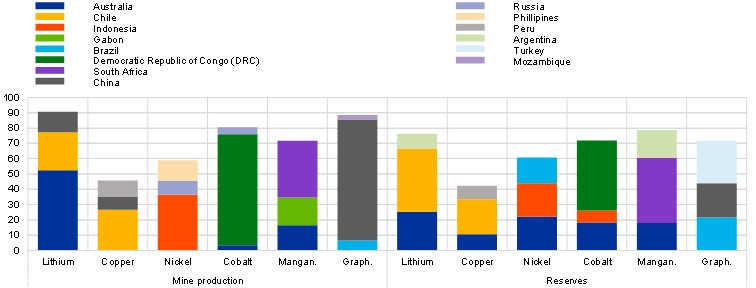
Sources: United States Geological Survey, British Geological Survey, and ECB staff calculations.
Latest observation: 2021 (annual).
Chart 2
Concentration of mine production and reserves
(Herfindahl–Hirschman Index)

Sources: United States Geological Survey, British Geological Survey, BP Statistical Review of World Energy and ECB staff calculations.
Notes: The Herfindahl-Hirschman Index (HHI) is a measure of market concentration. The HHI can range from 0 to 10,000. The higher the number, the more concentrated the market. An HHI of less than 1,500 is generally considered to be a competitive market, an HHI of 1,500 to 2,500 is considered moderately concentrated, and an HHI of 2,500 or greater is highly concentrated. 1960 denotes the year when OPEC was established.
Latest observation: 2021 (annual).
Certain mineral-rich countries are reportedly looking to form mineral cartels, although thus far without success.[5] There are multiple factors that determine success in forming a cartel, such as barriers to entry, political stability and inelasticity of demand.[6] Among these factors, concentration of supply can facilitate a cartel’s ability to control market shares, and thereby prices.
A successful cartel ultimately requires agreement amongst members and a high degree of trust to maintain collusion. Based on voting patterns in the United Nations (UN), the top three miners of copper, nickel and graphite generally show high political alignment, with a disagreement score that is below the UN average and comparable with or even below that of the oil cartel, OPEC(+) (Chart 3). This would suggest some political basis for cartel formation. Although political disagreement scores among miners of lithium, cobalt and manganese are above the UN average, this is largely skewed by the presence of Australia, which tends to disagree with other top raw producers of these three minerals. This suggests that potential cartels might form that exclude Australia, as was the case in the oil market where the United States has never been a part of OPEC.
Chart 3
Political disagreement among top-three mine producers and reserve holders
(index – higher value indicates higher disagreement among key producers)
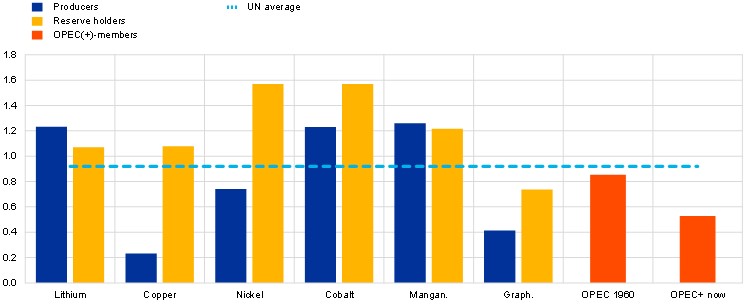
Sources: United States Geological Survey, United Nations General Assembly Voting Data (see Bailey, M. A., A. Strezhnev and E. Voeten (2017), “Estimating Dynamic State Preferences from United Nations Voting Data”, Journal of Conflict Resolution, 61(2)) and ECB staff calculations.
Notes: The disagreement score for each mineral is calculated as the average political disagreement among the top-three producers or reserve holders. For OPEC(+), the average political disagreement between all member countries is used.
Latest observation: 2020.
What’s the political connection between consumers and suppliers?
Geopolitically, China currently appears to be better positioned than the EU and the United States in terms of securing supplies of green minerals. China exhibits the lowest level of political disagreement with the main mine producers of green minerals (Chart 4). This is a trend that began at the end of the Cold War. The comparable political disagreement levels for the EU are generally above the UN averages, but still well below levels for the United States.
Chart 4
Political disagreement of the EU, the United States and China with mine producers over time
(index – higher value indicates higher disagreement with key mine producers)

Sources: United States Geological Survey, United Nations General Assembly Voting Data (Bailey, Strezhnev and Voeten, 2017) and ECB staff calculations.
Notes: Political disagreement between two countries is calculated as the distance between preference scores based on records of UN voting for every year. Each region’s disagreement score with minerals producers is calculated as the average of the region’s disagreement with the five largest producers in every year, weighted by the market share of that producer for every mineral. Solid lines are the averages across the six minerals covered in this blog post. Dashed lines indicate the maximum and minimum disagreement scores for the respective years.
Latest observation: 2020.
China has also strategically positioned itself in the green mineral supply chain by becoming the single largest processer of nickel, copper, lithium and cobalt, accounting for between 35-70% of processing activity. Moreover, its upstream control of raw commodities has been increasing due to investments in mining abroad. Although both the United States and EU have taken steps to build their own supply chains of critical materials, considerable investment will be needed to catch up with China’s investments, suggesting that China will retain its dominant position for the foreseeable future.
So what can be done?
Several actions can be taken to enhance the security of green mineral supplies. First, encouraging private investment in mineral extraction and refining can help to diversify supply risks. By facilitating extraction of reserves and the entry of new producers, this could weaken the power of current market leaders. Second, research into substitute materials for green technologies is producing promising first results, and could reduce future demand for green minerals. Third, these minerals are recyclable. This means that there is a secondary source of supply that is likely to grow in the future as both the stock of recyclable products and investment into recycling technologies increase.
The EU recently took an important step in adopting the Critical Raw Materials Act. By 2030, at least 10% of the EU’s annual consumption of critical raw materials should be extracted within the EU, and 40% should be processed domestically. Moreover, approvals procedures for raw materials projects will be streamlined and strategic projects will benefit from access to finance and shorter approvals timeframes. Recyclability of minerals is also promoted, as at least 15% of annual consumption should be covered by domestic recycling in 2030. The share of imports from a single third-party country should also not exceed 65% of annual consumption. This benchmark aims to diversify supply risks, which will be further supported by the creation of a raw materials club for countries interested in strengthening global supply chains and the establishment of an EU export credit facility to reduce the risks of investing abroad.
The views expressed in each blog entry are those of the author(s) and do not necessarily represent the views of the European Central Bank and the Eurosystem.
International Energy Agency (2021), “The Role of Critical Minerals in Clean Energy Transitions”.
From an historical perspective, the geopolitical risks for Europe related to green minerals are similar to those it has faced in sourcing other inputs for non-green use, such as oil from the Middle East and gas from Russia.
See Alvarez, J. A., Andaloussi, M. B., Maggi, C., Sollaci, A., Stuermer, M., & Topalova, P. (2023). “Geoeconomic Fragmentation and Commodity Markets” (No. 2023/201). International Monetary Fund.
Indonesia announced in October 2022 that it was studying the possibility of forming an OPEC-style cartel for nickel, cobalt and manganese. Argentina, Chile and Bolivia, the so-called “lithium triangle” which together account for 30% of mining and around 50% of reserves, are reportedly in discussions to form a lithium cartel. See “Indonesia considers OPEC-style cartel for battery metals”, Financial Times, 31 October 2022.
For a more detailed discussion, see Charlton (1977), Politics and Commodity Cartels, Peach Research, Vol. 9 and Levenstein and Suslow (2006), “What Determines Cartel Success?”, Journal of Economic Literature, 44(1).