Liquidity conditions and monetary policy operations from 4 November 2020 to 26 January 2021
Published as part of the ECB Economic Bulletin, Issue 2/2021.
This box describes the ECB’s monetary policy operations and liquidity developments during the seventh and eighth reserve maintenance periods of 2020. Together these two maintenance periods ran from 4 November 2020 to 26 January 2021 (the “review period”). On 10 December, the Governing Council of the ECB introduced a number of policy adjustments. It decided to increase the envelope of the pandemic emergency purchase programme (PEPP) by €500 billion, to a total of €1,850 billion, and to extend its time horizon by nine months, to at least the end of March 2022. In addition, three additional targeted long-term refinancing operations (TLTRO III) were offered and the period over which considerably more favourable terms apply was extended by twelve months, to June 2022. For a comprehensive overview of the measures refer to the eighth issue of the Economic Bulletin 2020.
The level of central bank liquidity in the banking system continued to rise during the review period. This was largely due to asset purchases conducted under the asset purchase programme (APP) and the PEPP along with the settlement of TLTRO III.6, combined with a moderate decline in the net autonomous liquidity factors.
Liquidity needs
The average daily liquidity needs of the banking system, defined as the sum of net autonomous factors and reserve requirements, declined by €18.2 billion to €2,026.3 billion in the review period. The decline to below the levels observed during the previous review period, i.e. during the fifth and sixth maintenance periods of 2020, was attributable to a decline in the net autonomous factors by €20.1 billion to €1,881.5 billion, which outweighed a modest increase in the minimum reserve requirements by €1.8 billion to €144.8 billion (see the section of Table A entitled “Other liquidity-based information”).
The decline in net autonomous factors was in turn driven primarily by lower government deposits, marking a partial reversal of the upward trend that had been observed since March 2020. Government deposits declined by €141.1 billion (or 19%) to €588.7 billion. Overall, despite the decline from the record highs reached in September 2020, government deposits are still more than two times higher than their average level of €213.1 billion for the same period (4 November until 26 January) in previous years (2020, 2019 and 2018). The extraordinarily rapid growth in government deposits between March and September 2020 was likely motivated by a change in the cash management by euro area governments during the coronavirus (COVID-19) crisis. However, while the decline in government deposits during the review period could indicate the start of a normalisation process, any such process may remain sensitive to COVID-19 crisis dynamics. The decline in government deposits was partially compensated for by an increase in banknotes in circulation (of €31.8 billion, to €1,416.7 billion) and a rise in other autonomous factors (of €32.0 billion, to €915.7 billion). In total, liquidity-absorbing autonomous factors decreased by €77.4 billion to €2,921.0 billion. This was partially offset by a decline in liquidity-providing autonomous factors by €57.2 billion to €1,039.8 billion. The decline was driven by lower net assets denominated in euro. Overall, the net liquidity-absorbing effect from autonomous factors declined by €20.1 billion to €1,881.5 billion. Table A shows an overview of the autonomous factors discussed above and their changes.
Table A
Eurosystem liquidity conditions
Liabilities
(averages; EUR billions)

Source: ECB.
Notes: All figures in the table are rounded to the nearest €0.1 billion. Figures in brackets denote the change from the previous review or maintenance period.
1) Computed as the sum of the revaluation accounts, other claims and liabilities of euro area residents, capital and reserves.
2) “Minimum reserve requirements” is a memo item that does not appear on the Eurosystem balance sheet and therefore should not be included in the calculation of total liabilities.
Assets
(averages; EUR billions)

Source: ECB.
Notes: All figures in the table are rounded to the nearest €0.1 billion. Figures in brackets denote the change from the previous review or maintenance period.
Other liquidity-based information
(averages; EUR billions)

Source: ECB.
Notes: All figures in the table are rounded to the nearest €0.1 billion. Figures in brackets denote the change from the previous review or maintenance period.
1) Computed as the sum of net autonomous factors and minimum reserve requirements.
2) Computed as the difference between autonomous liquidity factors on the liability side and autonomous liquidity factors on the asset side. For the purpose of this table, items in the course of settlement are also added to net autonomous factors.
3) Computed as the sum of current accounts above minimum reserve requirements and the recourse to the deposit facility minus the recourse to the marginal lending facility.
Interest rate developments
(averages; percentages)

Source: ECB.
Notes: Figures in brackets denote the change from the previous review or maintenance period.
1) Computed as the euro short-term rate (€STR) plus 8.5 basis points since 1 October 2019. Differences in the changes shown for the euro overnight index average (EONIA) and the €STR are due to rounding.
Liquidity provided through monetary policy instruments
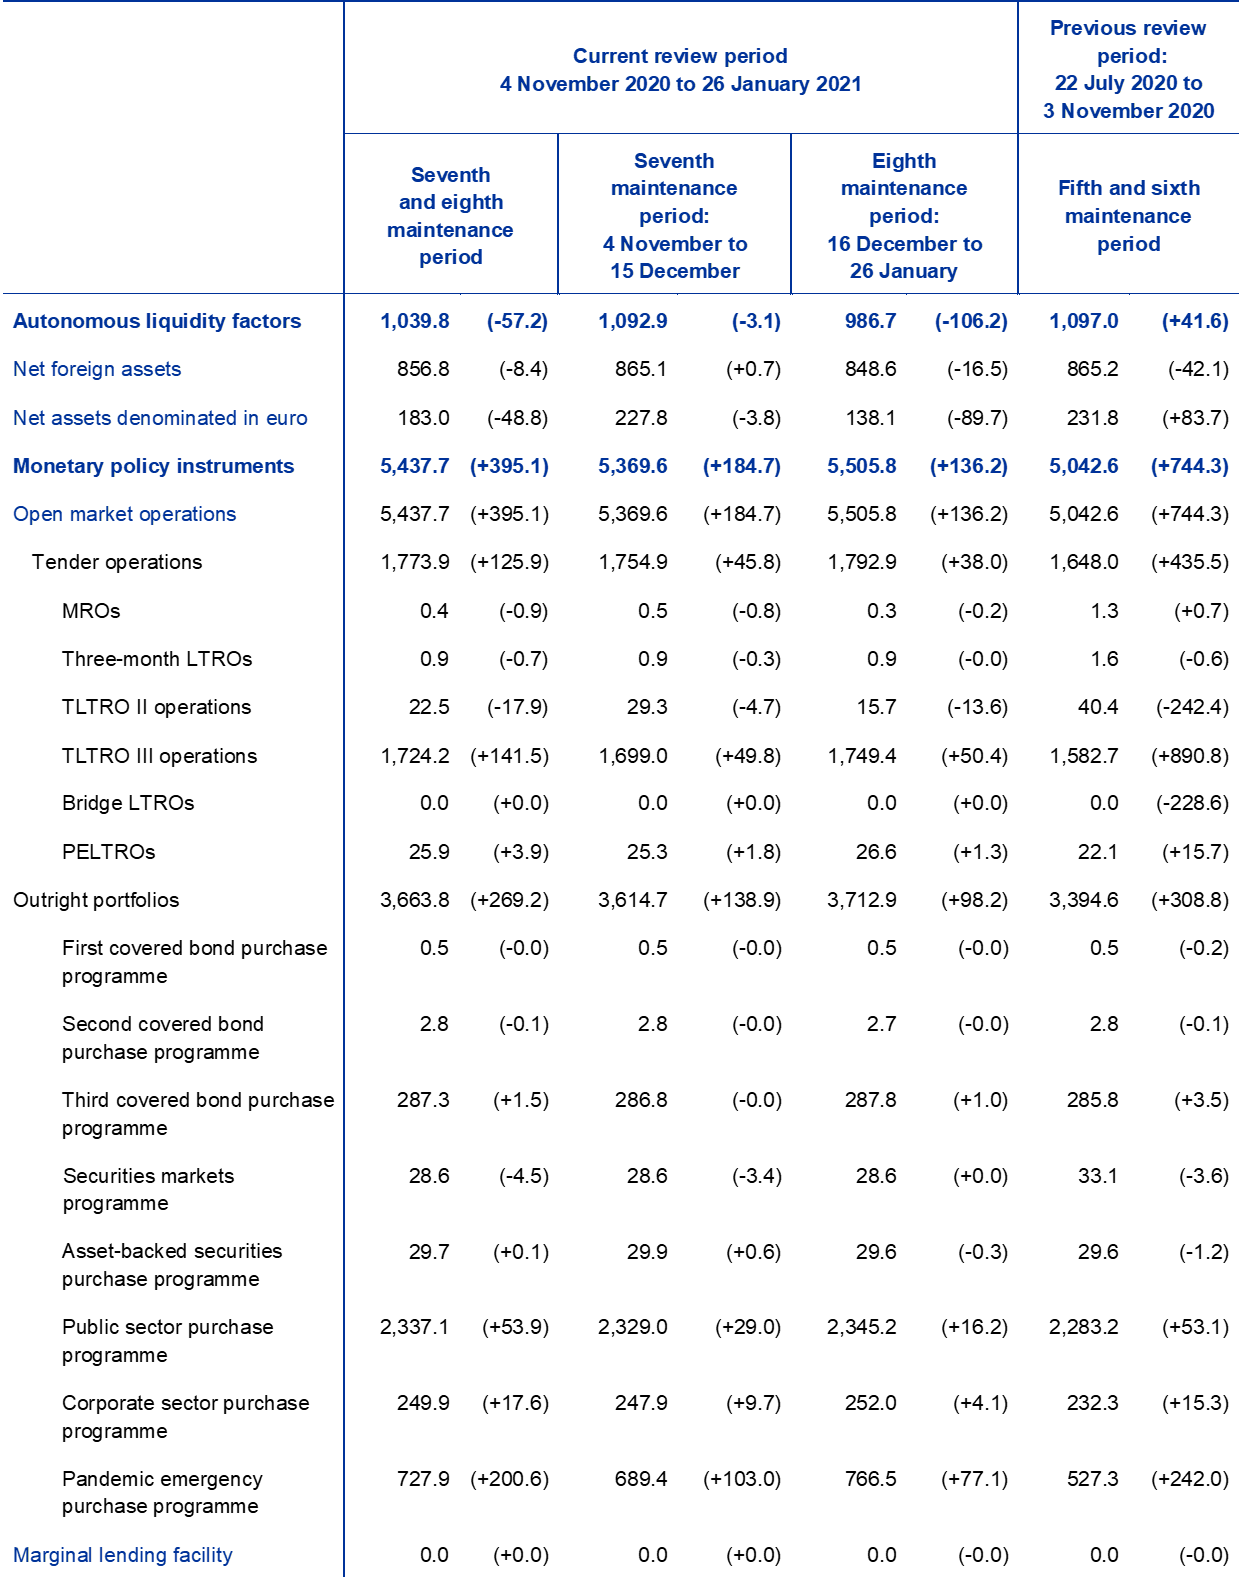
The average amount of liquidity provided through monetary policy instruments increased by €395.1 billion to €5,437.7 billion during the review period (see Chart A). Around 68% of the increase is the result of ongoing net purchases under the asset purchase programmes, primarily the PEPP, while the remaining 32% is the result of credit operations, above all the allotment of TLTRO III.6 in December.
Chart A
Evolution of liquidity provided through open market operations and excess liquidity
(EUR billions)

Source: ECB.
Note: The latest observation is for 26 January 2021.
The average amount of liquidity provided through credit operations increased by €125.9 billion during this review period, largely as a result of the settlement of the sixth operation in the TLTRO III programme. The average increase of €141.5 billion in the liquidity provided through TLTRO III was partially offset by maturities and/or voluntary early repayments under the TLTRO II programme, as counterparties shifted from the TLTRO II to the TLTRO III. On average, maturities and repayments under the TLTRO II programme amounted to €17.9 billion. The PELTRO added an extra of €3.9 billion in liquidity. The main refinancing operation (MRO) and three-month LTROs continue to play only a marginal role, with the average recourse to both regular refinancing operations decreasing by €1.6 billion to €1.3 billion compared with the previous review period.
At the same time, outright portfolios increased by €269.2 billion to €3,663.8 billion, due to net purchases under the APP and the PEPP. Average holdings in the PEPP amounted to €727.9 billion, representing an increase of €200.6 billion in relation to the average of the previous review period. Purchases under the PEPP represented the largest increase by far across all asset purchase programmes, followed by the public sector purchase programme (PSPP) and the corporate sector purchase programme (CSPP), with average increases of €53.9 billion to €2,337.1 billion and €17.6 billion to €249.9 billion, respectively.
Excess liquidity
Average excess liquidity increased by €413.4 billion to €3,411.4 billion (see Chart A). Banks’ current account holdings in excess of minimum reserve requirements grew by €287.6 billion to €2,850.3 billion while the average recourse to the deposit facility increased by €125.8 billion to €561.2 billion. The partial exemption of excess liquidity holdings from negative remuneration at the deposit facility rate under the two-tier system applies only to balances held in the current accounts. Banks therefore have an economic incentive to hold reserves in the current account instead of the deposit facility up to the limit of the exemption granted under the two-tier system. Balances held in excess of the exempted amount are often left in the deposit facility on account of operational convenience and/or regulatory treatment.
Interest rate developments
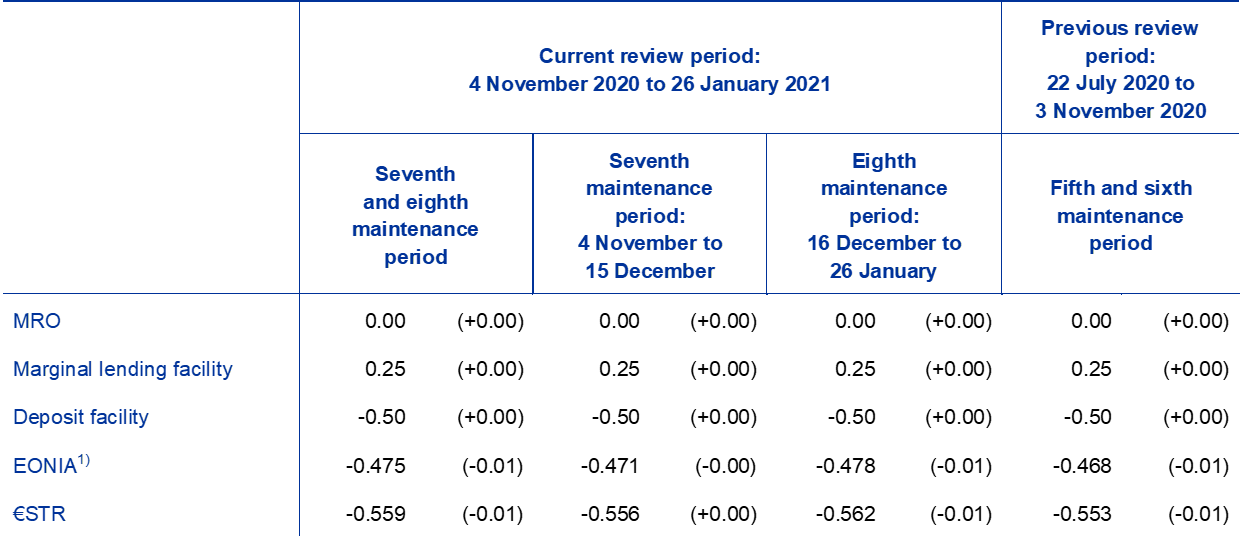
The average €STR stayed essentially unchanged during the review period compared with the previous review period. The €STR averaged -55.9 basis points during this review period compared with an average of -55.3 basis points during the previous one. As of October 2019, the EONIA is calculated as the €STR plus a fixed spread of 8.5 basis points. Therefore, it moved, and will continue to move, in parallel with the €STR. ECB policy rates –the rates on the deposit facility, the main refinancing operation and the marginal lending facility – were left unchanged during the review period.


