
Economic, financial and monetary developments
Overview
At its meeting on 7 March 2024, the Governing Council decided to keep the three key ECB interest rates unchanged. Since its monetary policy meeting on 25 January 2024, inflation has declined further. In the March 2024 ECB staff macroeconomic projections for the euro area, inflation has been revised down, in particular for 2024 which mainly reflects a lower contribution from energy prices. Staff now project inflation to average 2.3% in 2024, 2.0% in 2025 and 1.9% in 2026. The projections for inflation excluding energy and food have also been revised down and average 2.6% for 2024, 2.1% for 2025 and 2.0% for 2026. Although most measures of underlying inflation have eased further, domestic price pressures remain high, in part owing to strong growth in wages. Financing conditions are restrictive and the past interest rate increases continue to weigh on demand, which is helping push down inflation. Staff have revised down their growth projection for 2024 to 0.6%, with economic activity expected to remain subdued in the near term. Thereafter, staff expect the economy to pick up and to grow at 1.5% in 2025 and 1.6% in 2026, supported initially by consumption and later also by investment.
The Governing Council is determined to ensure that inflation returns to its 2% medium-term target in a timely manner. Based on its current assessment, the Governing Council considers that the key ECB interest rates are at levels that, maintained for a sufficiently long duration, will make a substantial contribution to this goal. The Governing Council’s future decisions will ensure that its policy rates will be set at sufficiently restrictive levels for as long as necessary.
The Governing Council will continue to follow a data-dependent approach to determining the appropriate level and duration of restriction. In particular, its interest rate decisions will be based on its assessment of the inflation outlook in light of the incoming economic and financial data, the dynamics of underlying inflation and the strength of monetary policy transmission.
Economic activity
The economy remains weak. Consumers continued to hold back on their spending, investment moderated and companies exported less, reflecting a slowdown in external demand and some losses in competitiveness. However, surveys point to a gradual recovery over the course of 2024. As inflation falls and wages continue to grow, real incomes will rebound, supporting growth. In addition, the dampening impact of past interest rate increases will gradually fade and demand for euro area exports should pick up.
The unemployment rate is at its lowest since the start of the euro. Employment grew by 0.3% in the final quarter of 2023, again outpacing economic activity. As a result, output per person declined further. Meanwhile, employers are posting fewer job vacancies, and fewer firms are reporting that their production is being limited by labour shortages.
According to the March 2024 projections, economic growth is projected to gradually pick up during 2024 as real disposable income rises, amid declining inflation and robust wage growth, and as the terms of trade improve. With the current shipping disruptions in the Red Sea unlikely to cause significant renewed supply constraints, export growth is expected to catch up with strengthening foreign demand. Over the medium term the recovery is seen to also be supported by the gradual fading of the impact from the ECB’s monetary policy tightening. Overall, annual average real GDP growth is expected to be 0.6% in 2024, and to strengthen to 1.5% in 2025 and 1.6% in 2026. Compared with the December 2023 Eurosystem staff macroeconomic projections for the euro area, the outlook for GDP growth has been revised down for 2024, owing to carry-over effects from past negative data surprises and weaker incoming forward-looking information, it is unrevised for 2025 and has been revised slightly up for 2026.
Governments should continue to roll back energy-related support measures to allow the disinflation process to proceed sustainably. Fiscal and structural policies should be strengthened to make the euro area economy more productive and competitive, expand supply capacity and gradually bring down high public debt ratios. A speedier implementation of the Next Generation EU programme and more determined efforts to remove national barriers to deeper and more integrated banking and capital markets can help increase investment in the green and digital transitions and reduce price pressures in the medium term. The EU’s revised economic governance framework should be implemented without delay.
Inflation
Inflation edged down to 2.8% in January and, according to Eurostat’s flash estimate, declined further to 2.6% in February. Food price inflation fell again, to 5.6% in January and 4.0% in February, while energy prices in both months continued to decline compared with a year ago but at a lower rate than in December. Goods price inflation also fell further, to 2.0% in January and 1.6% in February. Services inflation, after remaining at 4.0% for three months in a row, edged lower to 3.9% in February.
Most measures of underlying inflation declined further in January as the impact of past supply shocks continued to fade and tight monetary policy weighed on demand. However, domestic price pressures are still elevated, in part owing to robust wage growth and falling labour productivity. At the same time, there are signs that growth in wages is starting to moderate. In addition, profits are absorbing part of the rising labour costs, which reduces the inflationary effects.
Inflation is expected to continue this downward trend in the coming months. Further ahead, it is expected to decline to the Governing Council’s target as labour costs moderate and the effects of past energy shocks, supply bottlenecks and the reopening of the economy after the pandemic fade. Measures of longer-term inflation expectations remain broadly stable, with most standing around 2%.
According to the March 2024 projections, inflation is projected to moderate further owing to the ongoing easing of pipeline pressures and the impact of monetary policy tightening, albeit at a more modest pace than seen in 2023. Pipeline price pressures should continue to fade with the shipping disruptions in the Red Sea expected to have only a limited upward impact. As energy prices decline, strong labour cost developments should be the dominant driver of inflation excluding energy and food. Nominal wage growth is set to remain elevated, driven by persistent tightness in the labour market, but it should gradually ease over the projection horizon as upward impacts from inflation compensation fade. A recovery in productivity growth should support the moderation in labour cost pressures. Profit growth is set to weaken over the projection horizon and provide a buffer to the pass-through of labour costs. Overall, annual average headline inflation is expected to decrease from 5.4% in 2023 to 2.3% in 2024, 2.0% in 2025 and 1.9% in 2026. Given the weak outlook for energy inflation, headline inflation is expected to remain below inflation excluding energy and food throughout the projection horizon. Compared with the December 2023 projections, headline inflation has been revised down for 2024 and 2025, mainly owing to the direct and indirect effects from lower assumptions for energy commodity prices and lower labour cost pressures, and is unrevised for 2026.
Risk assessment
The risks to economic growth remain tilted to the downside. Growth could be lower if the effects of monetary policy turn out stronger than expected. A weaker world economy or a further slowdown in global trade would also weigh on euro area growth. Russia’s unjustified war against Ukraine and the tragic conflict in the Middle East are major sources of geopolitical risk. This may result in firms and households becoming less confident about the future and global trade being disrupted. Growth could be higher if inflation comes down more quickly than expected and rising real incomes mean that spending increases by more than anticipated, or if the world economy grows more strongly than expected.
Upside risks to inflation include the heightened geopolitical tensions, especially in the Middle East, which could push energy prices and freight costs higher in the near term and disrupt global trade. Inflation could also turn out higher than anticipated if wages increase by more than expected or profit margins prove more resilient. By contrast, inflation may surprise on the downside if monetary policy dampens demand more than expected, or if the economic environment in the rest of the world worsens unexpectedly.
Financial and monetary conditions
Market interest rates have risen since the Governing Council’s meeting on 25 January 2024 and its monetary policy has kept broader financing conditions restrictive. Lending rates on business loans have broadly stabilised, while mortgage rates declined in December and January. Nevertheless, lending rates remain elevated, at 5.2% for business loans and 3.9% for mortgages.
Bank lending to firms had turned positive in December, growing at an annual rate of 0.5%. But, in January, it edged lower, to 0.2%, owing to a negative flow in the month. The growth in loans to households continued to weaken, falling to 0.3% on an annual basis in January. Broad money – as measured by M3 – grew at a subdued rate of 0.1%.
Monetary policy decisions
The interest rate on the main refinancing operations and the interest rates on the marginal lending facility and the deposit facility remain unchanged at 4.50%, 4.75% and 4.00% respectively.
The asset purchase programme portfolio is declining at a measured and predictable pace, as the Eurosystem no longer reinvests the principal payments from maturing securities.
The Governing Council intends to continue to reinvest, in full, the principal payments from maturing securities purchased under the pandemic emergency purchase programme (PEPP) during the first half of 2024. Over the second half of the year, it intends to reduce the PEPP portfolio by €7.5 billion per month on average. The Governing Council intends to discontinue reinvestments under the PEPP at the end of 2024.
The Governing Council will continue applying flexibility in reinvesting redemptions coming due in the PEPP portfolio, with a view to countering risks to the monetary policy transmission mechanism related to the pandemic.
As banks are repaying the amounts borrowed under the targeted longer-term refinancing operations, the Governing Council will regularly assess how targeted lending operations and their ongoing repayment are contributing to its monetary policy stance.
Conclusion
The Governing Council decided at its meeting on 7 March 2024 to keep the three key ECB interest rates unchanged. The Governing Council is determined to ensure that inflation returns to its 2% medium-term target in a timely manner. Based on its current assessment, the Governing Council considers that the key ECB interest rates are at levels that, maintained for a sufficiently long duration, will make a substantial contribution to this goal. The Governing Council’s future decisions will ensure that the key ECB interest rates will be set at sufficiently restrictive levels for as long as necessary. The Governing Council will continue to follow a data-dependent approach to determining the appropriate level and duration of restriction. In any case, the Governing Council stands ready to adjust all of its instruments within its mandate to ensure that inflation returns to its 2% target over the medium term and to preserve the smooth functioning of monetary policy transmission.
1 External environment
Global growth moderated at the turn of the year, as monetary policy tightening transmitted to the world economy. The slowdown in consumption growth partly reflects fading tailwinds across major advanced economies, where labour markets are gradually cooling, though remaining relatively tight, and the stock of excess savings built up during the pandemic has largely been depleted. In China, consumer spending remains subdued against the backdrop of a weak real estate market. Annual global growth rates are projected to gradually decline over the 2024-26 period and are expected in the medium term to remain slightly below the levels observed over the last decade. Compared with the December 2023 Eurosystem staff macroeconomic projections for the euro area, global growth has been revised up for this year in the March 2024 ECB staff macroeconomic projections, largely thanks to stronger growth outcomes in the United States. Global trade is projected to recover this year and grow more in line with global activity thereafter. While the projection for global trade is broadly unchanged compared with the December 2023 projections, global trade is expected to remain below its historical trend over the projection horizon. Global inflation is projected to decline over the same period.
Global economic growth moderated at the turn of the year, as monetary policy tightening transmitted to the world economy. Growth in global real GDP is estimated to have slowed to 0.8% in the fourth quarter, down from 1.0% in the third quarter of 2023.[1] Overall, global economic activity is estimated to have increased by 3.5% in 2023, which is a similar pace to the previous year and the average growth rate over the last decade. It is also 0.2 percentage points above the global growth rate projected in the December 2023 Eurosystem staff macroeconomic projections. Incoming data suggest, however, that global consumption growth is moderating, as tailwinds to consumer spending are fading. Labour markets, while remaining relatively tight, are gradually cooling across major advanced economies, as signalled by declining vacancy-to-unemployment ratios, while nominal wage growth is also progressively falling. Moreover, the stock of excess savings accumulated during the pandemic has largely been depleted. In China, consumer spending remains weak against the backdrop of developments in the residential real estate market. As a result, global consumer spending, which underpinned economic activity in the post-pandemic recovery, remains subdued. Most recently, the global composite output Purchasing Managers’ Index (PMI) increased slightly in February, suggesting that activity has strengthened in both the manufacturing and services sectors (Chart 1). This signal should, however, be seen in the light of a broader set of incoming data, which continue to point towards subdued global activity overall.
Chart 1
Global PMI output
(diffusion indices)

Sources: S&P Global Market Intelligence and ECB staff calculations.
Note: The latest observations are for February 2024.
Global growth is projected to gradually decline over the projection horizon. Mildly lower growth this year reflects the continued fading impact of the above-mentioned tailwinds which had supported consumer spending in advanced economies in the post-pandemic period. The effects of past monetary policy tightening as well as elevated uncertainty amid geopolitical tensions have contributed to these developments. Overall, global real GDP growth is projected to be 3.4% this year, before slowing to 3.2% annually over the 2025-26 period, a pace slightly below the one observed over the last decade. Global growth has been revised up for this year compared with the December 2023 projections, largely thanks to the carry-over of stronger growth outcomes in the United States.
Growth in global trade in goods remains positive. World merchandise trade growth turned positive in the fourth quarter of 2023 and is estimated to have remained so in January 2024 (Chart 2). This improvement reflects a correction of developments characterising the post-pandemic recovery, such as the rebalancing of spending from goods towards services and an adjustment in global inventories. Global trade should continue to recover, as the impact of the post-pandemic developments is expected to gradually fade and both the global manufacturing cycle and private investment appear to be stabilising in early 2024. The improvement in the global “tech cycle”, an early indicator of overall manufacturing growth, is also expected to support trade in the near term.[2]
Chart 2
Growth in trade in goods
(real imports, three-month-on-three-month annualised percentage change, percentage points)
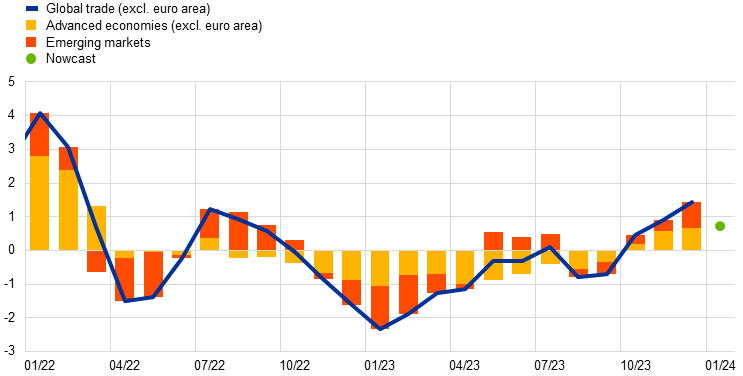
Sources: CPB Netherlands Bureau for Economic Policy Analysis, national sources via LSEG and ECB staff calculations.
Notes: The nowcast incorporates the latest data release using a forecast of global aggregate and a range of macroeconomic variables. The latest observations are for December 2023 for official CPB data and January 2024 for the nowcast.
Disruptions to shipping in the Red Sea could restrain the recovery in global merchandise trade, though their impact to date is judged to be limited. Transit volumes through the Red Sea have fallen significantly as shipping companies are avoiding the area and rerouting their vessels around the Cape of Good Hope. So far, however, global supply chains have remained robust overall – suppliers’ delivery times have only lengthened slightly at the global level this year. They remain in line with their historical average, well below the levels seen in 2021-22 when global supply chains were under severe strain. There are a number of mitigating factors at play. First, spare shipping capacity seems ample, as global demand for goods is relatively subdued and the global fleet of cargo vessels has grown. Second, the levels of congestion at global ports remain broadly unchanged, signalling the ability of these ports to cope with rerouted vessels. Finally, large inventories held by manufacturers are helping to cushion the impact of longer delivery times on production. However, risks to global trade and inflation will remain if the Red Sea disruptions escalate and prove persistent.[3]
Global trade is projected to recover gradually this year and grow more in line with global activity thereafter. Global import growth is expected to increase from 1.2% in 2023 to 2.8% this year, before gradually accelerating to 3.1% in 2025 and 3.2% in 2026, broadly unchanged compared with previous projections. Despite the projected recovery, global trade is expected to remain below its historical trend, reflecting the impact of the ongoing structural changes in trade relations caused by rising geopolitical tensions. Euro area foreign demand is expected to recover more gradually compared with previous projections, held back by weaker import growth in some of the euro area’s main trading partners last year, including the United Kingdom and central and eastern European countries. This weakness carries over to euro area foreign demand recovering more gradually this year compared with the December 2023 projections.
The gradual disinflation trend has continued. Headline consumer price index (CPI) inflation across the member countries of the Organisation for Economic Co-operation and Development (OECD) declined to 5.7% in January, down from 6.0% in the previous month. Core inflation (excluding food and energy) fell slightly in January, to 6.6% after 6.7% in December. Headline CPI inflation momentum, measured as a three-month-on-three-month annualised change, suggests that the global disinflation trend is likely to continue in 2024, although the pace of disinflation is expected to slow compared with last year (Chart 3). This is corroborated by the latest readings of input and output price PMIs, which have leading indicator properties for global core goods and services inflation. According to the March 2024 ECB staff macroeconomic projections, disinflation towards central banks’ targets is projected to proceed gradually over the projection horizon for advanced economies, whereas in emerging market economies, inflation is expected to pick up slightly this year before declining again. This pattern reflects the projected higher inflation in some larger economies such as China, Russia and Türkiye. Growth in euro area competitors’ export prices is expected to turn positive this year and remain around its estimated long-term average over the rest of the projection horizon. This growth has been revised down slightly in 2024 compared with the December 2023 projections, amid lower pipelines pressures and energy commodity prices.
Chart 3
OECD headline consumer price inflation momentum
(three-month-on-three-month annualised percentage change, percentage point contributions)
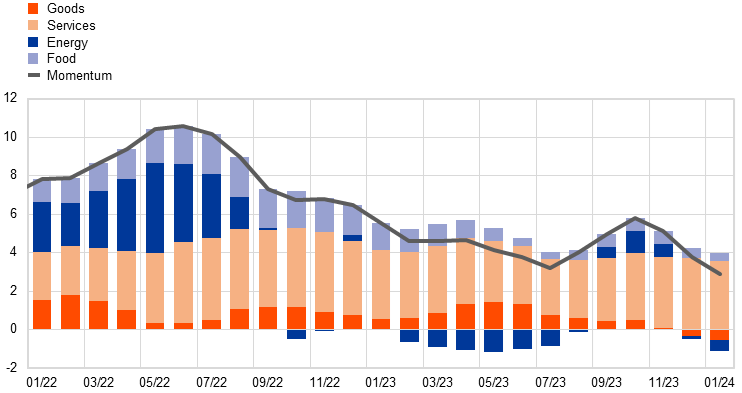
Sources: OECD and ECB calculations.
Notes: Contributions of respective components of OECD headline inflation momentum reported in the chart are constructed bottom-up using available country data, which jointly account for 84% of the OECD area aggregate. Goods inflation is computed as the residual of the contribution of total goods less the contributions of energy and food. The latest observations are for January 2024.
Since the December 2023 projections, crude oil prices have been broadly unchanged, while European gas prices have declined significantly. Oil prices remain relatively stable, despite heightened geopolitical risk in the Middle East. Attacks by Houthi rebels on ships in the Red Sea have disrupted some oil trading. However, oil trade via the much more important Strait of Hormuz has remained largely unaffected, dampening the economic impact of these attacks. Moreover, shipping through the Red Sea has been redirected around the Cape of Good Hope, limiting the upward pressure on oil prices due to higher shipping costs, which only constitute around 1-2% of the oil price. Oil prices have also remained largely unaffected by the supply cuts announced by OPEC+ in late November, which were in place for the first quarter of 2024 and recently also extended to the second quarter. Overall, the global oil market is expected to remain in balance in the first quarter of 2024 and in surplus for the remainder of the year, due to higher oil supply from the United States and weaker oil demand in advanced economies. European gas prices declined sharply, largely due to weaker demand, which reflects a confluence of factors such as a mild winter, reduced gas consumption by households and weaker industrial activity. Supply factors were also supportive of lower gas prices, as gas storage levels remain high.
In the United States, growth remains robust but is expected to moderate this year. High frequency indicators, such as consumer confidence and retail sales, provide rather mixed signals for consumer spending in early 2024, following a strong performance in the fourth quarter of 2023. Rising consumer loan delinquencies indicate that household balance sheets are coming under increasing pressure, with the household saving rate standing at a low level of 4%. In addition, the restrictive monetary policy of the Federal Reserve System continues to weigh on economic activity. Labour market conditions, while remaining tight by historical standards, are gradually cooling and wage growth has declined slightly, albeit remaining at a still elevated level. Headline CPI inflation declined slightly to 3.1% in January, driven by energy prices, whereas annual core inflation remained steady at 3.9%. Core services prices ticked up, primarily due to the reacceleration of non-shelter components. A sectoral breakdown of personal consumption expenditures (PCE) inflation shows the effective transmission of the Federal Reserve’s monetary policy during this tightening cycle, with the interest rate-sensitive sectors showing a larger drop in inflation than the non-sensitive sectors.
In China, recent activity indicators provide mixed signals amid an ongoing adjustment in the residential property market. While industrial production growth increased slightly to 6.5% in annual terms in December, surveys provide mixed signals for the first months of this year. The weak residential property sector remains the key headwind to economic activity and is weighing on private consumption growth in particular. The adjustment in the housing sector has continued into 2024, as new housing sales have declined sharply and construction starts and property sales remain stagnant at very low levels. Against the backdrop of these adverse developments, the equity market has experienced severe volatility recently and consumer confidence has stabilised at a historically low level. Annual headline CPI inflation fell to -0.8% in January, down from -0.3% in the previous month, primarily reflecting further declines in food prices. Annual core CPI inflation (excluding food and energy) remained positive at 0.4%. This low reading for core inflation reflects a very subdued level of consumer demand.
In Japan, real GDP unexpectedly declined in the final quarter of 2023. Economic activity fell again in the fourth quarter, by 0.1%, after contracting by a downwardly revised 0.8% in the third quarter. This outcome reflects weakness in domestic demand which was relatively broad-based. Growth is likely to turn positive in early 2024, supported by stronger readings of survey indicators, especially for the services sector, and rising consumer confidence. Annual headline inflation stood at 2.2% in January 2024, above market expectations but below the levels observed towards the end of last year. The slowdown in headline inflation mostly reflects slowing food inflation and falling energy prices. Core CPI inflation also eased to 2.6% in January, down from 2.8% in December.
In the United Kingdom, economic activity declined again in the fourth quarter. Real GDP growth surprised to the downside in the fourth quarter, standing at -0.3%, down from -0.1% in the third quarter. This contraction was driven by a fall in net trade, reflecting a large decline in services exports. Private consumption and government spending underperformed as well, with the fallout in government spending stemming from recurrent strikes in the public sector. The composite PMI, retail sales and confidence indicators all continued to rise in January 2024, pointing to a pick-up in UK growth momentum as lower financing costs, rising real disposable income and a resilient labour market support domestic demand. The labour market is gradually cooling, but remains tight by historical standards. Vacancies declined, but labour market tightness, measured as vacancies per unemployed worker, remains above historical averages. The latest data on private earnings suggest that nominal wage growth eased to 6.2% in the three months to December, down from 6.6% in the three months to November, and is expected to slow further. In January headline and core CPI inflation remained steady at 4.0% and 5.1% respectively. Over the next few months, headline inflation is expected to drop closer to the Bank of England’s 2% target, but only temporarily due to base effects from previous increases in regulated energy bills.
2 Economic activity
Euro area output remained stagnant at the end of 2023, affected by weak global trade, destocking and the transmission of the ECB’s monetary policy tightening. Activity is expected to remain subdued in the near term and gradually recover later in the year, reflecting falling inflation, robust wage growth and strengthening foreign demand. Survey data continue to point to little or no growth in the short term, but the most forward-looking survey indicators are showing some signals of improvement. Private consumption is still weak as consumers remain price-sensitive and hold off major purchases; however, it should improve as real disposable income recovers. Depleted order backlogs and tight monetary policy are weighing on the short-term business investment outlook, although an improvement in investor confidence suggests that the pre-conditions could be in place for a recovery later in the year. By contrast, housing investment is likely to remain weak. Although demand for labour continues to slow, employment rose further in the fourth quarter of 2023, in line with the increasing labour force. Over the medium term the recovery will also be supported by the gradual fading of the impact from tight monetary policy.
This outlook is reflected in the March 2024 ECB staff macroeconomic projections for the euro area, which foresee annual real GDP growth of 0.6% in 2024, picking up to 1.5% and 1.6% in 2025 and 2026 respectively. Compared with the December 2023 Eurosystem staff macroeconomic projections for the euro area, the outlook for GDP growth has been revised down for 2024, while remaining broadly unchanged for 2025 and 2026.
Euro area output remained stagnant at the end of 2023. According to Eurostat’s flash estimate, real GDP displayed zero growth, quarter on quarter, in the fourth quarter of 2023, on the back of the growing impact of weak global trade and strong monetary policy transmission (Chart 4). This implies that output has remained broadly stable since the third quarter of 2022.[4]
Chart 4
Euro area real GDP and its components
(quarter-on-quarter percentage changes; percentage point contributions)

Sources: Eurostat and ECB calculations.
Note: The latest observations are for the fourth quarter of 2023 for GDP and the third quarter of 2023 for all other items.
Activity is expected to remain weak in the first quarter of 2024. The composite output Purchasing Managers’ Index (PMI) stood at 48.6 on average in January and February, up from 47.2 in the fourth quarter of 2023. Although it has clearly recovered from its most recent trough of 46.5 in October 2023, the index is still below the growth threshold of 50. Across sectors, the PMI for manufacturing output remained in contractionary territory in February, despite increasing steadily from the summer of last year (Chart 5, panel a). The new orders index has shown a somewhat stronger improvement, which is likely related to declining backlogs of work. Business activity in the services sector had shown more stable dynamics at a higher, but still suppressed, level in recent months, before picking up in February, suggesting that the decline that started last year has come to a halt (Chart 5, panel b).
Chart 5
PMI indicators across sectors of the economy
a) Manufacturing | b) Services |
|---|---|
(diffusion indices) | (diffusion indices) |
|
|
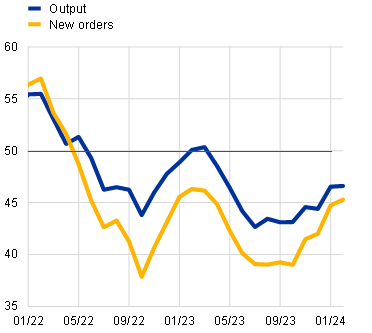
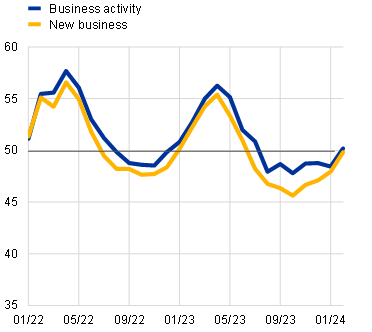
Source: S&P Global Market Intelligence.
Note: The latest observations are for February 2024.
Overall, the labour market remained resilient to weakening economic activity in the fourth quarter of 2023. Employment rose by 0.3% in the fourth quarter (Chart 6, panel a) driven mainly by the continued growth of the labour force, which also increased by 0.3% in the fourth quarter of 2023. By contrast, preliminary data suggest a decline in average hours worked in the fourth quarter of 2023, indicating ongoing labour hoarding (the part of labour input which is not fully utilised by a company in its production process). The unemployment rate declined marginally to 6.4% in January, from 6.5% in December, reaching its lowest level since the euro was introduced. Labour demand has weakened but remains at high levels, with the job vacancy rate falling to 2.7% in the fourth quarter of 2023, 0.2 percentage points lower than in the previous quarter.
Chart 6
Euro area employment, PMI assessment of employment and unemployment rate, and sectoral employment PMIs
a) Employment, PMI assessment of employment and unemployment rate
(left-hand scale: quarter-on-quarter percentage changes, diffusion index; right-hand scale: percentages of the labour force)

b) Sectoral employment PMIs
(diffusion indices)

Sources: Eurostat, S&P Global Market Intelligence and ECB calculations.
Notes: In panel a), the two lines indicate monthly developments, while the bars show quarterly data. The PMI is expressed in terms of the deviation from 50, then divided by 10. The latest observations are for the fourth quarter of 2023 for employment, February 2024 for the PMI assessment of employment and January 2024 for the unemployment rate. In panel b), the latest observations are for February 2024.
Short-term labour market indicators suggest continuing employment growth in the first quarter of 2024. The monthly composite PMI employment indicator rose from 50.1 in January to 51.2 in February, suggesting a further increase in employment. This indicator declined substantially from its peak of April 2023, but has edged up again in the last two months, driven by the services sector (Chart 6, panel b). The PMI services indicator increased from 51.2 in January to 52.7 in February. By contrast, the PMI manufacturing indicator remained in contractionary territory.
Private consumption is likely to have stagnated in the fourth quarter of 2023 and incoming data point to a continued soft outlook in the short term. An aggregation of available country data for private consumption points to a stagnation in the fourth quarter of last year, with the consumption of services likely to have increased slightly, offset by a contraction in spending on goods.[5] This is reflected in the ongoing weakness of retail sales volumes and car sales, both of which remained subdued at the end of the year and were below their fourth-quarter average in January. Moreover, incoming survey data continue to signal overall weakness in spending on goods at the beginning of the year. The European Commission’s consumer confidence indicator picked up marginally in February but remains somewhat below its long-term average. At the same time, the Commission’s indicators for business expectations for retail trade remained subdued in the first two months of 2024 and there has been a downturn in expected sales of motor vehicles compared with the fourth quarter of 2023. Business expectations for contact-intensive services declined in January but rebounded in February, remaining in growth territory (Chart 7). The ECB’s Consumer Expectations Survey (CES) for January also indicates resilient expected demand for holiday bookings. Overall, the ongoing divergence between the consumption of goods and services is supported by the CES analysis, which indicates that households have mainly adjusted their consumption of goods to cope with inflationary pressures over the past few years, while spending on recreation and travel has continued to rise, suggesting a shift in preferences.[6]
Chart 7
Private consumption and business expectations for retail trade, services and motor vehicles
(quarter-on-quarter percentage changes; net percentage balances)

Sources: Eurostat, European Commission and ECB calculations.
Notes: Business expectations for retail trade (excluding motor vehicles), expected demand for contact-intensive services and expected sales of motor vehicles for the next three months refer to net percentage balances; “contact-intensive services” refers to accommodation, travel and food services. The latest observations are for the third quarter of 2023 for private consumption and February 2024 for business expectations for retail trade, contact-intensive services and motor vehicles.
Business investment is likely to have contracted sharply in the fourth quarter of 2023 and is expected to remain weak in the short term. An aggregation of available country data for non-construction investment (excluding Irish intangibles) points to a decline of 1.6%, quarter on quarter, in the fourth quarter of 2023, while industrial production in the euro area capital goods sector (excluding Ireland), which supplies investment goods to firms in the euro area and beyond, fell further.[7] Against a backdrop of depleted order backlogs, which had supported business investment in the past few quarters, the sharp drop in the fourth quarter likely reflected weak activity amid strong monetary policy transmission. With regard to the short-term outlook, the PMI for the capital goods sector showed a slowdown in the decline of output and new orders in the fourth quarter of the year (Chart 8, panel a). However, more forward-looking data for the wider economy, as reflected in the Sentix investor confidence sub-index for the coming six months, have been indicating a recovery since September 2023, with the index rising to a quarterly average not seen since the start of 2022. Moreover, the January 2024 euro area bank lending survey reported that demand for longer-term loans (typically used for fixed capital investment) was expected to rebound into positive territory in the first quarter of 2024. Further ahead, delayed disbursements of Next Generation EU funds are also expected to help crowd in business investment related to the green and digital transitions.
Chart 8
Real investment dynamics and survey data
a) Business investment | b) Housing investment |
|---|---|
(quarter-on-quarter percentage changes; percentage balances and diffusion indices) | (quarter-on-quarter percentage changes; percentage balances and diffusion index) |
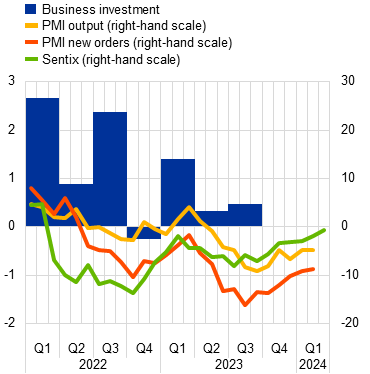 |  |
Sources: Eurostat, European Commission (EC), S&P Global Market Intelligence, Sentix and ECB calculations.
Notes: Lines indicate monthly developments, while bars refer to quarterly data. The PMIs are expressed in terms of the deviation from 50. In panel a), business investment is measured by non-construction investment excluding Irish intangibles. The lines refer to responses from the capital goods sector, except for the Sentix six-month ahead sub-index, which reflects wider investor confidence for the period ahead (series divided by three to re-scale). The latest observations are for the third quarter of 2023 for business investment, March 2024 for the Sentix index and February 2024 for all other items. In panel b), the line for the European Commission’s activity trend indicator refers to the building construction sector’s assessment of the trend in activity compared with the preceding three months. The latest observations are for the third quarter of 2023 for housing investment and February 2024 for all other items.
Housing investment is likely to have fallen somewhat in the fourth quarter of 2023 and should continue to decline in the short term. An aggregation of available national accounts data shows that housing investment in the euro area fell by 0.4% in the fourth quarter of 2023 compared with the third quarter, while building construction in the euro area – a leading indicator for housing investment – dropped by 0.5%. Short-term indicators point to a further decline in housing investment in the first quarter of 2024, with both the PMI for housing production and the European Commission’s indicator for building construction activity remaining in contractionary territory at the start of the year (Chart 8, panel b). Overall, the continuing downward trend in housing investment reflects the significant rise in mortgage interest rates resulting from the tighter monetary policy and its negative impact on the affordability of housing. The persistently high level of interest rates is likely to cause the affordability of housing to remain low and continue to weigh on the momentum of housing investment.
Euro area export growth remained sluggish at the turn of the year. Extra-euro area goods exports declined, quarter on quarter, in December, as subdued global demand continued to exert a drag on exports. In particular, the weakness of the Chinese economy was reflected in low exports to China, while there were signs of a recovery in exports to the United States. At the same time, price competitiveness challenges weighed on exports, reflecting high – albeit falling – energy prices and the past appreciation of the euro. Moreover, euro area imports remained subdued in December as a result of sluggish activity in the euro area. As imports continue to decline at a faster pace than exports, the contribution of net exports to GDP remained positive in the fourth quarter. Looking ahead, exports should begin to recover as global demand rebounds and external price competitiveness pressures ease. However, in the near term, survey-based indicators point to continued weakness in euro area exports as new export orders for both manufactured goods and services remain in contractionary territory.
Euro area growth is expected to embark on a cyclical recovery over the course of this year. Barring further shocks, this recovery will initially be brought about by rising real disposable income providing support to private consumption, amid declining inflation and robust wage growth. Over the medium term the recovery will also be supported by investment, reflecting in part the gradual fading of the impact from the ECB’s monetary policy tightening.
The March 2024 ECB staff projections for the euro area foresee annual real GDP growth of 0.6% in 2024, picking up to 1.5% in 2025 and 1.6% in 2026. Compared with the December 2023 Eurosystem staff macroeconomic projections for the euro area, the outlook for GDP growth has been revised down for 2024, while remaining broadly unchanged for 2025 and 2026.[8]
3 Prices and costs
Euro area headline inflation declined to 2.6% in February 2024, from 2.8% in January. Most measures of underlying inflation had declined further in January and HICP inflation excluding energy and food did so as well in February. Nevertheless, domestic price pressures are still elevated, in part owing to robust wage growth and falling labour productivity. Measures of longer-term inflation expectations remained broadly stable in February, with most standing at around 2%. The March 2024 ECB staff macroeconomic projections for the euro area foresee that headline inflation will decline gradually, averaging 2.3% in 2024, 2.0% in 2025 and 1.9% in 2026.
According to the Eurostat flash estimate, headline inflation, as measured in terms of the Harmonised Index of Consumer Prices (HICP), declined to 2.6% in February, from 2.8% in January (Chart 9). This decline resulted from lower inflation rates for all the main components with the exception of energy inflation, which became less negative in February (‑3.7%, after ‑6.1% in January). Food inflation continued to ease, falling from 5.6% in January to 4.0% in February. This decrease reflected a lower annual rate of change in both processed and unprocessed food prices, which was particularly pronounced for the latter owing to a negative base effect from developments in 2023. HICP inflation excluding energy and food (HICPX) dropped further to 3.1% in February, down from 3.3% in January, owing to a decrease in both non-energy industrial goods (NEIG) inflation (1.6% in February, after 2.0% in January) and services inflation (3.9% in February, after 4.0% in January). The declining growth rates for processed food and NEIG reflect the continued easing of pipeline price pressures, while more persistent services inflation is related to the stronger role of labour costs in some of its items, among other factors.
Chart 9
Headline inflation and its main components
(annual percentage changes; percentage point contributions)

Sources: Eurostat and ECB calculations.
Note: The latest observations are for February 2024 (flash estimate).
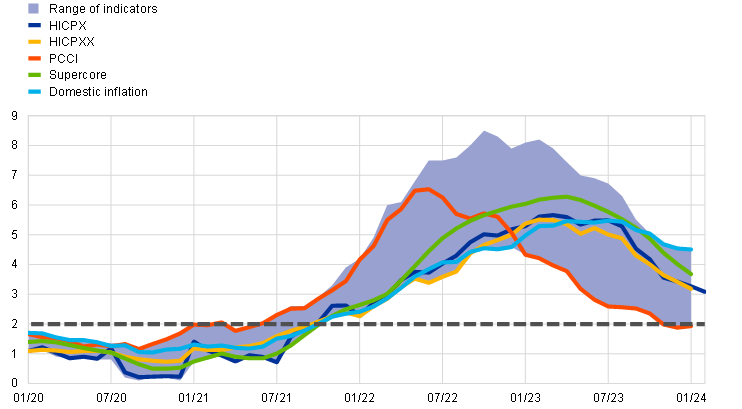
Most indicators of underlying inflation have continued to decrease according to the latest available data, reflecting the fading effects of previous shocks to energy costs and supply chain disruptions, as well as weaker demand amid tighter monetary policy (Chart 10). The indicator values ranged from 1.9% to 4.5% in January, with the Persistent and Common Component of Inflation (PCCI) at the bottom of the range and the domestic inflation indicator at the top. HICPXX inflation (which refers to HICPX inflation excluding travel-related items, clothing and footwear) decreased from 3.4% in December to 3.2% in January. The Supercore indicator, which comprises HICP items that are sensitive to the business cycle, declined from 4.0% in December to 3.7% in January, while the model-based PCCI measure was unchanged at 1.9% over the same period. The indicator for domestic inflation (excluding items with a large import content) has been the highest and most persistent measure, standing at 4.5% in December 2023 and January 2024, reflecting the relative importance of wage pressures.
Chart 10
Indicators of underlying inflation
(annual percentage changes)
Sources: Eurostat and ECB calculations.
Notes: The range of indicators of underlying inflation includes HICP excluding energy, HICP excluding energy and unprocessed food, HICPX, HICPXX, domestic inflation, 10% and 30% trimmed means, PCCI, the Supercore indicator and a weighted median. The grey dashed line represents the ECB’s inflation target of 2% over the medium term. The latest observations are for February 2024 (flash estimate) for HICPX, and January 2024 for the rest.
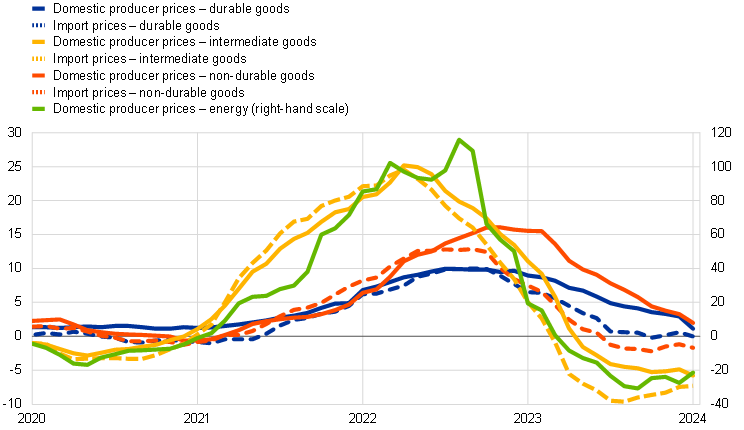
Pipeline pressures continued to ease as the cumulative effects of past shocks further dissipated (Chart 11). At the early stages of the pricing chain, producer price inflation for energy, which has been negative since March 2023, edged up to ‑21.3% in January from -27.3% in December. The annual growth rate of producer prices for domestic sales of intermediate goods also remained negative (-5.8% in January, down from -4.8% in December). The same holds for import price inflation for intermediate goods (-7.3% in January after ‑7.4% in December). Meanwhile, at the later stages of the pricing chain, domestic producer price inflation for durable consumer goods dropped to 1.1% in January, down from 2.9% in December, and the corresponding annual growth rate of import prices was zero in January, after 0.6% in December. This confirms the ongoing gradual easing of accumulated pipeline price pressures. Further easing was also observed for producer price inflation for non-durable goods, which declined further in January to 2.0%, its lowest level since May 2021. The annual growth rate of import prices for non-durable goods remained negative (-1.7% in January, after ‑1.2% in December). Non-durable consumer goods include food products, which initially recorded a faster decline in their annual rates of producer price change than non-food goods. However, more recently they have seen a convergence to non-food goods in terms of the speed of unwinding.
Chart 11
Indicators of pipeline pressures
(annual percentage changes)
Sources: Eurostat and ECB calculations.
Note: The latest observations are for January 2024.
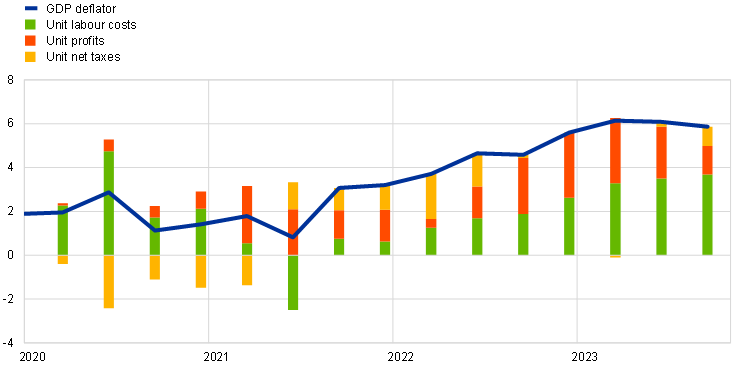
The latest data available at the time of the review suggest that domestic cost pressures, as measured by growth in the GDP deflator, have started to ease. The annual growth rate of the GDP deflator decreased to 5.9% in the third quarter of 2023, down from 6.1% in the previous quarter, owing to a smaller contribution from unit profits (Chart 12). The latest data thus corroborated the expected buffering against the stronger pressures from labour costs. The slightly stronger annual growth in unit labour costs in the third quarter reflects a more negative growth rate for labour productivity, concealing the fact that wage growth, as measured in terms of compensation per employee or per hour, had edged downwards. Information available for a large number of countries pointed to a further easing of euro area wage growth and some moderation in unit labour cost growth in the fourth quarter of 2023. [9] Negotiated wage growth decreased to 4.5% in the fourth quarter of 2023, from 4.7% in the previous quarter, confirming easing wage pressures in the latter part of the year. Data on the latest wage agreements point towards an ongoing gradual easing of wage pressures, albeit remaining at relatively high levels in the period ahead.[10]
Chart 12
Breakdown of the GDP deflator
(annual percentage changes; percentage point contributions)
Sources: Eurostat and ECB calculations.
Notes: The latest observations are for the third quarter of 2023. Compensation per employee contributes positively to changes in unit labour costs and labour productivity contributes negatively.
Survey-based indicators of longer-term inflation expectations and market-based measures of inflation compensation were also broadly unchanged with most standing at around 2% (Chart 13). In both the ECB Survey of Professional Forecasters for the first quarter of 2024 and the March 2024 ECB Survey of Monetary Analysts, average longer-term inflation expectations (for 2028) stood at 2.0%. Market-based measures of inflation compensation (based on the HICP excluding tobacco) at the longer end of the curve were stable, with the five‑year forward inflation-linked swap rate five years ahead standing at around 2.3%, down from the multi-year peak reached in early August 2023. It should, however, be noted that these market‑based measures of inflation compensation are not a direct gauge of the genuine inflation expectations of market participants, as these measures include inflation risk premia. Model-based estimates of genuine inflation expectations, excluding inflation risk premia, indicate that market participants expect inflation to be around 2% in the longer term. Market-based measures of near-term euro area inflation outcomes suggest that investors expect inflation to decline further in 2024, standing on average at 2% in the second half of the year. The one-year forward inflation-linked swap rate one year ahead was broadly unchanged over the review period, standing at 2.1%. On the consumer side, the January 2024 ECB Consumer Expectations Survey reported that median expectations for headline inflation over the next year stand at 3.3%, compared with 3.2% in December, while inflation expectations for three years ahead have remained at 2.5%.
Chart 13
Market-based measures of inflation compensation and consumers’ inflation expectations
a) Market-based measures of inflation compensation
(annual percentage changes)

b) Headline inflation and ECB Consumer Expectations Survey
(annual percentage changes)
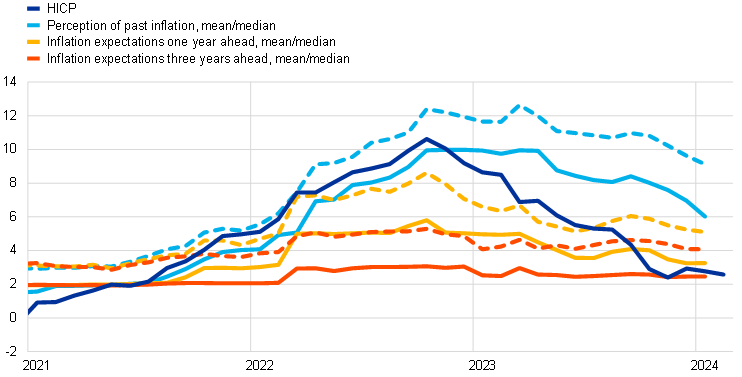
Sources: Refinitiv, Bloomberg, Eurostat, CES and ECB calculations.
Notes: Panel a) shows forward inflation-linked swap rates over different horizons for the euro area and the five-year forward break-even inflation rate five years ahead for the United States. The vertical grey line denotes the start of the review period on 14 December 2023. In panel b), dashed lines represent the mean and solid lines the median. The latest observations are for 6 March 2024 for the forward rates, February 2024 (flash estimate) for the HICP and January 2024 for the rest.
The March 2024 ECB staff macroeconomic projections expect headline inflation to moderate further, from 2.3% in 2024 to 2.0% in 2025 and 1.9% in 2026 (Chart 14).[11] This moderation reflects the continued fading of pipeline pressures as well as the impact of monetary policy tightening. Wage growth is expected to remain elevated, driven by high inflation and the tightness of the labour markets. However, nominal wage growth is projected to gradually decline, but to remain elevated, allowing for a catch-up of real wages to levels prevailing before the inflation surge, by 2025. Compared with the December 2023 projections, the projections for headline inflation have been revised down for 2024 and 2025, by 0.4 and 0.1 percentage points respectively, mainly resulting from the direct and indirect effects of lower assumptions for energy commodity prices and lower labour cost pressures. Projections for headline inflation in 2026 are unrevised. HICPX inflation is projected to ease further in the coming years and to average 2.6% in 2024, 2.1% in 2025 and 2.0% in 2026. Compared with the December 2023 projections, HICPX inflation has been revised down for the whole projection horizon. In particular, it has been revised down by 0.1 percentage point for 2024, 0.2 percentage points for 2025 and 0.1 percentage points for 2026.
Chart 14
Euro area HICP and HICPX inflation
(annual percentage changes)
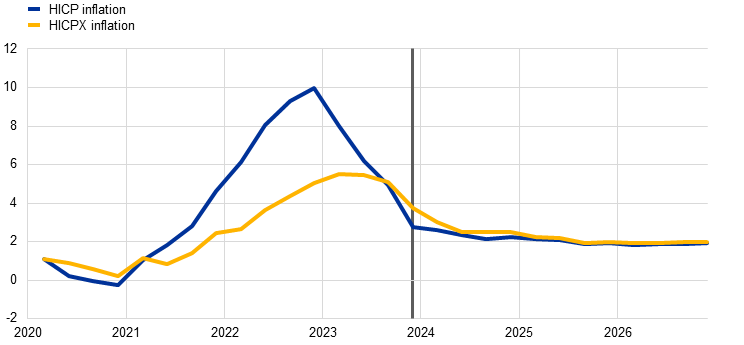
Sources: Eurostat and March 2024 ECB staff macroeconomic projections.
Notes: The vertical line indicates the start of the projection horizon. The latest observations are for the fourth quarter of 2023 for the data and the fourth quarter of 2026 for the projections. The March 2024 ECB staff macroeconomic projections for the euro area were finalised on 21 February, and the cut-off date for the technical assumptions was 9 February 2024. Both historical and actual data for HICP and HICPX inflation are at quarterly frequency.
4 Financial market developments
During the review period from 14 December 2023 to 6 March 2024 the focus in euro area financial markets remained on the timing and extent of prospective monetary policy rate cuts. Short-term risk-free rates shifted upwards as market participants revised their expectations towards later and fewer ECB policy rate cuts in 2024. Specifically, at the end of the review period, the euro short-term rate (€STR) forward curve almost fully priced in an initial rate cut of 25 basis points in the second quarter of 2024 and 100 basis points of cumulative cuts in the course of 2024. Longer-term risk-free rates initially moved lower following the December meeting but later reversed, which was also in line with a stronger repricing of the US curve as growth and inflation releases in the United States surprised to the upside. Sovereign bond yields moved about one-for-one with risk-free rates, with the dispersion of sovereign spreads over the overnight index swap (OIS) rate narrowing and the larger volumes of bond issuance being well absorbed by investors. Euro area stock prices rose slightly but underperformed their US peers, weighed down by further downward revisions to euro area earnings expectations. Finally, in foreign exchange markets the euro appreciated slightly in trade-weighted terms but depreciated a little against the US dollar.
The OIS forward curve has shifted upwards since the December Governing Council meeting as market participants revised the expected timing of the first rate cut to later in the second quarter of 2024 (Chart 15). The benchmark euro short-term rate (€STR) remained stable at 3.9% over the review period, reflecting the unchanged deposit facility rate, which the Governing Council has kept at 4% since the monetary policy meeting in September 2023. Excess liquidity decreased by around €83 billion to stand at €3,500 billion. This mainly reflected repayments of the third series of targeted longer-term refinancing operations (TLTRO III) and the decline in the asset purchase programme (APP) portfolio, as the Eurosystem no longer reinvests the principal payments from maturing securities in this portfolio. €STR-based OIS forward rates spanning the forthcoming Governing Council meetings have increased since the December meeting. This movement indicates that market participants expect the first policy rate cut to come slightly later than previously anticipated and that there will be fewer rate cuts than previously expected by the end of the year. Specifically, at the end of the review period, the forward curve almost fully priced in an initial rate cut of 25 basis points in the second quarter of 2024 and 100 basis points of cumulative cuts in the course of 2024.
Chart 15
(percentages per annum)
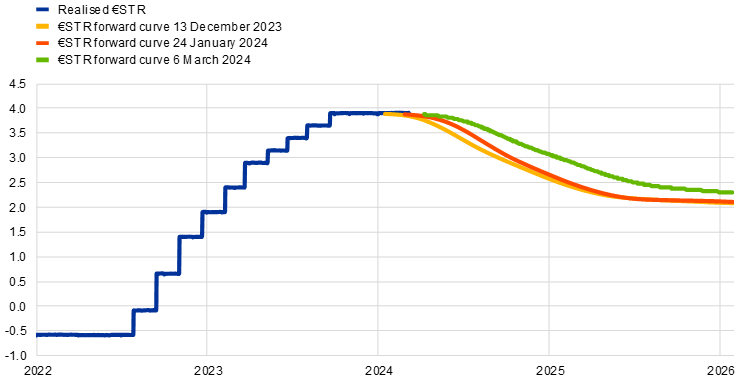
Sources: Bloomberg and ECB calculations.
Note: The forward curve is estimated using spot OIS (€STR) rates.
Euro area long-term risk-free rates increased on the back of an even stronger repricing of the US interest rate curve as the American economy remained resilient (Chart 16). Early in the review period, long-term risk-free rates declined substantially: the ten-year euro OIS rate stood about 20 basis points lower in late December than it did at the start of the review period. Subsequently, the movement in long-term euro area risk-free rates more than reversed, broadly in line with the stronger movements in US Treasury yields, partly reflecting stronger-than-expected US macroeconomic news and a reappraisal of monetary policy on both sides of the Atlantic. The ten-year euro OIS rate ultimately stood at around 2.5%, about 10 basis points above its level at the start of the review period. The ten-year US Treasury yield was up by about 19 basis points at 4.1%, while the UK equivalent rose about 21 basis points to around 4%.
Chart 16
Ten-year sovereign bond yields and the ten-year OIS rate based on the €STR
(percentages per annum)
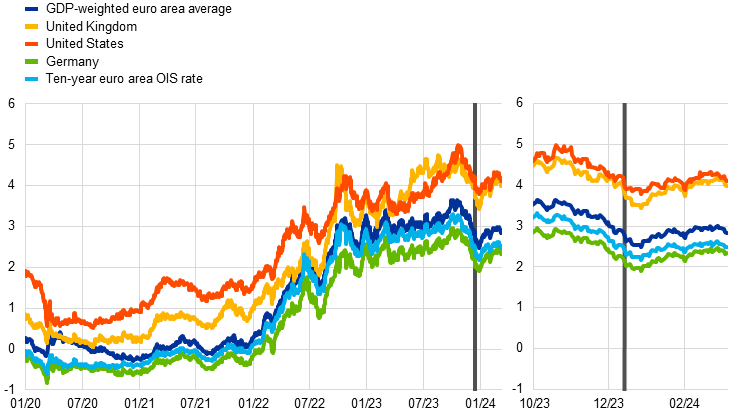
Sources: LSEG and ECB calculations.
Notes: The vertical grey line denotes the start of the review period on 14 December 2023. The latest observations are for 6 March 2024.
Euro area sovereign bond yields moved in lockstep with risk-free rates, leaving sovereign spreads little changed (Chart 17). At the end of the review period, the ten-year GDP-weighted euro area sovereign bond yield stood about 11 basis points higher at around 2.8%, leading to only a slight increase in its spread over the OIS rate based on the €STR. Sovereign spreads across countries narrowed, as some of the higher-yield sovereigns saw a decrease in spreads and the German sovereign yield narrowed its negative gap to the OIS. The review period was marked by resilience in the sovereign bond market, with the larger volumes of bond issuance being well absorbed by private investors.
Chart 17
Ten-year euro area sovereign bond spreads vis-à-vis the ten-year OIS rate based on the €STR
(percentage points)
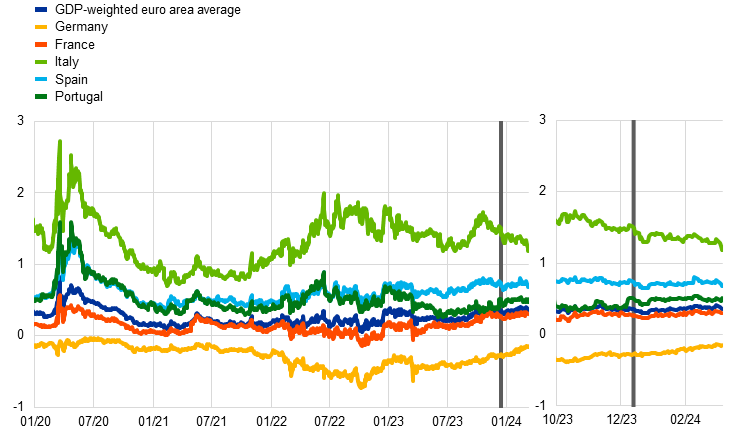
Sources: LSEG and ECB calculations.
Notes: The vertical grey line denotes the start of the review period on 14 December 2023. The latest observations are for 6 March 2024.
High-yield corporate bond spreads narrowed significantly amid favourable risk sentiment. Over the review period, spreads on high-yield corporate bonds declined significantly, by about 37 basis points, especially after the turn of the year. The decline was stronger for financial corporations than for non-financial corporations (NFCs). Spreads on investment-grade corporate bonds, by contrast, fluctuated only moderately, standing broadly unchanged. Taking a longer perspective, current levels of corporate bond spreads remain low by historical standards, especially for high-yield bonds, standing about 50 basis points below their levels in December 2021 after having risen to around 250 basis points above those levels in the course of 2022. Lower spreads helped contain the rise in the cost of market-based debt at a time of sizeable and rapid increases in risk-free rates.
Euro area equity prices strengthened, supported by market sentiment, despite further downgrades in expected earnings and slightly higher discount rates (Chart 18). Over the review period, the broad stock market index in the euro area rose, albeit less than its US counterpart. The two indices are up about 6% and 8% respectively, with nominal earnings in the euro area expected to grow significantly less than those in the United States in the course of 2024. The weaker performance in the euro area, not only over the review period but also since the trough in late October, was relatively wide-ranging, with both market capitalisation and equal-weighted indices rising by less than in the United States. While equity prices for financial corporations grew at similar rates on both sides of the Atlantic, the euro area non-financial sector underperformed its US counterpart. Euro area equity prices were supported by lower equity risk premia, which more than offset a downward revision of earnings forecasts and higher discount rates.
Chart 18
Euro area and US equity price indices
(index: 1 January 2020 = 100)
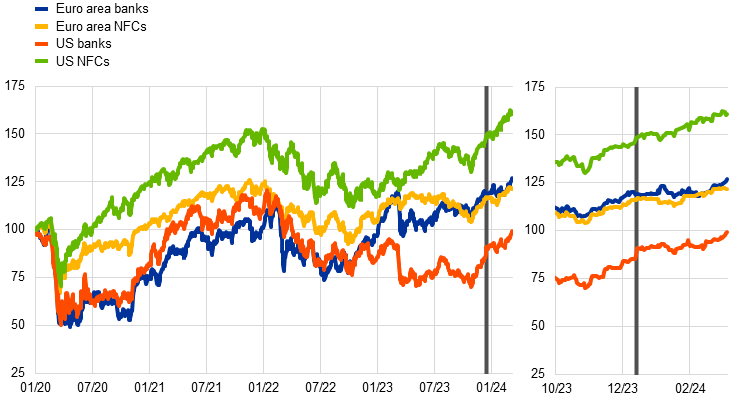
Sources: LSEG and ECB calculations.
Notes: The vertical grey line denotes the start of the review period on 14 December 2023. The latest observations are for 6 March 2024.
In foreign exchange markets, the euro appreciated slightly in trade-weighted terms but depreciated a little against the US dollar (Chart 19). During the review period, the nominal effective exchange rate of the euro – as measured against the currencies of 41 of the euro area’s most important trading partners – appreciated by 0.8%. The slight appreciation of the euro reflects gains against the currencies of several advanced economies (e.g. by 5% against the Japanese yen), emerging economies and non-euro area EU Member States. By contrast, the euro depreciated slightly against the US dollar (by 0.4%) amid intra-period fluctuations, reflecting mostly changes in market participants’ expectations about relative economic strength and policy rates. Between mid-December and the turn of the year, the euro appreciated against the US dollar, as market participants interpreted the December Federal Open Market Committee (FOMC) meeting as a dovish pivot, while strengthened risk appetite weighed on the US dollar. Since the start of 2024 the euro has depreciated against the US dollar, reflecting the stronger economic resilience of the United States compared to the euro area, and market participants lowered expectations of imminent US rate cuts following a more cautious Federal Reserve System communication at the January FOMC meeting. That interpretation was further re-enforced by robust US labour market data and a higher-than-expected US consumer price index print in February.
Chart 19
Changes in the exchange rate of the euro vis-à-vis selected currencies
(percentage changes)
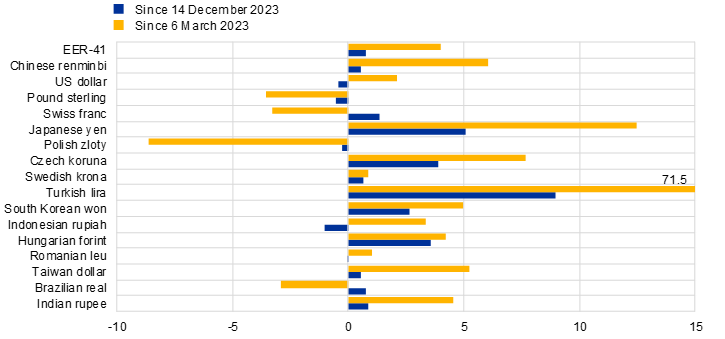
Source: ECB.
Notes: EER-41 is the nominal effective exchange rate of the euro against the currencies of 41 of the euro area’s most important trading partners. A positive (negative) change corresponds to an appreciation (depreciation) of the euro. All changes have been calculated using the foreign exchange rates prevailing on 6 March 2024.
5 Financing conditions and credit developments
After declining in the fourth quarter of 2023, composite bank funding costs edged up again in January 2024, remaining at a high level by historical standards. Over the review period from 14 December 2023 to 6 March 2024, the cost to non-financial corporations (NFCs) of market-based debt increased slightly, while that of equity declined marginally. Bank lending rates for firms were broadly unchanged, while those for households for house purchase decreased somewhat. The annual growth rate of broad money (M3) remained close to zero, driven by high opportunity costs, stagnant lending and the reduction in the Eurosystem balance sheet.
Euro area bank funding costs remained at a high level by historical standards, despite declining bond yields. In January 2024 the composite cost of debt financing for euro area banks again edged up slightly, amid considerable cross-country heterogeneity, after coming down from the peak reached in October 2023 (Chart 20, panel a). Having fallen significantly in the fourth quarter of 2023, bank bond yields rebounded in the first quarter of 2024 (Chart 20, panel b), reflecting similar changes in the risk-free curve (see Section 4). In January 2024 (aggregate) deposit rates, which account for the bulk of composite bank funding costs, rose further, amid variation across instruments and sectors. While rates on overnight deposits increased modestly, rates on time deposits fell in January, resulting in a slight narrowing of the large spread between time and overnight deposits. Intensifying competition among banks for customer deposits pushed up deposit funding costs for banks. For retail lenders, which are highly dependent on deposit funding, the costs continued to rise owing to the sustained upward pressure stemming from the weakness in aggregate deposit volumes. By contrast, banks reliant on wholesale funding benefited more from the decline in bank bond yields in the fourth quarter of 2023, although they had also experienced a larger and faster increase in deposit funding costs in the early stages of the tightening cycle. In general, the composition of bank liabilities has continued to shift towards more expensive funding sources. Furthermore, liquidity has been mechanically drained from the financial system given that the Eurosystem balance sheet has continued to normalise.
Chart 20
Composite bank funding costs in selected euro area countries
(annual percentages)
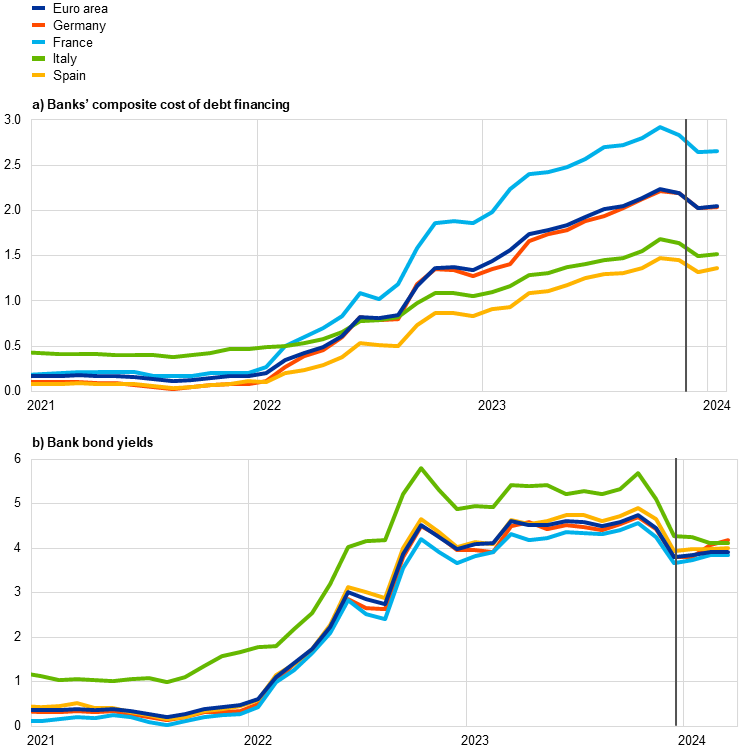
Sources: ECB, S&P Dow Jones Indices LLC and/or its affiliates, and ECB calculations.
Notes: Composite bank funding costs are a weighted average of the composite cost of deposits and unsecured market-based debt financing. The composite cost of deposits is calculated as an average of new business rates on overnight deposits, deposits with an agreed maturity and deposits redeemable at notice, weighted by their respective outstanding amounts. Bank bond yields are monthly averages for senior-tranche bonds. The vertical grey line in panels a) and b) denotes 31 October 2023. The latest observations are for January 2024 for banks’ composite cost of debt financing and for 6 March 2024 for bank bond yields.
In January 2024 bank lending rates for firms remained broadly unchanged, while those for households for house purchase decreased. Lending rates for both firms and households across euro area countries started to rise sharply at the beginning of 2022 and have shown signs of stabilising at these high levels since November 2023 (Chart 21). In January 2024 lending rates for firms stood at 5.22%, compared with 5.25% in December 2023, while those on new loans to households for house purchase recorded a modest decline, falling to 3.87% in January, down from 3.97% in December. This decline was widespread across the largest euro area countries and was more pronounced for loans with medium and longer-term fixation periods. Variations in the size of the decline helped to reduce lending rate dispersion. At the same time, bank rates on new loans to households for consumption and for overdrafts and consumer credit continued to rise in January. The cross-country dispersion of lending rates for firms and households remained at a low level (Chart 21), suggesting smooth monetary policy transmission across euro area countries. As higher bank lending rates continue to feed through to outstanding amounts of loans for house purchase and as debt servicing costs rise, an increasing proportion of households, especially among the lower income quintiles, reported in the ECB’s Consumer Expectations Survey in January 2024 that they expect to face difficulties in meeting their mortgage payments over the next three months.
Chart 21
Composite bank lending rates for NFCs and households in selected countries
(annual percentages; standard deviation)

Sources: ECB and ECB calculations.
Notes: Composite bank lending rates are calculated by aggregating short and long-term rates using a 24-month moving average of new business volumes. The cross-country standard deviation is calculated using a fixed sample of 12 euro area countries. The latest observations are for January 2024.
Daily data for the review period – 14 December 2023 to 6 March 2024 – show a slight increase in the cost to NFCs of market-based debt and a marginal decline in that of equity. Based on monthly data, the overall cost of financing for NFCs for January 2024 – i.e. the composite cost of bank borrowing, market-based debt and equity – fell considerably from the multi-year high reached in October 2023, to stand at 6.0%, namely 10 basis points lower than in December (Chart 22).[12] This was due primarily to the decline in the cost of equity, given that there was no significant change in any of the other cost components. According to the daily data, the cost of market-based debt increased over the review period, owing to a rise in the risk-free rate that was not fully offset by a compression of the spreads on NFC bonds in the high-yield segments. At the same time, the cost of equity financing fell slightly, reflecting a decline in the equity risk premium that outweighed the above-mentioned increase in the risk-free rate (approximated by the ten-year overnight index swap rate) (see Section 4).
Chart 22
Nominal cost of external financing for euro area NFCs, broken down by component

Sources: ECB, Eurostat, Dealogic, Merrill Lynch, Bloomberg, Thomson Reuters and ECB calculations.
Notes: The overall cost of financing for non-financial corporations (NFCs) is based on monthly data and is calculated as a weighted average of the cost of borrowing from banks (monthly average data), market-based debt and equity (end-of-month data), based on their respective outstanding amounts. The latest observations are for 6 March 2024 for the cost of market-based debt and the cost of equity (daily data), and for January 2024 for the overall cost of financing and the cost of borrowing from banks (monthly data).
Bank lending to firms and households stabilised at low levels in January 2024, amid high lending rates, subdued loan demand and tight credit standards. Annual growth in loans to NFCs declined to 0.2% in January 2024, down from 0.5% in December 2023 (Chart 23, panel a), amid considerable cross-country heterogeneity. At the same time, volatility has been rising, as reflected in the strong contraction in short-term lending in January that reversed an increase of similar proportions over the previous two months. Overall, the ongoing weakness in loan growth remains in line with the stagnant lending dynamics observed since the beginning of 2023 on the back of weak aggregate demand, tight credit standards and restrictive monetary policy. The annual growth rate of loans to households edged down to 0.3% in January 2024, from 0.4% in December 2023 (Chart 23, panel b), amid negative housing market prospects, somewhat tighter credit standards and high lending rates. This decline was driven mainly by housing loans and loans to sole proprietors (i.e. unincorporated small businesses), while consumer loan growth remained stable, owing primarily to demand from the lower income quintiles, which was reflected in an increase in loan application rejections. Moreover, the results of the ECB’s Consumer Expectations Survey in January 2024 suggest that a large net percentage of survey respondents perceived credit standards to be tight and expected housing loans to become harder to obtain over the next 12 months.
Chart 23
MFI loans in selected euro area countries
(annual percentage changes; standard deviation)
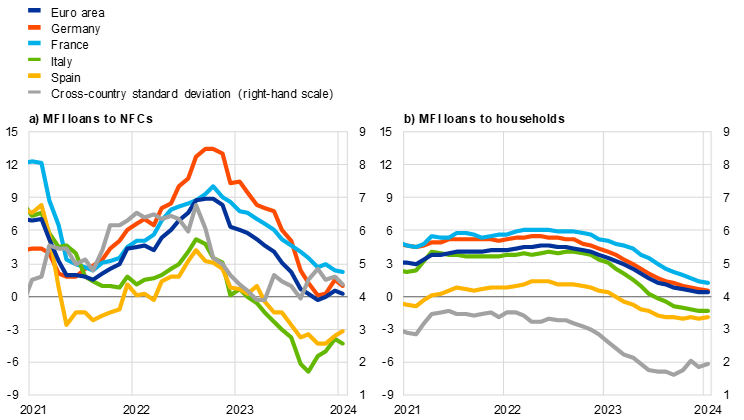
Sources: ECB and ECB calculations.
Notes: Loans from monetary financial institutions (MFIs) are adjusted for loan sales and securitisation; in the case of non-financial corporations (NFCs), loans are also adjusted for notional cash pooling. The cross-country standard deviation is calculated using a fixed sample of 12 euro area countries. The latest observations are for January 2024.
Growth in net external financing of euro area firms remained weak in the fourth quarter of 2023 and in January 2024, reflecting low levels of debt financing. While the annual growth rate of net external financing increased from ‑0.9% in October 2023 to 0.8% in January 2024, the monthly flow again turned negative in January (Chart 24). Unlike previous episodes of weak loan dynamics, corporate bond issuance did not make up for the overall decline in bank loans. In January loan demand by firms related primarily to short-term maturities, with longer-term loans being replaced by corporate bonds. Moreover, the issuance of listed shares continued to be muted.
Chart 24
Net external financing flows for euro area NFCs
(monthly flows; EUR billions)
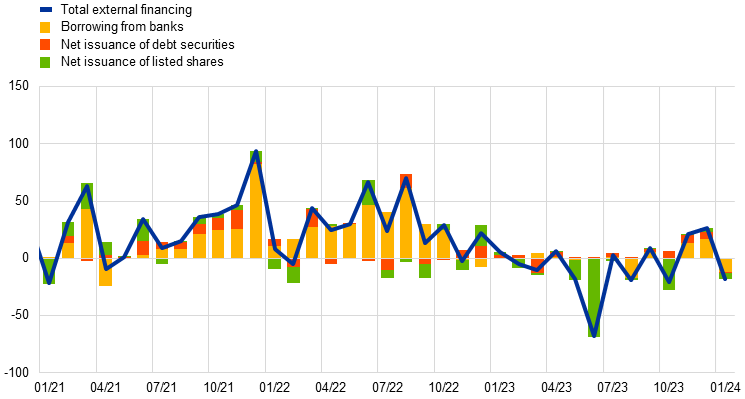
Sources: ECB, Eurostat, Dealogic and ECB calculations.
Notes: Net external financing is the sum of borrowing from banks (MFI loans), net issuance of debt securities and net issuance of listed shares. MFI loans are adjusted for loan sales, securitisation and cash-pooling activities. The latest observations are for January 2024.
Firms and households continued to reallocate overnight deposits to time deposits in January 2024. The annual growth rate of overnight deposits continued to contract and stood at ‑9.9% in January 2024, down from ‑9.7% in December 2023 (Chart 25). The strong preference for time deposits is explained by the sizeable spread between the rates on time deposits and those on overnight deposits, reflecting the large opportunity costs of holding highly liquid instruments.[13] In January the rates offered to firms for holding time deposits were close to the ECB’s deposit facility rate and remained above those for households. There was another large monthly shift from overnight to time deposits for households and a pick-up in the pace at which firms rebalanced these two instruments, which had slowed considerably in the fourth quarter of 2023.
Chart 25
(annual percentage changes, adjusted for seasonal and calendar effects)
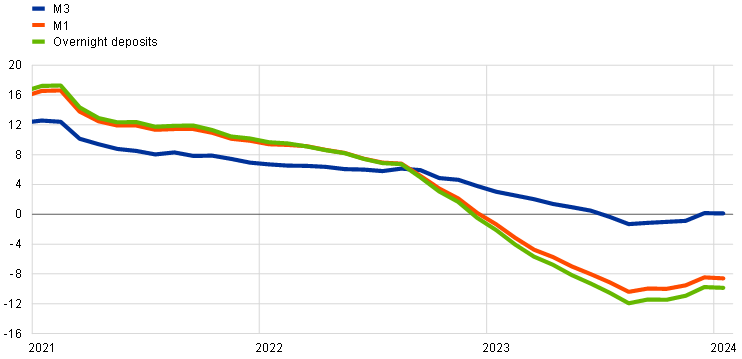
Source: ECB.
Note: The latest observations are for January 2024.
In January 2024 the annual growth rate of M3 remained close to zero, driven by high opportunity costs, stagnant lending and the reduction in the Eurosystem balance sheet. M3 growth in the euro area declined marginally and stood at 0.1% in January 2024, down from 0.2% in December 2023 (Chart 25). In January annual narrow money (M1) growth, which comprises the liquid assets of M3, fell slightly, to stand at ‑8.6%, down from ‑8.5% in December. After a relatively large inflow in the fourth quarter of 2023, M3 recorded a sizeable monthly outflow in January, amid increasing volatility and portfolio shifts out of M3 that reinforced weak monetary dynamics. The January outflow reflected a partial reversal of bank government bond purchases in December, matched by an increase in government bonds held by the money holding sector, and the renewed issuance of long-term bank bonds ahead of the upcoming repayment of TLTRO funds in March 2024. These outflows were offset partly by larger inflows from abroad that reflected a sizeable current account surplus, amid weak imports, and increased interest in euro area securities among foreign investors. Moreover, the reduction in the Eurosystem balance sheet continued to have a contractionary effect on money creation, alongside stagnant lending to the private sector.
6 Fiscal developments
According to the March 2024 ECB staff macroeconomic projections, the euro area general government budget deficit will improve moderately to 2.9% of GDP in 2024 but only marginally thereafter, levelling off at 2.8% in 2025 and 2026. The gradual reduction in the budget deficit registered since the height of the pandemic is thus projected to come to a halt and even to increase slightly. Broadly reflecting these developments, the euro area fiscal stance is projected to tighten significantly in 2024 but almost no further thereafter. This tightening of the fiscal stance reflects the fact that governments are expected to continue to roll back energy-related support measures. Since this tightening is not set to continue beyond 2024, the ratio of euro area debt-to-GDP is projected to remain elevated, increasing marginally over the projection horizon, from an estimated 88.3% in 2023 to around 88.6% in 2026. On 21 February 2024, the Commission published the mid-term evaluation of the Recovery and Resilience Facility (RRF). While some progress is highlighted, it remains important to accelerate the implementation of the NGEU programme to reap its full potential. Following the recent provisional political agreement between the ECOFIN Council and the European Parliament on the reform of the EU’s economic governance framework, the legislative process should be concluded swiftly so that the new rules can be implemented without delay.
According to the March 2024 ECB staff macroeconomic projections, the euro area general government budget balance will improve moderately in 2024 but only marginally in 2025.[14] According to the projections, the euro area budget deficit is estimated to have declined from 3.6% of GDP in 2022 to 3.2% of GDP in 2023 and will continue declining to 2.9% of GDP in 2024 and to 2.8% in 2025 where it will remain in 2026 (Chart 26). The projected path mainly reflects a less negative cyclically adjusted primary balance in 2024 and to a small extent also in 2025. The lower primary deficits are only partly compensated by increasing interest expenditures as the pass-through of past interest rate increases will be gradual, owing to long sovereign debt residual maturities, for which the euro area average is currently just below 8 years (up from 6.5 years in 2015). The fall in the cyclically adjusted primary deficit in 2024 is in turn largely driven by the scaling back of government fiscal support measures as the energy shock and high inflation fade. It is now estimated that, at the euro area level, these measures amounted to 1.3% of GDP in 2023, will decline significantly to 0.4% of GDP in 2024 and will decline further to around 0.2% of GDP in 2025 and 2026.
Chart 26
Budget balance and its components
(percentages of GDP)

Source: March 2024 ECB staff macroeconomic projections for the euro area.
Note: The data refer to the aggregate general government sector of all 20 euro area countries (including Croatia).
Compared with the December 2023 Eurosystem staff macroeconomic projections, the budget balance has been revised down marginally by 0.1 percentage points per annum in 2023, 2024 and 2025 and by 0.2 percentage points in 2026. These revisions can be attributed to downward revisions of the cyclical component over the whole projection horizon (by between 0.1 and 0.2 percentage points per annum), which is partly compensated by downward revisions in interest payments due to more favourable financing conditions.
The euro area fiscal stance is projected to tighten notably in 2024 but not much afterwards.[15] The annual change in the cyclically adjusted primary balance, adjusted for grants extended to countries under the NGEU programme, points to a significant tightening of fiscal policies in the euro area in 2023 and 2024 taken together as a large share of the energy and inflation support measures introduced in 2022 are phased out. In the outer years of the forecast horizon, 2025 and 2026, the fiscal stance is expected to be neutral. Despite the ongoing unwinding of energy-related support measures, the level of fiscal support in the euro area is expected to remain largely accommodative over the whole projection horizon given that the cyclically adjusted budget balance remains well below its pre-pandemic level due to expansionary measures taken during the crisis that have to date proven to be lasting.
The ratio of euro area government debt-to-GDP is projected to remain above its pre-pandemic level and to even increase slightly over the projection horizon from an estimated 88.3% in 2023 to 88.6% in 2026. During the pandemic, the debt ratio increased significantly to around 97% in 2020 but has gradually fallen since. However, this improving trend seems to have ground to a halt, and the debt ratio is instead expected to increase marginally over the projection horizon, driven by primary deficits and expected positive deficit-debt adjustments, which are only partly compensated by still negative interest rate-growth differentials (Chart 27).
Chart 27
Drivers of change in euro area government debt
(percentages of GDP, unless otherwise indicated)
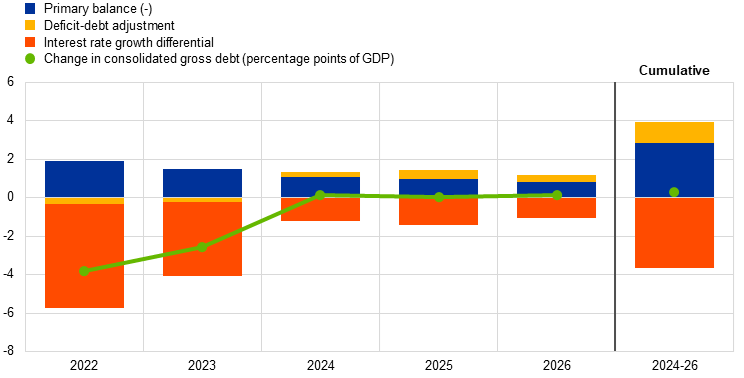
Source: March 2024 ECB staff macroeconomic projections for the euro area.
Note: The data refer to the aggregate general government sector of all 20 euro area countries (including Croatia).
It is important that governments make swift progress on both NGEU implementation and on the EU’s reformed economic governance framework. On 21 February 2024, the Commission published the mid-term evaluation of the Recovery and Resilience Facility (RRF). While the evaluation highlights some progress in implementing the NGEU programme, it also acknowledges that there have to date been delays in disbursements and investments, leading to a significantly lower positive growth impact than anticipated at the outset. Accelerating implementation of the NGEU programme to reap its full potential is now crucial. Finally, following the recent provisional political agreement between the ECOFIN Council and the European Parliament on the reform of the EU’s economic governance framework, the legislative process should be concluded swiftly so that the new rules can be implemented without delay.
Boxes
1 Speculation in oil and gas prices in times of geopolitical risks
Large movements in oil and gas prices, coupled with higher price volatility amid the pandemic, the war in Ukraine and rising geopolitical tensions in the Middle East, have raised the question of to what extent speculation is driving oil and gas prices. Oil and gas prices have increased significantly since the pandemic came to an end, with large-scale price volatility seen during the post-pandemic recovery. More recently, renewed concerns of heightened price volatility have been triggered by the terrorist attacks in Israel and the rising tensions in the Red Sea, albeit to a lesser extent than in the post-pandemic recovery period, putting some upward pressure on Brent oil prices (Chart A, panel a).[16] Yet, at the current juncture, upside pressure on oil prices from geopolitical tensions and OPEC+ cuts is being offset by weak demand and higher non-OPEC production. Although gas prices have also reacted to recent geopolitical tensions, they have remained well below 2022 levels. Against this background, attention has again turned to trying to understand the drivers of oil and gas prices. Of particular interest is the question of whether prices mainly reflect fundamental factors (i.e. global supply and demand for oil and gas) or more non-fundamental factors related to speculative positioning. The topic has been heavily debated for more than two decades, with some observers pointing to speculation and the financialisation of commodity markets as the main drivers behind spikes in oil prices. Academic studies, however, do not generally find strong evidence of financial speculation playing an important role.[17]
See more2 How geopolitics is changing trade
Rising trade tensions and a spate of policies aiming to bring national security concerns to bear in trade relations have sparked growing concern about the potential implications of geo-economic fragmentation.[18] Since the global financial crisis, trade has been growing more slowly than GDP, ushering in an era of “slowbalisation” (Chart A, panel a).[19] This process has been attributed, among other factors, to: diminishing marginal benefits of global value chain integration, a structural shift in demand from manufacturing to services, and weakening political support for open trade. Indeed, a surge in trade restriction measures has been evident in recent years.[20] Concerns about trade resilience and national security have been heightened in the wake of Russia's invasion of Ukraine, with growing debate about the need for protectionism, near-shoring, or friend-shoring. Some recent industrial policies contain provisions that aim at providing incentives to domestic producers, especially those in technologically advanced sectors – possibly to the detriment of foreign producers. At the same time, model-based assessments illustrate that restrictions on trade in intermediate inputs between countries belonging to opposing geopolitical blocs could entail sizeable economic costs in terms of lower trade and welfare as well as higher prices.[21]
See more3 How have households adjusted their spending and saving behaviour to cope with high inflation?
Households have faced several shocks over the last few years and have adjusted their behaviour through different margins. The episode of high inflation over the past couple of years was triggered by a combination of factors, including supply bottlenecks caused by the pandemic and the surge in energy prices following Russia’s invasion of Ukraine. The inflationary shock affected consumers’ behaviour and weighed on their spending. In general, consumers employ different strategies to cope with higher prices – by adjusting their consumption, reducing their savings and/or increasing their income. This box uses evidence from the ECB’s Consumer Expectations Survey (CES) to investigate how households have reacted to the recent inflationary episode through these margins of adjustment.
See more4 What were the drivers of euro area food price inflation over the last two years?
Food price inflation was one of the main contributors to the strong rise in euro area headline inflation in 2022 and, once food inflation started to decline, also to the disinflation thereafter. Food inflation increased to a historical peak of around 15% in March 2023, surpassed only by the earlier surge in energy inflation (Chart A). Since then, food inflation has declined, falling to 5.7% in January 2024, but is still above its pre-pandemic long-term average of 2.1%.[22] Food accounts for around 20% of expenditure in the overall Harmonised Index of Consumer Prices (HICP) basket and largely represents consumption “necessities”. This means that the surge in HICP food inflation had implications for household purchasing power, affecting those with lower incomes in particular. This box examines the main factors behind recent food price developments.
See more5 An update on the accuracy of recent Eurosystem/ECB staff projections for short-term inflation
Forecasting inflation has been extremely challenging in recent years given the large shocks hitting the euro area economy. The extraordinary series of shocks seen post-2019 – including the coronavirus (COVID-19) pandemic and Russia’s war against Ukraine – led to a surge in inflation. These shocks were exceptional in nature and so large in scale that assessing their transmission through the economy and into consumer prices in real time posed significant challenges. Importantly, several of the shocks were outside the historical distributions, severely limiting extrapolation from past patterns. In order to provide a better indication of the uncertainty involved, Eurosystem/ECB staff projections began setting out alternative scenarios during this period.[23]
See more6 Liquidity conditions and monetary policy operations from 1 November 2023 to 30 January 2024
This box describes liquidity conditions and the Eurosystem monetary policy operations during the seventh and eight reserve maintenance periods of 2023. Together, these two maintenance periods ran from 1 November 2023 to 30 January 2024 (the “review period”).
See more7 The euro as a global currency: a payments perspective
The ECB monitors developments in the international role of the euro and publishes the resulting information on a regular basis. The ECB’s most recent report on this topic (which was published in June 2023) showed no significant change in the international role of the euro in 2022 relative to 2021, with the share of the euro in total international currency use averaging close to 20% across various indicators, in line with the previous year.[24] The report showed that the euro was continuing to play an important role in the international monetary system, as it remained the second most important currency in various market segments, such as official holdings of foreign exchange reserves and international bond issuance.
See more8 The ECB’s climate and nature plan 2024-2025
On 30 January 2024 the ECB published its climate and nature plan 2024-2025, which identifies three new focus areas that will guide its climate actions over the next two years. This box explains the economic reasoning behind the ECB’s decision to advance its work in these three areas.[25]
Climate change is increasingly affecting the euro area economy. The world is way off-track in terms of meeting the climate targets consistent with the 2015 Paris Agreement.[26] 2023 was the warmest year ever recorded, and several extreme weather events caused economic damage in Europe and across the world. In parallel, accelerated biodiversity loss and degradation of habitats are contributing to a rapidly evolving crisis for nature, partially owing to the inextricable links between climate and nature. Climate change and the related need to foster the green transition are increasingly affecting the economy and the financial system. This may have implications for price stability, financial stability and the transmission of monetary policy. Climate change also affects the value and risk profile of assets on the Eurosystem balance sheet. It is essential for the ECB to account for these effects in order to deliver on its primary objective of price stability.
See moreArticles
1 The impact of recent shocks and ongoing structural changes on euro area productivity growth
The COVID-19 pandemic and the energy crisis have interacted with the ongoing transition to a greener and more digital economy, with uncertain impacts on productivity growth. During the acute phase of the pandemic, productivity per employee fell as a result of labour hoarding and reduced capacity utilisation. The rapid policy responses to the pandemic-induced crisis at the national and European levels prevented a wave of bankruptcies, but also possibly inhibited productivity-enhancing reallocation of resources. The pandemic changed the ways in which firms invest and produce and people consume and work, triggering an acceleration of the ongoing digitalisation of the euro area economy, also supported by the Next Generation EU (NGEU) funds. These changes can have substantial and positive impacts on productivity, but further investments in complementary skills and intangibles are needed to reap their full benefits. In addition, the energy price shock that followed the Russian invasion of Ukraine and the transition to a greener economy are changing relative prices of inputs and affecting the production and investment decisions of firms, with a bearing on their productivity. The impact is expected to be negative over the short term but, given the need for production processes to adapt, green innovation might lift productivity prospects over the longer term.
See more2 Is there a digital divide in payments? Understanding why cash remains important for so many
Is the constant trend towards the digitalisation of payments creating a binary world of digital “haves” and analogue “have-nots”? By assessing payment patterns in the euro area using detailed survey data, the results presented in this article challenge two prevailing assumptions. First, we contest the idea that cash is only used by people who are less connected to the digital world, by illustrating high cash usage across people with access to digital payment tools. Second, we revisit the notion that the digitalisation of payments is a uniform process, by showing that people with more limited access to digital payment tools have diverse sociodemographic profiles. Furthermore, results show that adoption of digital payment tools is not driven solely by supply-side limitations, hinting at the significant role of personal choice and the persistence of habits. The insights gained enrich our understanding beyond a one-size-fits-all approach to everyday payments in the digital age. The findings are in line with the approach adopted by the Eurosystem to cash and payments, which aims to ensure the availability and acceptance of cash while embracing digital innovation.
See moreStatistics
https://www.ecb.europa.eu/pub/pdf/ecbu/ecb.eb_annex202402~790cfab780.en.pdf© European Central Bank, 2024
Postal address 60640 Frankfurt am Main, Germany
Telephone +49 69 1344 0
Website www.ecb.europa.eu
All rights reserved. Reproduction for educational and non-commercial purposes is permitted provided that the source is acknowledged.
For specific terminology please refer to the ECB glossary (available in English only).
The cut-off date for the statistics included in this issue was 6 March 2024.
PDF ISSN 2363-3417, QB-BP-24-002-EN-N
HTML ISSN 2363-3417, QB-BP-24-002-EN-Q
Given the focus of this section on developments in the global environment, all references to world and/or global aggregate economic indicators exclude the euro area.
Developments in global manufacturing of technological goods such as computers, electronic and electrical equipment are thought to offer insights into future developments in the global manufacturing sector and the global economy more broadly. See the box entitled “What the maturing tech cycle signals for the global economy”, Economic Bulletin, Issue 3, ECB, 2019.
For a detailed assessment of the Red Sea disruptions and their impact on the global economy and the euro area, see Box 3 of “ECB staff macroeconomic projections for the euro area, March 2024”, published on the ECB’s website on 7 March 2024.
The expenditure breakdown of GDP for the fourth quarter of 2023 was published after the cut-off date for the data included in this issue of the Economic Bulletin.
The country coverage for the GDP expenditure breakdown is around 89%.
See the box entitled “How have households adjusted their spending and saving behaviour to cope with high inflation?” in this issue of the Economic Bulletin.
Data made available after the cut-off date for this issue broadly confirm this trend.
See “ECB staff macroeconomic projections for the euro area, March 2024”, published on the ECB’s website on 7 March 2024.
The cut-off date for data included in this issue of the Economic Bulletin was 6 March 2024. National accounts data released on 8 March 2024 saw weaker annual growth in compensation per employee in the fourth quarter of 2023 (4.6% after 5.1% in the third quarter) and in unit labour costs (5.8% after 6.5% in the third quarter).The annual growth rate of the GDP deflator decreased to 5.3% in the fourth quarter of 2023, down from 5.9% in the third quarter, and included also a decrease in unit profit growth to 2.8% from 4.7%.
See Górnicka and Koester (editors), “A forward-looking tracker of negotiated wages in the euro area”, Occasional Paper Series, No 338, ECB, February 2024.
See the March 2024 ECB staff macroeconomic projections for more details.
Owing to lags in the data availability for the cost of borrowing from banks, data on the overall cost of financing for NFCs are only available up to January 2024.
As in previous tightening cycles, interest rates on overnight deposits have adjusted to policy rate changes more slowly than those on time deposits. See also the box entitled “Monetary dynamics during the tightening cycle”, Economic Bulletin, Issue 8, ECB, 2023.
See “ECB staff macroeconomic projections for the euro area, March 2024”, published on the ECB’s website on 7 March 2024.
The fiscal stance reflects the direction and size of the stimulus from fiscal policies to the economy beyond the automatic reaction of public finances to the business cycle. It is measured here as the change in the cyclically adjusted primary balance ratio net of government support to the financial sector. Given that the higher budget revenues related to Next Generation EU (NGEU) grants from the EU budget do not have a contractionary impact on demand, in this context the cyclically adjusted primary balance is adjusted to exclude those revenues. For more details on the euro area fiscal stance, see the article entitled “The euro area fiscal stance”, Economic Bulletin, Issue 4, ECB, 2016.
For an estimate of the oil price reaction to geopolitical shocks, see the box entitled “Geopolitical risk and oil prices”, Economic Bulletin, Issue 8, ECB, 2023.
See, for example, Kilian, L., “Not All Oil Price Shocks Are Alike: Disentangling Demand and Supply Shocks in the Crude Oil Market”, American Economic Review, Vol. 99, No 3, 2009, pp. 1053-1069, and Vansteenkiste, I., “What is driving oil futures prices? Fundamentals versus speculation”, Working Paper Series, No 1371, ECB, 2011.
See, for example, Aiyar, S., Chen, J., Ebeke, C. H., Garcia-Saltos, R., Gudmundsson, T., Ilyina, A. and Trevino, J. P. (2023), “Geoeconomic Fragmentation and the Future of Multilateralism”, Staff Discussion Notes, No 2023/001, International Monetary Fund, Washington, DC.
See Antràs, P. (2021), “De-globalisation? Global Value Chains in the Post-COVID-19 Age”, in Central Banks in a Shifting World: Conference Proceedings – ECB Forum.
See ICC (2023), “ICC 2023 Trade Report: A fragmenting world”, International Chamber of Commerce.
See Attinasi, M. G., Boeckelmann, L., and Meunier, B. (2023), “The economic costs of supply chain decoupling”, Working Paper Series, ECB, No 2023/2389.
Previous peaks in annual food price inflation reflected health concerns associated with animal diseases (5.6% in early 2002) and a rise in global food commodity and fertiliser prices (6.1% in 2008). For a review of food price developments during the COVID-19 pandemic, see the box entitled “Recent developments in euro area food prices”, Economic Bulletin, Issue 5, ECB, 2020, and the box entitled “The surge in euro area food inflation and the impact of the Russia-Ukraine war”, Economic Bulletin, Issue 4, ECB, 2022.
In 2020 and 2021, each set of quarterly staff projections included scenario analyses based on alternative assumptions regarding the future evolution of the COVID-19 pandemic and its economic consequences. In 2022, alternative scenarios focused on the economic consequences of the war in Ukraine, especially as regards uncertainties about energy supply. More recently, the scenario analysis has focused on more specific risks, such as a slowdown in the Chinese economy or a potential escalation of the conflict in the Red Sea area.
See “The international role of the euro”, ECB, 2023.
See the ECB’s climate and nature plan 2024-2025, ECB, January 2024.
Under the Paris Agreement signed in 2015, 196 countries agreed to do their part to hold the increase in the global average temperature to well below 2°C above pre-industrial levels and pursue efforts to limit the temperature increase to 1.5°C. Under the agreement, Europe committed to reducing its carbon emissions to net-zero by 2050 and by 55% by 2030 compared to 1990 levels. To achieve the 2030 target, the European Union agreed on the Green Deal and a climate mitigation package, also known as the “Fit-for-55” package. Despite these efforts, estimates indicate that global warming under current national determined contributions will reach 2.9°C, see United Nations Environment Programme, “Emissions Gap Report 2023”, Report, November 2023.