
8 January 2024
- New experimental statistics on distribution of household wealth in euro area provide quarterly information to policy makers, in line with national accounts
- First new data show that household net wealth in euro area increased by 29% over last five years, with homeowners’ net wealth increasing more than that of non-homeowners
- Inequality, as measured for example by share of wealth held by top 5% versus bottom 50%, decreased slightly over past five years
The European Central Bank (ECB) has today published experimental statistics on Distributional Wealth Accounts (DWA) to provide quarterly and timely household distributional information that is consistent with the national accounts. The new data have been developed to support the ECB’s 2021 monetary policy strategy, which aims to include a systematic assessment of the two-way interaction between income and wealth distributions and monetary policy[1]. The release also follows recommendations of the G20 Data Gaps Initiative[2].
The DWA link household-level information from the Household Finance and Consumption Survey (HFCS) to macroeconomic information available in the sector accounts and therefore complement existing household survey data. The data will be compiled every quarter and published five months after the end of each period.
The DWA provide data on net wealth, total assets and liabilities[3] and their components. Households are broken down into the top five deciles of net wealth and the bottom 50% as well as by employment and housing status.
Through these data, it is possible to analyse the effects of, for example, growing housing wealth and the rising value of listed shares on the distribution of household wealth. The DWA results show that the increase in housing wealth in recent years has been more equally distributed than the increase in the value of listed shares (Chart 1).
Chart 1: Housing wealth (left) and listed shares (right), by net wealth decile, euro area
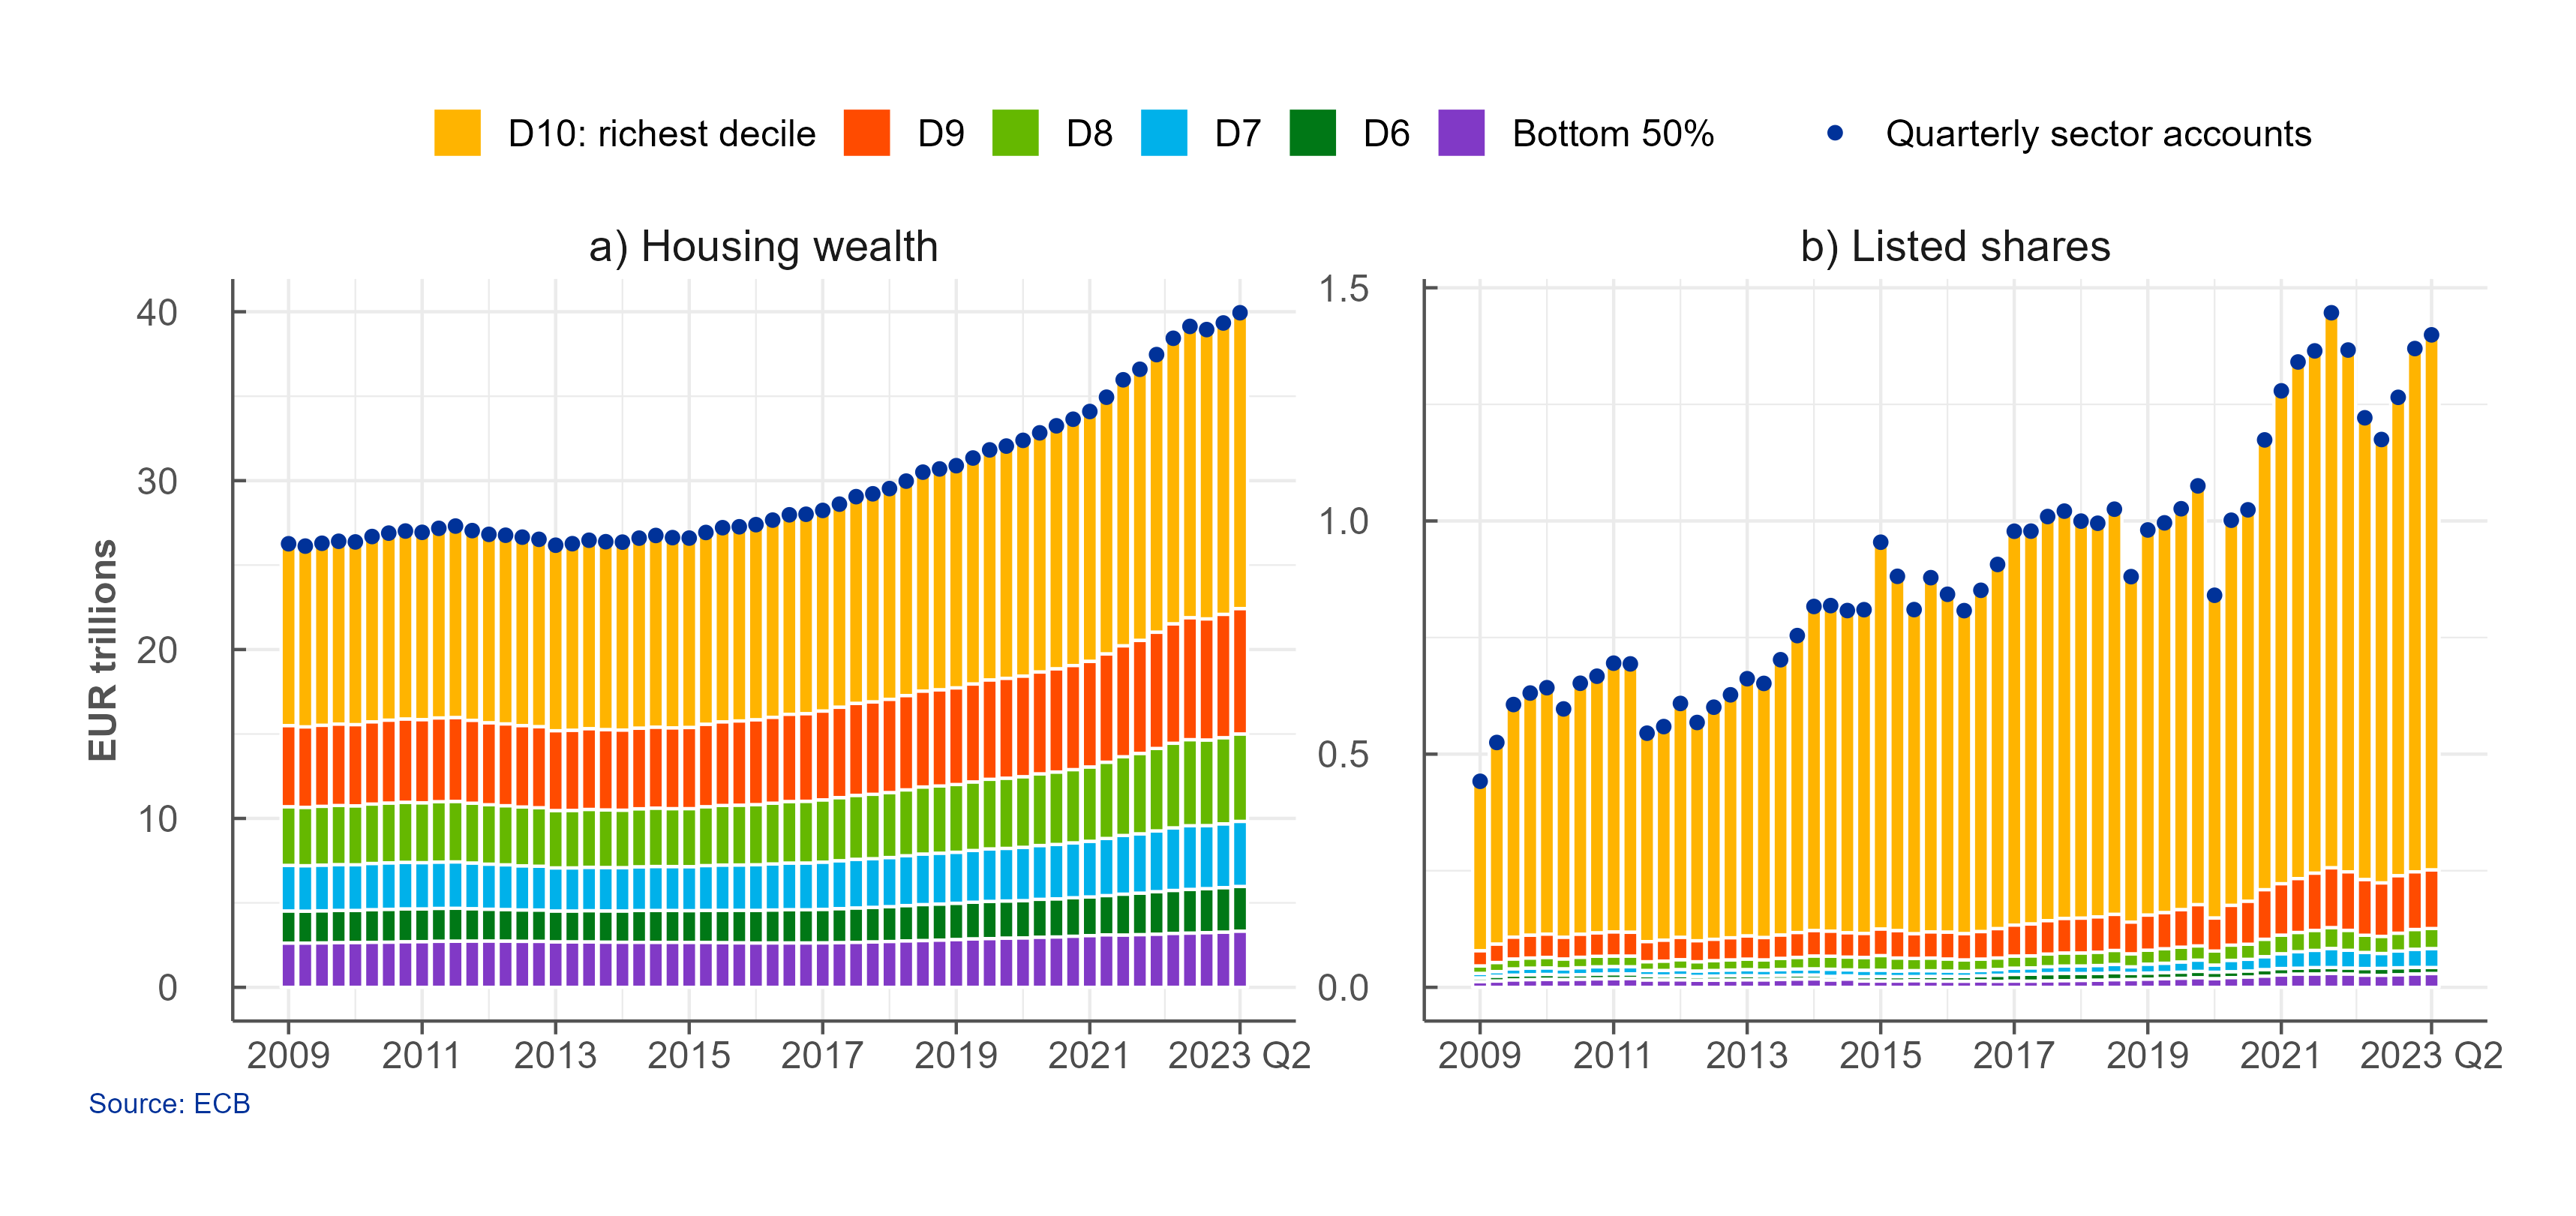
The significant rise in euro area household net wealth observed in national accounts over the past five years (29% or about €13.7 trillion) was accompanied by a slight decrease in inequality, partly because homeowners, who account for more than 60% of the population, benefited from increased housing prices. Their net wealth (per household) increased by 27% over this period. In parallel, the net wealth of non-homeowners, making up 40% of the population, grew by 17%, mainly owing to the rise in deposits observed over this period.
The DWA dataset also includes the Gini coefficient for net wealth, data on median and mean net wealth, the share of net wealth held by the bottom 50%, the top 5% and the top five deciles of households, as well as the debt-to-asset ratio by household net wealth deciles.
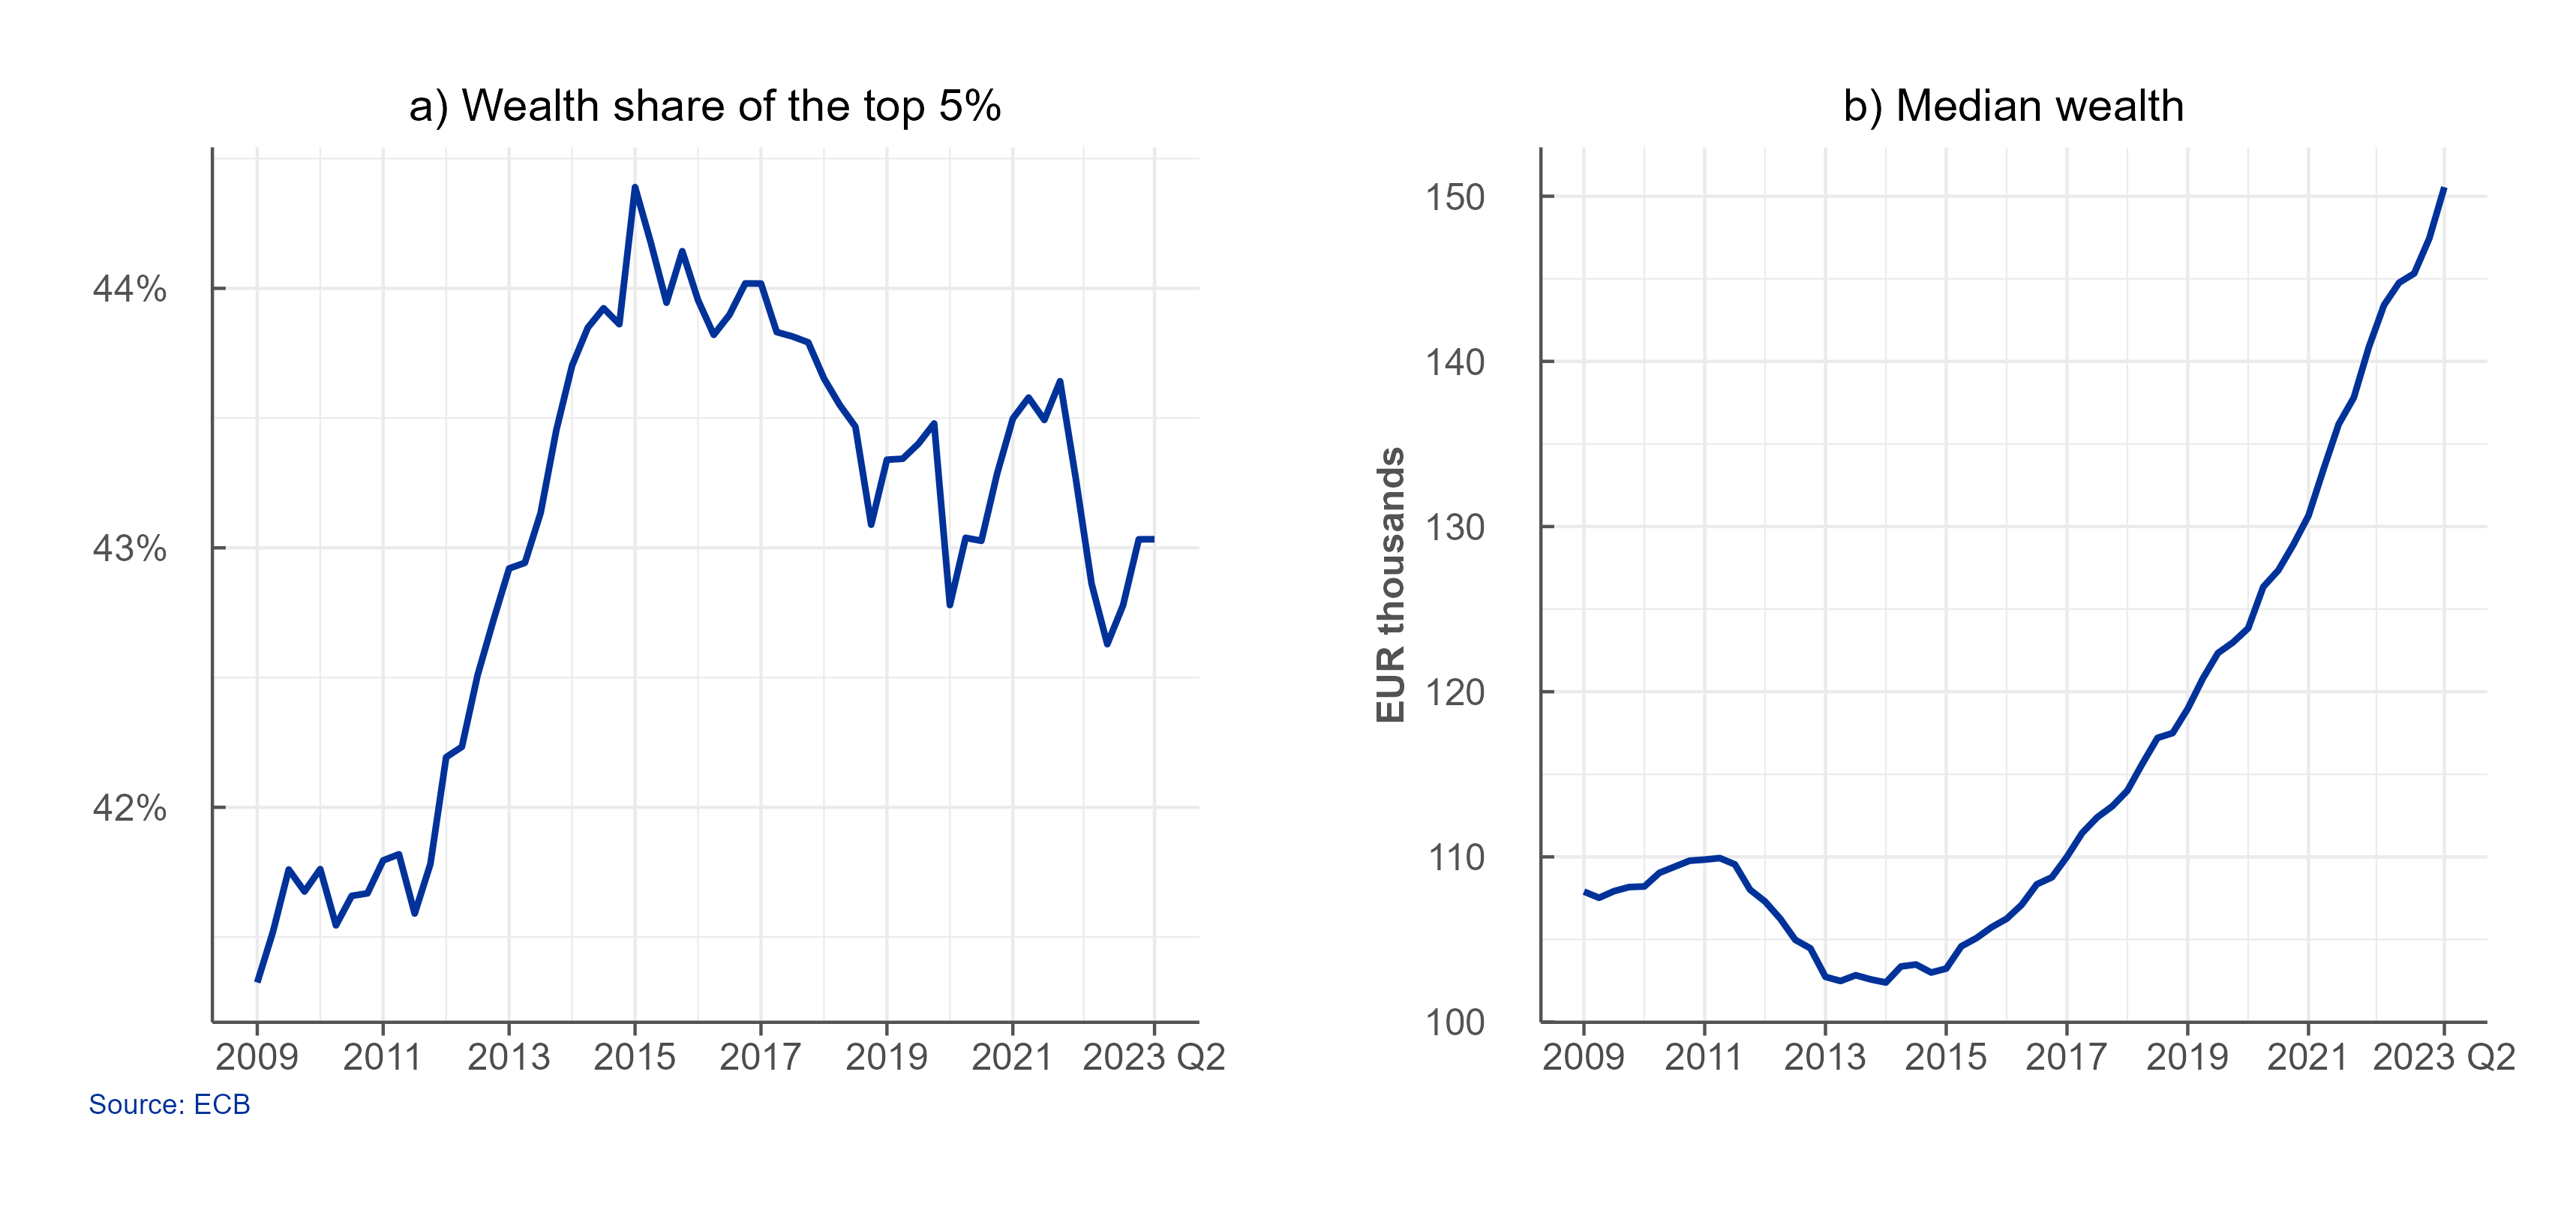
The DWA results show that, in the euro area, the share of net wealth held by the top 5% of households of the net wealth distribution dropped slightly between 2016 and the second quarter of 2023, while still exceeding 43%. At the same time, the median net wealth increased by approximately 40% (Chart 2).
Chart 2: Share of net wealth held by top 5% (left) and household median net wealth (right), euro area
For media queries, please contact Philippe Rispal, tel.: +49 69 1344 5482.
Methodological notes
- The DWA data and information on the methodology can be accessed via the ECB Data Portal.
- DWA results are available from 2009 and combine the aggregated quarterly sector accounts (QSA) with the four available HFCS waves between 2010 and 2021. Results for the quarters after 2021 are estimated using the most recent sector accounts data and the latest available HFCS wave, assuming a stable instrument distribution. As a result, for recent quarters the DWA capture the impact of developments in sector accounts on wealth distribution, and provide an estimate for the distributional effect of price changes for each instrument. Possible further changes due to differences in the investment and financing behaviour of different household groups are not reflected and will be only integrated as subsequent HFCS waves are released.
- DWA data are at current prices and are not adjusted for the effect of inflation.
- The data will be updated every three months and will reflect any revisions to the QSA. Furthermore, data from 2021 onwards will be revised when the next HFCS wave becomes available.
- Experimental data comply with many, but not all, of the quality requirements of official ECB statistics. A sensitivity analysis has been performed on some parameters used in the estimates, however the results may be subject to higher uncertainty compared with other statistics.
- Wealth deciles are computed by ranking households of a country according to their net wealth, starting with the poorest ones, and then grouping them into ten consecutive subsets, each representing 10% of the population: D1 is the poorest decile according to net wealth, D2 the second poorest, etc… up to D10 which is the richest decile according to net wealth. Deciles D1 to D5 together form the “bottom 50%”.
- The Gini coefficient measures the extent to which the distribution of wealth within a country deviates from a perfectly equal distribution. A coefficient of 0 expresses perfect equality where everyone has the same wealth, while a coefficient of 1 expresses full inequality where only one person has all the wealth.
Two of the recommendations for G-20 countries relate to developing distributional information on household income, consumption, savings and wealth in line with the national accounts. See recommendations III.8 and III.9 in https://www.imf.org/en/News/Seminars/Conferences/DGI/g20-dgi-recommendations#dgi3 .
Assets include: deposits, debt securities, equity, life insurance, housing wealth and non-financial business wealth. Liabilities mainly comprise loans received.
Den Europæiske Centralbank
Generaldirektoratet Kommunikation
- Sonnemannstrasse 20
- 60314 Frankfurt am Main, Tyskland
- +49 69 1344 7455
- media@ecb.europa.eu
Eftertryk tilladt med kildeangivelse.
Pressekontakt