

Published as part of the Financial Stability Review, November 2025.
Rolling corporate recessions mask underlying vulnerabilities and complicate risk analysis. Despite increased broader macroeconomic challenges and corporate vulnerabilities in the euro area in recent years, as indicated for instance by the marked rise in business bankruptcies, credit metrics such as the non-performing loan (NPL) ratio have remained surprisingly low (Chart A, panel a).[1] This disconnect between major macroeconomic shocks (e.g. the COVID-19 pandemic and the energy price shock after Russia’s invasion of Ukraine) and the absence of broad-based stress across corporate and bank balance sheets is often attributed to fiscal support cushioning the economy and inflation dynamics indirectly improving firms’ debt servicing capacity and profit margins.[2],[3] However, it may also reflect a structural shift in how downturns unfold. Unlike traditional recessions, which affect the economy uniformly, rolling recessions – defined as sectoral downturns that propagate sequentially – exacerbate weaknesses in specific sectors over time.[4] This staggered pattern obscures the overall health of the economy, leading to heightened uncertainty. While structural shifts such as climate change and digitalisation pose medium to long-term sectoral risks, rolling recessions entail the short-term risk of non-linearity, potentially triggering an unexpected economy-wide downturn. This box explores how rolling recessions may create hidden vulnerabilities and complicate the assessment of macro-financial risks.
Rolling recessions are reinforced by firm-level frictions and the evolving nature of economic shocks. Firms adjust their capital stock and output only in response to sufficiently large deviations from optimal conditions, owing to fixed costs of change, irreversibility and uncertainty.[5] This rigidity in their investment and pricing behaviour means they delay taking action until shocks are sufficiently substantial or persistent to justify the adjustment costs. These microeconomic frictions are amplified by the changing nature of economic shocks. Shocks such as climate change, technological advances and geopolitical disruptions, which are more sector-specific in terms of their impact, are becoming more prominent and persistent, and are increasingly shaping macroeconomic volatility and inflation dynamics.[6] At the same time, traditional shocks, such as oil price and monetary policy shocks – which tend to be more broad-based – are having less of an impact or are propagating differently as a result of shifts in energy use, globalisation and institutional policy frameworks.[7]
Chart A
Rolling recessions create staggered, sector-specific vulnerabilities masked by aggregate indicators
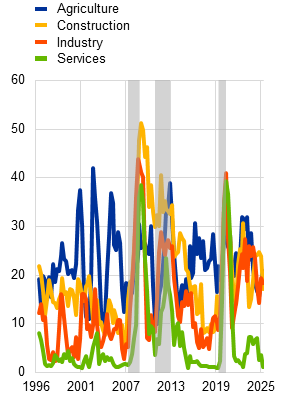
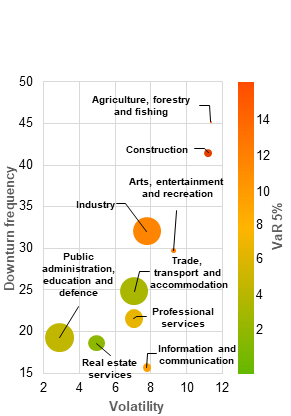
a) Declarations of bankruptcy and corporate NPL ratio in the euro area | b) Time-varying vulnerability, by sector of economic activity | c) Vulnerability dimensions across economic sectors |
|---|---|---|
(Q1 2015-Q2 2025, left-hand scale: index: 2021 = 100, right-hand scale: percentages) | (Q2 1996-Q2 2025, composite indicator) | (Q2 1996-Q2 2025, x-axis: percentages, left-hand scale: absolute numbers, right-hand scale: bubble size; share in GVA in Q2 2025) |
 |  |  |
Sources: Eurostat and ECB (QSA), ECB (supervisory data), CEPR and ECB calculations.
Notes: Panel a: the chart shows Eurostat’s index of bankruptcy declarations, which is a weighted average of national indices, based on the absolute number of bankruptcies. The voluntary data collection before 2021 and national differences in bankruptcy laws imply a need for caution in interpreting the data. Panel b: the sectoral vulnerability measure captures three dimensions based on gross value added (GVA): (i) volatility of year-on-year GVA growth; (ii) downturn frequency; and (iii) tail risk, defined as the 5% value-at-risk (VaR) of year-on-year GVA growth. It is calculated over a 20-quarter rolling window using a pooled sample from all euro area countries at a quarterly frequency. The grey areas indicate crisis periods, as determined by the CEPR Euro Area Business Cycle Dating Committee. Panel c: volatility, downturn frequency and tail risk are calculated for the period from Q1 1996 to Q2 2025 using a pooled sample from all euro area countries at a quarterly frequency. The colour of the bubbles indicates the tail risk, defined as the 5% VaR of year-on-year GVA growth.
Rolling recessions may lead to a build-up of risks in individual sectors, creating pockets of vulnerability. Evidence from recent macro-financial shocks suggests that sectoral vulnerabilities can materialise in a staggered manner without spilling over to the broader economy until they reach critical mass or become synchronised (Chart A, panel b). While aggregate GDP and employment data may appear stable, firms in sectors like agriculture, construction or energy and interest rate-sensitive industries can face margin pressures, cost shocks and financing constraints owing to external factors such as commodity price changes, supply chain disruptions and monetary policy tightening. Some sectors are structurally more vulnerable, with high levels of volatility and more frequent downturns indicating greater sensitivity to shocks and lower adaptability (Chart A, panel c). For example, construction and agriculture are generally more sensitive to weather conditions and climate change, while sectors such as industry tend to be more affected by financing conditions, energy prices and trade dynamics.
When vulnerability waves align, rolling recessions can become systemic. Although typically asynchronous, rolling sectoral downturns may converge to anywhere on the scale from no synchronisation to full alignment. Evidence from the euro area shows a spike in sectoral growth correlations during major crisis periods (Chart B, panel a). Synchronisation can be triggered by common shocks, such as rapid monetary policy tightening or surging energy prices, and reinforced by feedback loops due to credit market developments, trade links or investor sentiment, leading to contagion across otherwise weakly connected sectors. As soon as sectoral downturns align, banks may face deteriorating asset quality and rising capital needs.[8] These risks are heightened if banks’ exposures are concentrated in specific sectors, which yields efficiency gains in normal times but amplifies losses during synchronised shocks.[9] Historical evidence supports this notion: during the global financial crisis and the euro area sovereign debt crisis, for example, the share of sectors with negative growth in gross value added and lending surged to multi-year highs (Chart B, panel b).
Chart B
Rolling recessions can unexpectedly align across sectors, increasing the likelihood of tail-risk events
a) Rolling correlations between growth rates of sectoral GVA in the euro area | b) Share of sectors with negative GVA and lending growth |
|---|---|
(Q4 1997-Q2 2025, correlation coefficients) | (Q1 1997-Q2 2025, percentages) |
 |  |
Sources: Eurostat and ECB (QSA), CEPR and ECB calculations.
Notes: Panel a: the chart shows the distribution of rolling correlations (based on an eight-quarter rolling window) between gross value added (GVA) year-on-year growth rates for all sector pairs across euro area countries over time. The grey areas indicate crisis periods, as determined by the CEPR Euro Area Business Cycle Dating Committee. Panel b: the chart compares two measures of economic stress: (i) the GVA stress indicator, which shows the percentage of non-financial sectors with negative year-on-year GVA growth; and (ii) the credit stress indicator (only available from 2002), which reflects the share of sectors experiencing negative lending growth at each point in time. EA stands for euro area.
Increasingly aligned sector-specific downturns could give rise to correlated credit losses across the banking sector. Banks may see a deterioration in asset quality as sectoral shocks interact, with high NPL correlations across key sectors, notably industry, real estate, trade and manufacturing, pointing to potential spillover risks (Chart C, panel a). Despite the current disconnect between heightened macro-financial uncertainty and subdued credit risk metrics, the number of sectors facing rising NPL ratios has increased since 2022, albeit unevenly across sectors (Chart C, panel b). This could raise the possibility of simultaneous losses across banks’ loan portfolios. Left unmitigated, localised sectoral downturns could turn into systemic credit events, weakening balance sheets, constraining new lending and further amplifying any downturn.
Chart C
Rolling recessions can fuel sectoral credit risk clustering, with correlated NPL dynamics amplifying systemic vulnerabilities
a) Euro area sectoral NPL correlation | b) Country-sector pairs with rising NPL ratios |
|---|---|
(Q1 2014-Q2 2025, correlation coefficients) | (Q1 2016-Q2 2025, absolute numbers) |
 |  |
Sources: ECB and ECB calculations.
Notes: Panel a: “Prof. services” stands for professional services; “Pub. admin.” stands for public administration. The chart depicts correlations, averaged across all countries, between country-specific sector pairs using contemporaneous data. Sample consist of 18 euro area countries. Panel b: the chart shows the number of country-sector pairs with rising NPL ratios.
Risk surveillance frameworks and policy tools need to adequately capture sectoral patterns of vulnerability to address risks stemming from rolling recessions. Such sectoral downturns can create pockets of sectoral fragility, which may synchronise and turn into broad-based downturns with highly correlated credit losses across sectors. Mitigating these risks means refining risk surveillance practices and policy tools. This includes moving beyond tracking aggregate indicators to analysing data by sector, region and borrower type, while enhancing the availability and quality of granular data.
As insolvency regimes differ across countries, the lead-lag relationship between bankruptcies and NPLs can reverse (i.e. NPLs may precede bankruptcies). Moreover, while rising bankruptcies may signal stress, they can also boost medium to long-term productivity by reallocating resources to more efficient firms. Nonetheless, bankruptcies serve as a proxy for the state of the economy and should ultimately be reflected in bank balance sheets.
For more information on debt servicing capacity, see Brunnermeier, M., Correia, S., Luck, S., Verner, E. and Zimmermann, T., “The Debt-Inflation Channel of the German (Hyper) Inflation”, American Economic Review, Vol. 115, No 7, July 2025, pp. 2111-2150.
For more information on profit margins, see the article entitled “How have unit profits contributed to the recent strengthening of euro area domestic price pressures?”, Economic Bulletin, Issue 4, ECB, 2023.
The concept of rolling recessions has gained popularity recently; see, for example, “What is a rolling recession? And are we in one right now?”, World Economic Forum, March 2023. It was, however, already discussed in the late 1990s; see, for example, “Rolling Recessions”, Southwest Economy, Issue 5, Federal Reserve Bank of Dallas, 1997. The term was first coined by analysts in the 1980s to describe the evolution of regional business cycles in the United States. Later it was also used for sectoral business cycles, as regional and sectoral business cycles in the United States often move together.
See, for example, Caballero, R.J. and Engel, E.M.R.A., “Microeconomic rigidities and aggregate price dynamics”, European Economic Review, Vol. 37, No 4, May 1993, pp. 697-717.
See, for example, Görtz, C., Gunn, C. and Lubik, T.A., “The Changing Nature of Technology Shocks”, Working Paper Series, No 24-13, Federal Reserve Bank of Richmond, September 2024; and Kim, H.S., Matthes, C. and Phan, T., “Severe Weather and the Macroeconomy”, American Economic Journal: Macroeconomics, Vol. 17, No 2, April 2025, pp. 315-341.
For more information on the declining importance of energy price shocks, see, for example, Edelstein, P. and Kilan, L., “How sensitive are consumer expenditures to retail energy prices?”, Journal of Monetary Economics, Vol. 56, Issue 6, 2009, pp. 766-779; and on monetary policy shocks, see, for example, Boivin, J. and Giannoni, M.P., “Has Monetary Policy Become More Effective?”, The Review of Economics and Statistics, Vol. 88, Issue 3, 2006, pp. 445-462.
At this preliminary stage, a major recession could be triggered either by the alignment of sector-specific risks or by an aggregate shock causing such an alignment. Non-linear dynamics mean that even minor changes can have sizeable ripple effects.
See Paravisini, D., Rappoport, V. and Schnabl, P., “Specialization in Bank Lending: Evidence from Exporting Firms”, The Journal of Finance, Vol. 78, No 4, August 2023, pp. 2049-2085.