Economic, financial and monetary developments
Overview
Economic activity
The recovery in global economic activity continues, although persisting supply bottlenecks and the spread of the more contagious Delta variant of the coronavirus (COVID-19) cast a shadow over the near-term growth prospects. Recent surveys signal some easing in the growth momentum, particularly among emerging market economies. Compared with the previous projections, the growth outlook for the global economy in the September 2021 ECB staff macroeconomic projections has been slightly revised upwards, especially in 2022. Global real GDP growth (excluding the euro area) is projected to increase to 6.3% this year, before slowing to 4.5% in 2022 and 3.7% in 2023. Euro area foreign demand has been revised upwards compared with the previous projections. It is projected to expand by 9.2% this year and by 5.5% and 3.7% in 2022 and 2023 respectively. This mainly reflects the fact that global imports were stronger at the start of 2021 than previously projected, as well as the greater procyclicality of trade during an economic recovery. The export prices of euro area competitors have been revised upwards for this year amid higher commodity prices and stronger demand. Risks to the baseline projections for the global economy relate mainly to the future course of the pandemic. Other risks to the global outlook are judged to be tilted to the downside for global growth and to the upside for global inflation.
The euro area economy rebounded by 2.2% in the second quarter of the year, which was more than expected, and is on track for strong growth in the third quarter. The recovery builds on the success of the vaccination campaigns in Europe, which have allowed a significant reopening of the economy. With the lifting of restrictions, the services sector is benefiting from people returning to shops and restaurants and from the rebound in travel and tourism. Manufacturing is performing strongly, even though production continues to be held back by shortages of materials and equipment. The spread of the Delta variant has so far not required lockdown measures to be reimposed. But it could slow the recovery in global trade and the full reopening of the economy.
Consumer spending is increasing, although consumers remain somewhat cautious in the light of the pandemic developments. The labour market is also improving rapidly, which holds out the prospect of higher incomes and greater spending. Unemployment is declining and the number of people in job retention schemes has fallen by about 28 million from the peak last year. The recovery in domestic and global demand is further boosting optimism among firms, which is supporting business investment. At the same time, there remains some way to go before the damage to the economy caused by the pandemic is overcome. There are still more than two million fewer people employed than before the pandemic, especially among the younger and lower skilled. The number of workers in job retention schemes also remains substantial.
After a significant fiscal expansion since the start of the pandemic, only limited additional stimulus measures have been adopted over the last few months, as 2022 budgetary plans are still in preparation and the economic recovery seems to be proceeding somewhat faster than anticipated. As a result, the September 2021 ECB staff macroeconomic projections include a fiscal outlook for the euro area that has improved compared with June. While the deficit ratio is projected to remain high in 2021, at 7.1%, after 7.3% in 2020, the subsequent improvement is foreseen to be swift as the pandemic abates and the economic recovery takes hold. The deficit ratio is thus expected to fall to 3.0% in 2022 and 2.1% at the end of the projection horizon in 2023. Mirroring these developments, euro area debt is projected to peak at just below 99% of GDP in 2021 and to decline to about 94% of GDP in 2023. To support the recovery, ambitious, targeted and coordinated fiscal policy should continue to complement monetary policy. In particular, the Next Generation EU programme will help ensure a stronger and uniform recovery across euro area countries. It will also accelerate the green and digital transitions, support structural reforms and lift long-term growth.
The economy is expected to rebound firmly over the medium term. The September 2021 ECB staff macroeconomic projections foresee annual real GDP growth at 5.0% in 2021, 4.6% in 2022 and 2.1% in 2023. Compared with the June 2021 Eurosystem staff macroeconomic projections, the outlook has improved for 2021, largely on account of stronger than expected outcomes in the first half of the year, and is broadly unchanged for 2022 and 2023.
Inflation
Euro area inflation increased to 3.0% in August. Inflation is expected to rise further this autumn, but to decline next year. The current increase in inflation is expected to be largely temporary, mainly reflecting the strong increase in oil prices since around the middle of last year, the reversal of the temporary VAT reduction in Germany, delayed summer sales in 2020 and cost pressures that stem from temporary shortages of materials and equipment. In the course of 2022 these factors should ease or will fall out of the year-on-year inflation calculation. Underlying inflation pressures have edged up. As the economy recovers further, and supported by the Governing Council’s monetary policy measures, underlying inflation is expected to rise over the medium term. This increase is expected to be only gradual, since it will take time for the economy to return to operating at full capacity, and therefore wages are expected to grow only moderately. Measures of longer-term inflation expectations have continued to increase, but these remain some distance from the ECB’s 2% target.
This assessment is reflected in the September 2021 ECB staff macroeconomic projections, which foresee annual inflation at 2.2% in 2021, 1.7% in 2022 and 1.5% in 2023, being revised up compared with the previous projections in June. Inflation excluding food and energy price inflation is projected to average 1.3% in 2021, 1.4% in 2022 and 1.5% in 2023, also being revised up from the June projections.
Risk assessment
The Governing Council sees the risks to the economic outlook as broadly balanced. Economic activity could outperform the ECB’s expectations if consumers become more confident and save less than currently expected. A faster improvement in the pandemic situation could also lead to a stronger expansion than currently envisaged. If supply bottlenecks last longer and feed through into higher than anticipated wage rises, price pressures could be more persistent. At the same time, the economic outlook could deteriorate if the pandemic worsens, which could delay the further reopening of the economy, or if supply shortages turn out to be more persistent than currently expected and hold back production.
Financial and monetary conditions
The recovery of growth and inflation still depends on favourable financing conditions for all sectors of the economy. Market interest rates have eased over the summer, but reversed recently. Overall, financing conditions for the economy remain favourable.
While the forward curve of the euro overnight index average (EONIA) decreased markedly across medium maturities, the short end of the curve has remained largely unchanged, suggesting no expectations of an imminent policy rate change in the very near term. Over the review period (10 June to 8 September 2021), long-term risk-free rates first decreased, reflecting inter alia the ECB’s revised rate forward guidance communicated after the July Governing Council meeting, following the release of the new monetary policy strategy, and subsequently retraced part of this move in the last weeks of the period. Sovereign spreads over the overnight index swap (OIS) rate remained broadly unchanged across jurisdictions. Risk assets showed overall resilience against rising concerns about the spreading of the Delta variant. Equity prices increased, mainly supported by a strong recovery in corporate earnings growth expectations, which was only partly counterbalanced by an increase in equity risk premia. Mirroring the increase in equity prices, euro area corporate bond spreads continued to tighten.
Money creation in the euro area moderated in July 2021, normalising further after the significant monetary expansion associated with the earlier waves of the pandemic. Domestic credit remained the dominant driver of money creation, with Eurosystem asset purchases being the most prominent contributor. Growth in lending to the private sector stabilised close to lower, pre-pandemic, long-term levels, while financing conditions remained very favourable. Bank lending rates for firms and households are at historically low levels. Lending to households is holding up, especially for house purchases. The somewhat slower growth of lending to firms is mainly due to the fact that firms are still well funded because they borrowed heavily in the first wave of the pandemic. They have high cash holdings and are increasingly retaining earnings, which reduces the need for external funding. For larger firms, issuing bonds is an attractive alternative to bank loans. Solid bank balance sheets continue to ensure that sufficient credit is available.
However, many firms and households have taken on more debt during the pandemic. A deterioration in the economic outlook could threaten their financial health. This, in turn, would worsen the quality of banks’ balance sheets. Policy support remains essential to prevent balance sheet strains and tightening financing conditions from reinforcing each other.
Monetary policy decisions
At its monetary policy meeting in September, the Governing Council reviewed its assessment of the economy and its pandemic measures.
Based on a joint assessment of financing conditions and the inflation outlook, the Governing Council judged that favourable financing conditions can be maintained with a moderately lower pace of net asset purchases under the pandemic emergency purchase programme (PEPP) than in the previous two quarters.
The Governing Council also confirmed its other measures to support the ECB’s price stability mandate, namely the level of the key ECB interest rates, the Eurosystem purchases under the asset purchase programme (APP), the Governing Council’s reinvestment policies and its longer-term refinancing operations.
The Governing Council stands ready to adjust all of its instruments, as appropriate, to ensure that inflation stabilises at the ECB’s 2% target over the medium term.
1 External environment
The September 2021 ECB staff macroeconomic projections for the euro area suggest that the recovery in global economic activity continues, although persisting supply bottlenecks and the spread of the more contagious Delta variant of the coronavirus (COVID-19) cast a shadow over the near-term growth prospects. Recent surveys signal some easing in the growth momentum, particularly among emerging market economies. Compared with the previous projections, the growth outlook for the global economy has been revised slightly upwards, especially for 2022. Global real GDP growth (excluding the euro area) is projected to increase to 6.3% this year, before slowing to 4.5% in 2022 and 3.7% in 2023. Euro area foreign demand has also been revised upwards compared with the previous projections. It is projected to expand by 9.2% this year and by 5.5% and 3.7% in 2022 and 2023 respectively. This mainly reflects the fact that global imports were stronger at the start of 2021 than previously projected, the better global growth outlook and the greater procyclicality of trade during an economic recovery. The export prices of competitors of the euro area have been revised upwards for this year amid higher commodity prices and stronger demand. Risks to the baseline projections for the global economy relate mainly to the future course of the pandemic. Other risks to the global outlook for activity are judged to be tilted to the downside for global growth and to the upside for global inflation.
Global economic activity and trade
Global economic activity slowed in the first half of 2021 amid rising COVID-19 infections, uneven vaccination progress and the adoption of restrictive measures. Across advanced economies rising new infections led to a tightening of restrictive measures in early 2021. In late spring, a rapid vaccination roll-out allowed some key economies to gradually reopen, thus bringing some relief to the world economy. At the same time, however, the pandemic worsened in emerging market economies, where progress with vaccinations has been slower. As a result, global real GDP growth (excluding the euro area) slowed to 0.8% in the first quarter of the year and to an estimated 0.6% in the second quarter, after 2.5% in the last quarter of 2020. In comparison with the June 2021 Eurosystem staff macroeconomic projections, activity in the second quarter is estimated to have been broadly in line with the projections in emerging market economies but weaker in advanced economies as growth in the United States was less dynamic than projected.
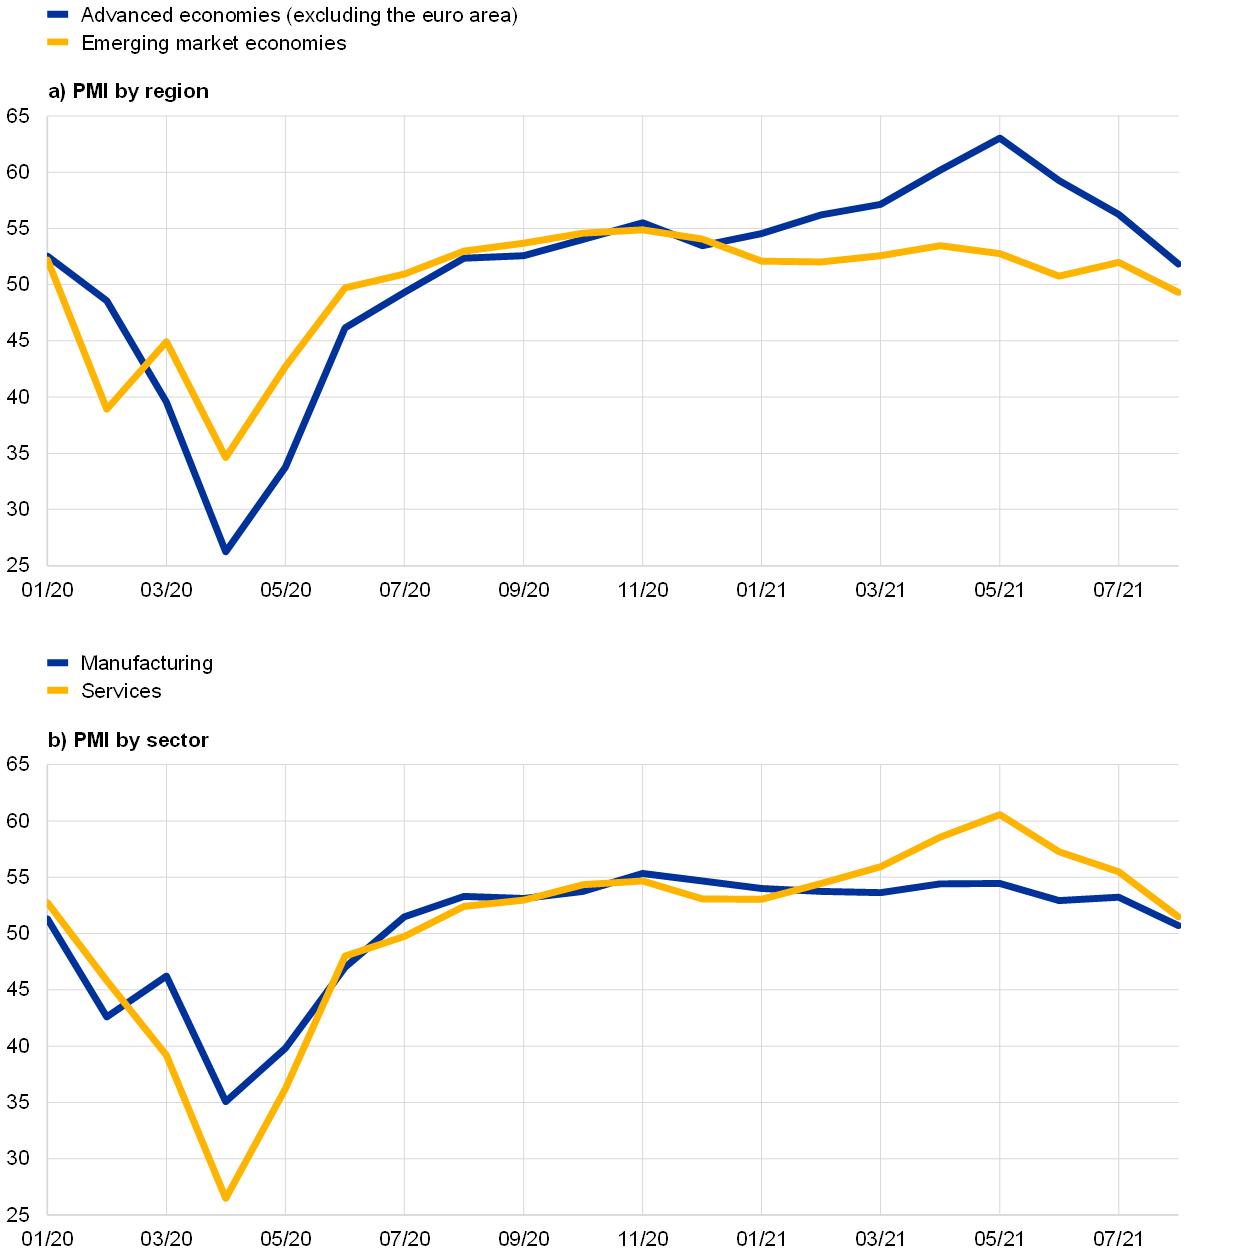
Survey indicators suggest a moderation in the pace of the recovery in global economic activity, particularly among emerging market economies, amid persisting supply bottlenecks. In August the global composite output Purchasing Managers’ Index (PMI) decreased for the third consecutive month, falling to 51.3 from 54.9 in July. While the index remains in expansionary territory, it shows some easing in growth compared with the second quarter. The composite output PMI declined for both advanced and emerging market economies, and for the latter it fell below the expansionary threshold for the first time since June 2020 (to 49.3 from 52.0 in July). Across components, the services output PMI dropped sharply from its peak of 60.5 in May to 51.5, falling particularly for advanced economies. The manufacturing PMI also declined, falling below the expansionary threshold for emerging market economies although remaining slightly above that threshold overall (50.7, down from 53.2). While the global economy continues to face a two-track recovery, with advanced economies recovering at a faster speed than emerging market economies, the recent PMIs point to a narrowing in the divergence between the two regions, and also between sectors (Chart 1).
Chart 1
Global (excluding the euro area) output PMI by regions and sectors
(diffusion indices)
Sources: Markit and ECB calculations.
Note: The latest observations are for August 2021.
Financial conditions continue to be accommodative. Since the cut-off date of the June 2021 Eurosystem staff macroeconomic projections, financial conditions have tightened somewhat in advanced economies, while they have remained broadly stable in emerging market economies. Global financial markets have remained mostly range-bound amid still buoyant economic growth dynamics but rising short-term risks. The resurgence in COVID-19 infections and concerns that central banks, including the Federal Reserve System, will soon start to scale back asset purchases have prompted investors to adopt a more cautious stance. Equity markets have continued to reach new highs in some advanced economies, but price/earnings ratios – which enter the financial conditions indices – have retreated markedly on the back of the historically strong earnings season in the United States and other advanced economies. Rising concerns that the economic recovery might take longer than anticipated have been also visible in corporate bond spreads, which have edged slightly higher in some economies, in particular emerging markets, albeit from historically low levels. Risk-free government bond markets have remained broadly unchanged at compressed levels, as downward pressure from “safe-haven” inflows of funds associated with concerns over the spread of the Delta variant have been offset by rising expectations of the Federal Reserve starting to reduce the pace of its asset purchases as early as this year.
In the near term, a resurgence in COVID-19 infections casts a shadow over an otherwise robust recovery. Global economic activity is expected to regain momentum in the second half of the year as economies gradually reopen amid declining infection rates and, particularly in advanced economies, rapid vaccination progress. Indeed, while many advanced economies have already managed to vaccinate more than half their populations, vaccination has been much slower in emerging market economies. China is an exception in this respect, as around 70% of the population has reportedly been vaccinated. Recently, the renewed surge in COVID-19 infections on account of the more contagious Delta variant has clouded the outlook. In advanced economies, the surge in cases is still leading to a significant rise in the number of hospitalisations and deaths compared with the lows seen this summer, though they remain lower than those recorded in early 2021. Whereas some countries, notably China and Japan, have again resorted to imposing (local) lockdowns, others have not, preferring to rely on less intrusive measures such as increased mandating of mask wearing. In those countries, the economic consequences of the renewed surge are likely to manifest themselves through changes in consumer behaviour, particularly in the contact-intensive sectors. Progress with vaccinations and greater knowledge as to how to avoid contagion have, however, lessened the economic risks attached to the surge. If authorities are successful in containing the increase in hospitalisations and deaths, its impact is likely to be temporary only and unlikely to derail the ongoing recovery.
Fiscal support is expected to gradually diminish this year across both advanced and emerging market economies. In the International Monetary Fund’s Fiscal Monitor of April 2021, fiscal deficits are projected to start declining in 2021 across both advanced and emerging market economies, as pandemic-related measures expire and automatic stabilisers start to operate amid recovering domestic economies. However, countries are likely to differ in the pace at which they start re-balancing their budgets. In the United States, the large fiscal stimulus prepared by the Biden Administration will support the economic recovery in 2021 and help the global economy over the forecast horizon.[1] In the United Kingdom, fiscal deficits are expected to be reined in, although some expiring fiscal measures have been extended into September 2021. Consolidation is also expected in Brazil and Russia, while in India some additional fiscal support has recently been approved amid the worsening pandemic situation.
Overall, the growth outlook for the global economy is slightly more favourable than in the previous projections, mainly with regard to 2022. Following a projected growth rate of 6.3% in 2021, world real GDP (excluding the euro area) is projected to increase by 4.5% in 2022 and 3.7% in 2023. The global recovery from the crisis is projected to remain uneven. Advanced economies outside the euro area are projected to reach their pre-pandemic path in early 2022, largely on account of the United States. In China, which was hit by the pandemic first but recovered fastest amid strong policy support, real GDP reached its pre-crisis trajectory already late last year. In other emerging markets the recovery is projected to be sluggish. Compared with the June 2021 Eurosystem staff macroeconomic projections, the growth rate has been revised up by 0.1 percentage points for 2021 and 0.3 percentage points for 2022, while it is unchanged for 2023. The more favourable global growth outlook in 2022 largely reflects the reprofiling of the government spending in the United States[2] and, to a smaller extent, a delayed projected recovery in Japan as high infection rates over the summer of 2021 led to restrictive measures being reintroduced in some large prefectures, including Tokyo.
In the United States, the economy is projected to grow amid strong policy support and the gradual dissipation of supply constraints, though the recent rise in COVID-19 infections undermines the outlook. Economic activity continued to expand in the second quarter of 2021, at an annualised rate of 6.5% (following 6.4% in the first quarter). This was less than projected in the June 2021 Eurosystem staff macroeconomic projections, reflecting weaker than expected government spending and a negative contribution from the changes in inventories. Growth was driven by consumer spending, reflecting income support provided earlier in the year and a rapid loosening of COVID-19-related restrictions. Investment continued to be strong. A recent rise in unfilled orders in certain industries, such as vehicle manufacturing, reflects supply constraints. Congressional negotiations continue on the two fiscal plans which had been incorporated in the June projections, introducing some uncertainty about the outlook. While strong policy support and the assumed gradual dissipation of supply constraints are projected to boost growth in the medium term, the short-term outlook is clouded by the sharp rise in the number of COVID-19 infections due to the more virulent Delta variant, particularly in states with low vaccination rates. As a result consumers, who have driven the recovery so far, seem to have become more cautious: personal consumption expenditures declined by 0.1% in July, while the personal saving rate rose. Employment growth in July was also less than expected, in particular in high-contact industries such as leisure and hospitality. Headline inflation stabilised at a high level in July and is projected to remain around 5% until the end of 2021, owing to supply bottlenecks pushing up prices for cars and other items, a normalisation of services demand, higher commodity prices and a positive output gap. Inflation is expected to return to close to 2% in 2022-23 as bottlenecks dissipate and business adapts to post-pandemic demand patterns.
In the United Kingdom, the economy is projected to remain on a sustained recovery path despite the recent resurgence in COVID-19 cases. Having contracted sharply in 2020, real GDP rebounded in the second quarter of 2021 and is projected to stay on a recovery path. The advanced vaccination programme is expected to protect large parts of the population from serious COVID 19 infection, even in view of the rise of the Delta variant, making it unlikely that COVID-19-related mobility restrictions affecting economic activity need to be reimposed. Growth is likely to continue to be supported by robust private consumption and private investment on the back of the additional fiscal spending of 2.7% of GDP approved by the government in March. Changes in inventories are still seen as likely to raise output volatility in the short term. Annual consumer price inflation decreased to 2.0% in July from 2.5% in June. Core inflation also declined, to 1.8% from 2.3% in June. The decline in the annual rate of headline inflation was mainly driven by prices for recreation and culture and clothing prices, with higher prices at the end of the lockdown last year resulting in negative base effects this year. This decline is likely to be temporary, with inflation expected to have picked up sharply again in August and to rise further over the following months, to around 4%. Apart from direct effects from energy, accounting for around half the projected increase, goods prices are also expected to rise further, reflecting global price pressures due to higher commodity prices, shipping costs and supply shortages.
In China, growth momentum is facing temporary headwinds in the short term, but economic activity is projected to grow at a robust pace over the medium term. The adoption of stricter containment measures owing to an increase in COVID-19 cases, severe floods and some supply disruptions point to a slowdown in the third quarter. Industrial production, retail sales and investment were below expectations in July, though still growing. The manufacturing PMI dropped to 49.2 in August, the first time it had been in contractionary territory since April 2020, which makes it more likely that this sector slowed in the third quarter. The general services business activity PMI also dropped to 46.7, as a result of the tightening of containment measures. However, in mid-August new local COVID-19 cases started to come down to very low levels, and sufficient policy space exists to boost growth should the economic slowdown accelerate. Annual consumer price inflation declined to 1.0% in July, while annual producer price inflation edged back up to 9% in the same month after a slight decrease to 8.8% in June, mainly on the back of strong price increases in the energy and mining industries. Overall, consumer price inflation remains subdued, largely owing to ongoing food price deflation amid normalising pork prices, while fuel prices have increased.
In Japan, COVID-19-related restrictions have continued to weigh on economic activity, thus pushing the recovery towards the end of 2021. The recovery from the initial COVID-19 shock stalled at the start of 2021 as restrictions were tightened amid rising infections. As a result, real GDP contracted in the first quarter. Economic activity recovered modestly in the second quarter as the rebound in domestic demand, particularly in private consumption, was firmer than expected given renewed infection control measures in April/May. A rapid surge in COVID-19 cases then triggered the declaration of a fourth state of emergency in a number of prefectures (including Tokyo). While the associated decline in mobility was initially limited, it has recently become more significant, with the August services PMI falling further to 42.9. Industrial production fell in July, and the manufacturing output PMI declined in August to 51. A firmer recovery is expected towards the final quarter, assuming that the pandemic situation gradually improves amid a steady progression of the vaccination campaign, and infection control measures are lifted. Ongoing fiscal and monetary policy support, as well as a continued recovery in external demand, are seen underpinning growth ahead. Annual headline CPI inflation moved from -0.5% to -0.3% in July, whereas core inflation moved to -0.8% (from -1.1% in the previous month). Higher energy prices and accommodation charges have contributed to the rise in inflation and helped to offset the impact of large cuts in mobile phone charges. Underlying inflation excluding special factors is likely to have remained on an uptrend, thus hinting at a more positive momentum than suggested by headline figures.
In central and eastern EU Member States, economic activity is projected to gradually regain momentum, supported by fiscal and monetary stimulus. The recovery in this region slowed in the first half of 2021 as a new wave of COVID-19 infections weighed on activity. Real GDP is expected to rebound again and remain strong over the course of the year, as the continued easing of restrictions and increasing vaccination rates are expected to revive growth. Domestic demand is forecast to be the main driver of the recovery as uncertainty recedes and confidence improves amid robust fiscal and monetary policy support.
In large commodity-exporting countries, a favourable external environment is supporting the recovery in economic activity. In Russia, real GDP has reached its pre-crisis levels and is expected to grow robustly over the projection horizon. Stronger global demand for oil is supporting higher oil production and exports. A projected recovery in consumption and investment is also seen contributing to growth over the period. Persistently high food prices and rising demand have resulted in inflationary pressures, which in turn have prompted a tightening of monetary policy. In Brazil, economic activity has proved resilient to the resurgence in COVID-19 infections, supported by robust export growth and a continued recovery in investment (net of idiosyncratic factors). The relatively quick rebound in consumer confidence and retail sales and the reintroduction, on a smaller scale than in 2020, of transfers to low-income families and employment support schemes will support private consumption in the near term. Monetary policy has started to tighten in response to rising inflationary pressures, as high commodity prices and domestic factors (droughts in some regions, an increase in energy tariffs and recovering demand) are expected to keep inflation high in the near term.
In Turkey, the economy is projected to grow steadily over the medium term. Following the initial COVID-19 shock, the Turkish economy staged a quick recovery and has proved resilient to the subsequent resurgence in new infections. In the second quarter of 2021 real GDP growth surprised on the upside, at 0.9% quarter on quarter. Growth was primarily supported by household consumption, despite renewed restrictions introduced in May and tighter financial conditions, as well as by net exports. Looking ahead, provided that the recent shift in the direction of policy towards macroeconomic stability is sustained, real GDP growth is likely to remain subdued but become more balanced.
Global trade is projected to grow steadily over the medium term, but signs of moderation in the near term are starting to emerge. Following a dynamic recovery from the COVID-19 shock, global trade returned to its pre-pandemic levels in the first quarter of 2021. Recently, however, signs of moderation in trade growth are emerging, which mainly reflects the impact of the supply bottlenecks indicated by recent data. Merchandise imports slipped further in May but were broadly stable in June, remaining close to the high levels seen in March. Services imports remain well below their pre-pandemic level, and there is little evidence of a broadening of the recovery. High-frequency data on international flights and hotel bookings suggest that tourism and other services-related trade growth has not accelerated further in recent months. The global PMI for new export orders in manufacturing (excluding the euro area) declined again in August, falling just below the expansionary threshold. At the same time, PMI suppliers’ delivery times in August were still above the all-time high registered at the peak of the pandemic. Supply bottlenecks have originated mainly from a stronger than expected recovery in the demand for manufactured goods and are assumed to start dissipating at the start of 2022. The demand for manufactured goods has been much more buoyant than the demand for services, which has been still dented by containment measures. Since economies have become more resilient to restrictive measures and as consumers rebalance their purchases towards services, the demand side might play a smaller role in bottlenecks. Currently, though, idiosyncratic factors, such as capacity constraints in the semiconductor industry, COVID-19 outbreaks and extreme weather, are driving supply-side disruptions.
Chart 2
Global (excluding the euro area) imports of goods and new export orders
(left-hand scale: index, December 2019 = 100; right-hand scale: diffusion index)

Sources: Markit, CPB Netherlands Bureau for Economic Policy Analysis and ECB calculations.
Note: The latest observations are for August 2021 for the PMI data and June 2021 for global merchandise imports.
Euro area foreign demand is projected to grow on the back of a more favourable external environment. Euro area foreign demand is projected to expand by 9.2% this year and by 5.5% and 3.7% in 2022 and 2023 respectively. Compared with the June 2021 Eurosystem staff macroeconomic projections, this is an upward revision of 0.6 percentage points for 2021 and 0.3 percentage points per year for both 2022 and 2023. For 2021, this largely reflects the better than expected outturn in global imports in the first quarter of 2021, especially among emerging market economies, as trade remained relatively resilient to the headwinds to economic activity. For both 2022 and 2023, the upward revision stems from the better global growth outlook and reflects the greater procyclicality of trade during an economic recovery. Global imports (excluding the euro area) have also been revised upwards over the projection horizon and are seen increasing by 11.9% in 2021, 5.3% in 2022 and 4.1% in 2023.
Risks to the baseline projections are assessed to be tilted to the downside for global growth and to the upside for global inflation. In line with the previous projection rounds, two alternative scenarios for the global outlook are used to illustrate the uncertainty surrounding the future course of the pandemic. These scenarios reflect the interplay between developments in the pandemic and the associated path of containment measures.[3] In addition, upside risks to global inflation relate mainly to the possibility of the current inflationary pressures becoming more entrenched on the back of more persistent than currently expected supply bottlenecks, and thus feeding into higher inflation expectations. This, in turn, could elicit an earlier and stronger monetary policy tightening. Tighter global financial conditions would risk derailing the fragile economic recovery, particularly in emerging market economies, raising global financial market volatility and accentuating the negative impact of the high indebtedness on growth. These factors are judged to outweigh upside risks to the outlook, which are related to a larger than expected expansionary effect of the US fiscal stimulus package and a faster than currently projected reduction in accumulated savings. Risks to global growth are therefore no longer assessed to be balanced, as in the previous projections, but are now seen as tilted to the downside.
Global price developments
Oil prices have increased somewhat since the previous projection exercise, while the rally in non-oil commodities prices has halted. There has also been renewed volatility in the oil market as disagreement between members of the OPEC+ group temporarily pushed global oil prices higher, amid improving prospects for global oil demand. Market participants expect oil demand to increase in 2021, with mobility gradually returning to pre-pandemic levels. However, prices moderated in early August, reflecting rising new COVID-19 infections and prospects of a US monetary policy tightening weighing on risk sentiment. Spot prices for non-energy commodities were little changed in the September projections compared with levels assumed in the June projections, as recent declines in metal prices against the backdrop of weaker demand and the use of strategic reserves in China halted the rally observed between summer 2020 and late spring 2021.
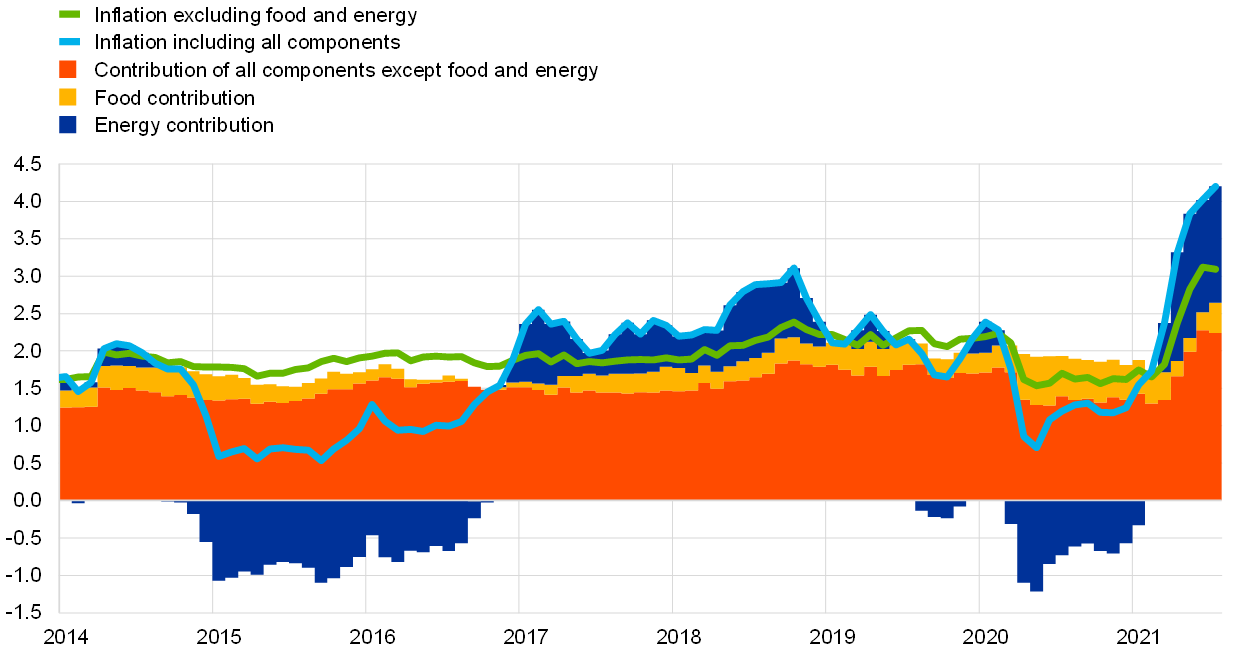
Global consumer price inflation is projected to increase this year amid base effects, supply bottlenecks and the ongoing recovery in demand, and to decline over the rest of the projection horizon. Higher oil and non-oil commodity prices, surging freight shipping costs and supply chain frictions have added to inflationary pressures. This is particularly visible across advanced economies, where the reopening and sizeable government support have unleashed strong consumer demand. This pushed the latest readings of consumer price inflation in the majority of advanced economies above historical averages. Across member countries of the Organisation for Economic Co-operation and Development (OECD), annual headline CPI inflation increased to 4.2% in July, from 4.0% in June (Chart 3). The July reading marked the ninth consecutive increase and was driven mainly by food price inflation (up from 1.9% to 3.1%), while energy price inflation increased marginally (from 16.9% to 17.4%), still largely reflecting base year effects. OECD CPI inflation excluding food and energy remained unchanged at 3.1%. Headline annual consumer price inflation remained stable in the United States at 5.4%, increased in Canada and slowed down in the United Kingdom. In Japan, after a change in the base year, headline inflation remained negative in July, albeit increasing from the previous month (to -0.3% from -0.5%). Among major non-OECD emerging market economies, annual headline inflation increased to 9.0% in Brazil, while remaining stable in Russia and declining in India. In China it remained stable at around 1%.
Chart 3
OECD consumer price inflation
(year-on-year percentage changes; percentage point contributions)
Sources: OECD and ECB calculations.
Note: The latest observations are for July 2021.
Once the higher comparison base for commodity prices kicks in and supply bottlenecks ease (expected in early 2022), global consumer price inflation is projected to decline. A similar pattern is also embedded in projections for euro area competitors’ export prices (in national currency), which increased significantly in the first half of this year. Projections for these prices in 2021 have been revised sharply upwards, largely reflecting recent data releases in countries that are key trading partners of the euro area, which surprised on the upside compared with the June 2021 Eurosystem staff macroeconomic projections, and, to a lesser extent, higher oil prices and somewhat stronger demand in advanced economies.
2 Financial developments
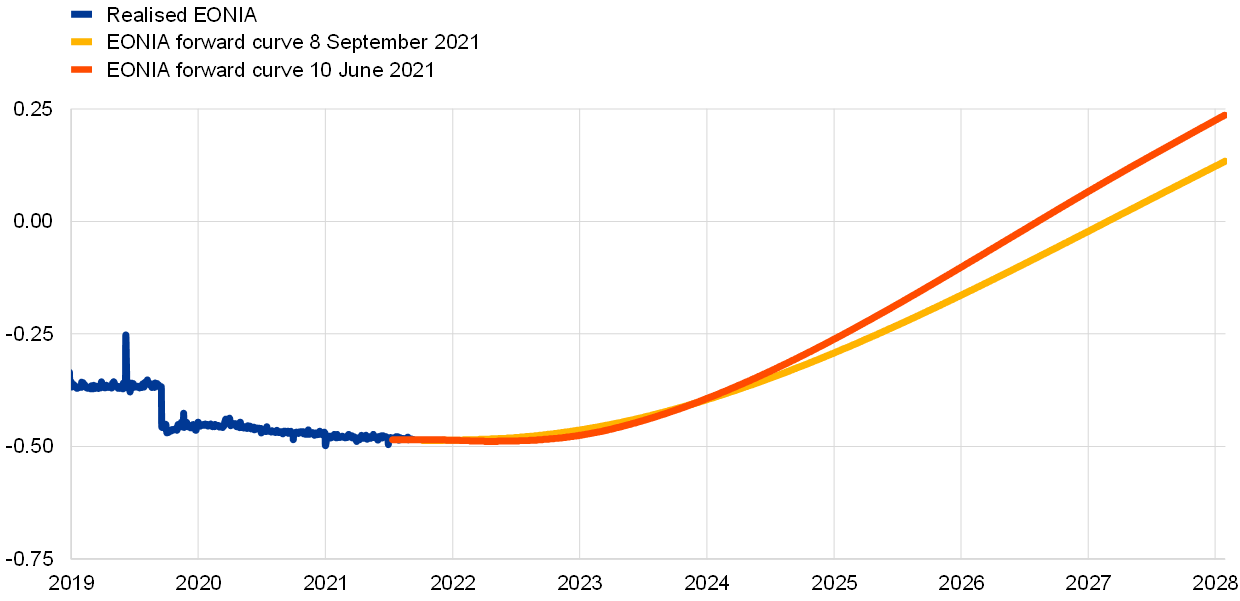
While the forward curve of the euro overnight index average (EONIA) decreased across medium maturities, the short end of the curve has remained largely unchanged, suggesting no expectations of an imminent policy rate change in the very near term. Over the review period (10 June to 8 September 2021), long-term risk-free rates first decreased, reflecting inter alia the ECB’s revised forward guidance communicated after the July Governing Council meeting following the release of the new monetary policy strategy. Long-term risk-free rates subsequently retraced part of this move in the last weeks of the period amid upside surprises in headline inflation figures and speculation about a slowing of the pace of purchases under the pandemic emergency purchase programme (PEPP). Sovereign spreads over the overnight index swap (OIS) rate remained broadly unchanged across jurisdictions. Risk assets showed overall resilience against rising concerns about the spread of the Delta variant of the coronavirus (COVID-19). Equity prices increased, mainly supported by a strong recovery in corporate earnings growth expectations, which were only partly counterbalanced by an increase in equity risk premia. Mirroring equity prices, euro area corporate bond spreads continued to tighten.
The EONIA and the benchmark euro short-term rate (€STR) averaged −48 and −57 basis points respectively over the review period.[4] Excess liquidity increased by approximately €189 billion to around €4,395 billion, mainly reflecting asset purchases under the PEPP and the asset purchase programme (APP), as well as the €109.83 billion take-up of the eighth TLTRO III operation. This growth in excess liquidity, induced by the increase in monetary policy assets, was mitigated by a net decline in other assets of around €180 billion over the review period.
While the medium-term segment of the EONIA forward curve decreased over the review period, the short end of the curve remained flat (Chart 4). The short end of the EONIA forward curve, up to around the end of 2024, remained broadly unchanged, suggesting that market participants do not expect a policy rate change in the foreseeable future. However, rates of medium-term maturities shifted down. Part of the decline reflects the ECB’s revised forward guidance communicated after the July Governing Council meeting, following the release of the new monetary policy strategy earlier in the month.
Chart 4
EONIA forward rates
(percentages per annum)
Sources: Refinitiv and ECB calculations.
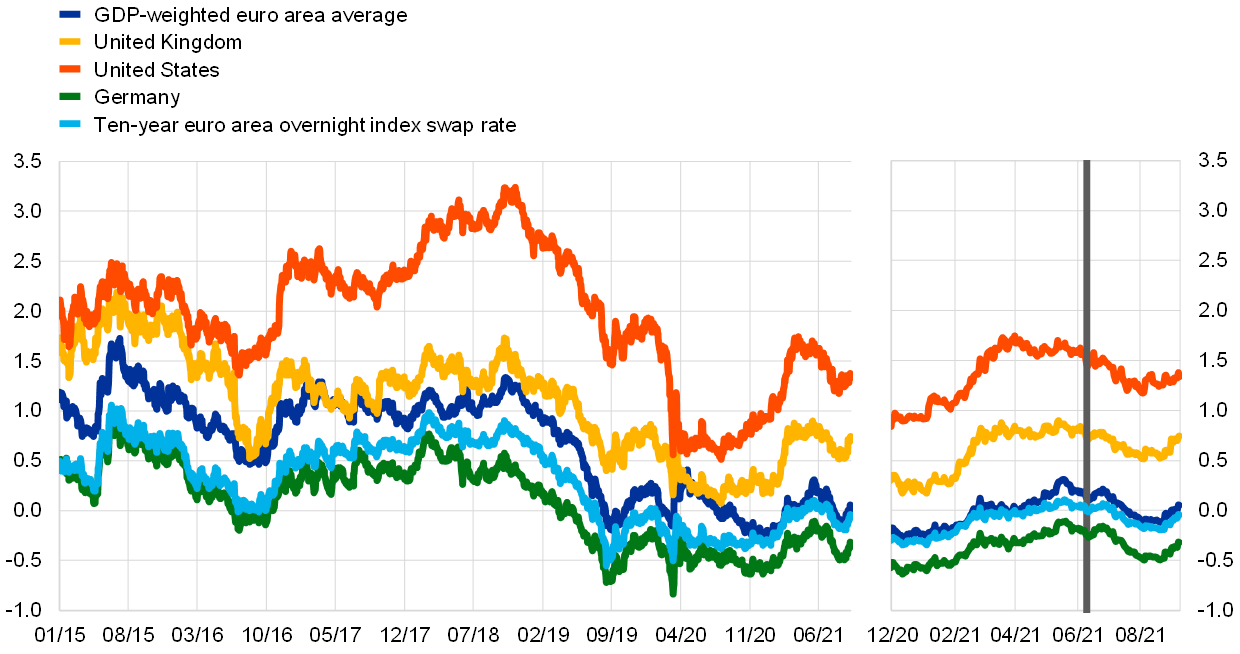
Euro area sovereign bond yields decreased over the review period amid expectations of continued monetary policy support (Chart 5). Developments in euro area sovereign bond markets closely followed those in risk-free rates, with yields in individual jurisdictions moving in lockstep and approaching their all-time lows in several countries during the review period, while retracing some of this decline in the last weeks of the period. Specifically, GDP-weighted euro area and German ten-year sovereign bond yields decreased by around 7 basis points to ‑0.05% and ‑0.32% respectively. A similar decline took place in the United States, where ten-year sovereign bond yields decreased by 10 basis points to 1.34%.
Chart 5
Ten-year sovereign bond yields
(percentages per annum)
Sources: Refinitiv and ECB calculations.
Notes: The vertical grey line denotes the start of the review period on 10 June 2021. The latest observation is for 8 September 2021.
Long-term spreads of euro area sovereign bonds relative to OIS rates remained broadly unchanged across jurisdictions, supported by monetary policy decisions as well as by the communication following the July Governing Council meeting (Chart 6). Changes in individual sovereign spreads over risk-free rates were very limited, as reflected in the aggregate ten-year euro area GDP-weighted sovereign spread over the corresponding OIS rate, which decreased by 3 basis points to stand at 0.10%. As a result, this metric remains close to the very low levels observed towards the end of 2020, after reversing a temporary increase in the early summer. Overall, there were slight decreases in Portuguese and French ten-year spreads of 9 and 7 basis points respectively to 0.31% and 0.06%. Over the same period, Italian ten-year spreads remained unchanged at 0.80% and Spanish ten-year spreads increased by 3 basis points to 0.42%. These contained movements were probably supported by the June Governing Council decision, confirmed in July, to maintain a significantly higher pace of purchases in the third quarter than earlier in the year. Amid these calm developments in sovereign bond markets, the first issuances under the Next Generation EU (NGEU) programme were successfully placed on the market.
Chart 6
Ten-year euro area sovereign bond spreads vis-à-vis the OIS rate
(percentage points)

Sources: Refinitiv and ECB calculations.
Notes: The spread is calculated by subtracting the ten-year OIS rate from the ten-year sovereign bond yield. The vertical grey line denotes the start of the review period on 10 June 2021. The latest observation is for 8 September 2021.
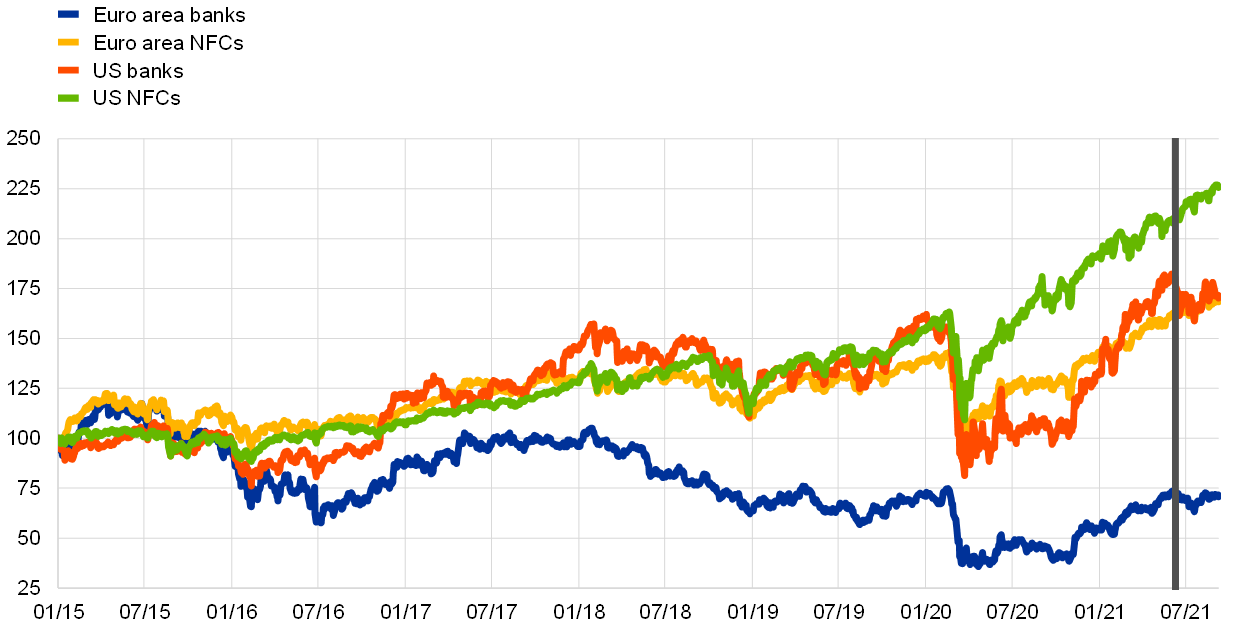
Notwithstanding some temporary volatility related to news about the spread of the Delta variant, equity prices increased on both sides of the Atlantic, mainly supported by further improvement in corporate earnings expectations (Chart 7). Stock prices of euro area and US non-financial corporations (NFCs) increased by 3.1% and 6.6% respectively, reaching record highs in the United States. Bank equity prices in the United States declined somewhat, while the equity prices of euro area banks remained broadly unchanged. The increase for NFCs was mainly supported by strong corporate earnings expectations and marginally lower discount rates, which in turn reflected continued support from monetary policy. However, a slight increase in the equity risk premium, which is the additional return required by investors to hold equities instead of risk-free bonds, contributed negatively to euro area equity prices. The increase in equity prices was broad based, although the coronavirus pandemic has still left an uneven footprint in equity markets across euro area countries.
Chart 7
Euro area and US equity price indices
(index: 1 January 2015 = 100)
Sources: Refinitiv and ECB calculations.
Notes: The vertical grey line denotes the start of the review period on 10 June 2021. The latest observation is for 8 September 2021.
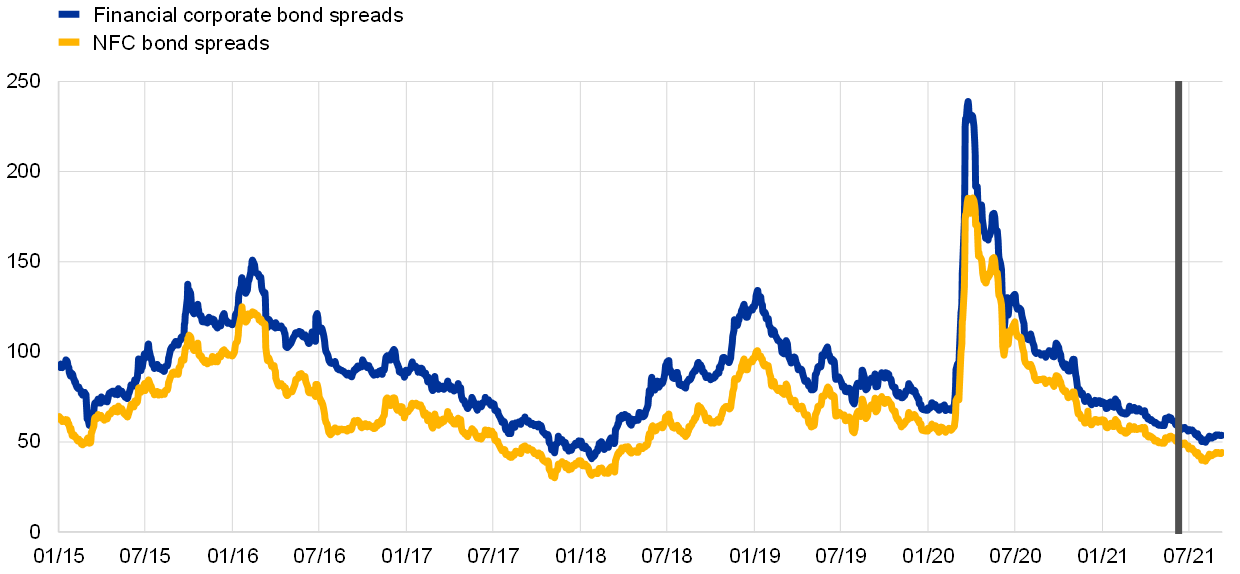
Euro area corporate bond spreads continued to tighten, confirming the picture of resilient risk asset markets (Chart 8). Mirroring the increase in equity prices, euro area corporate bond spreads continued to decline. Over the review period, the investment-grade NFC bond spread and the financial sector bond spread (relative to the risk-free rate) narrowed by around 5 and 4 basis points, respectively, to stand at pre-pandemic levels. The continued trend decline in recent months can largely be attributed to excess bond premia, i.e. the component of euro area corporate bond spreads that is unexplained by economic, credit and uncertainty-related factors, which in turn may reflect continued policy support. At the same time, pockets of corporate vulnerability continue to exist, and the current level of spreads appears to be predicated on ongoing policy support.
Chart 8
Euro area corporate bond spreads
(basis points)
Sources: Markit iBoxx indices and ECB calculations.
Notes: The spreads are the difference between asset swap rates and the risk-free rate. The indices comprise bonds of different maturities (with at least one year remaining) with an investment-grade rating. The vertical grey line denotes the start of the review period on 10 June 2021. The latest observation is for 8 September 2021.
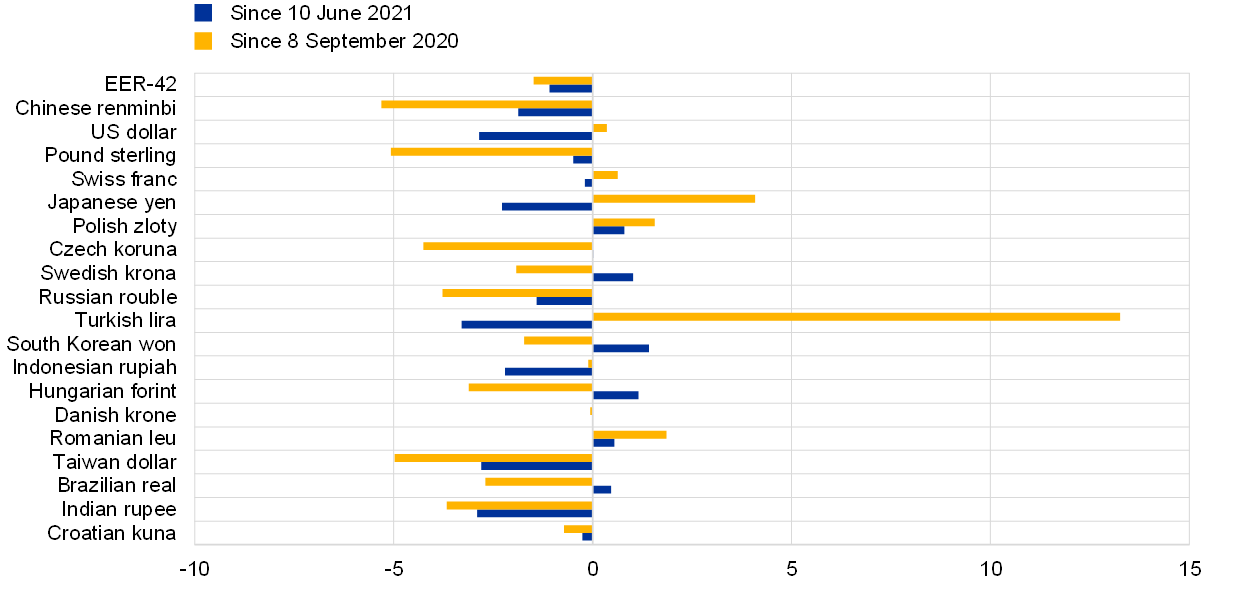
In foreign exchange markets, the euro depreciated somewhat in trade-weighted terms (Chart 9), reflecting a broad-based weakening against all major currencies. Over the review period, the nominal effective exchange rate of the euro, as measured against the currencies of 42 of the euro area’s most important trading partners, weakened by 1.1%. The euro depreciated against the US dollar (by 2.9%), reflecting the widening of the short-term interest rate expectations differential between the euro area and the United States, which in turn was due to the expected faster normalisation of US monetary policy. The euro also weakened against other major currencies, including the Japanese yen (by 2.3%), the Chinese renminbi (by 1.9%), the pound sterling (by 0.5%) and the Swiss franc (by 0.2%). Over the same period, the euro strengthened against the currencies of several non-euro area EU Member States, including the Hungarian forint (by 1.2%), the Swedish krona (by 1.0%) and the Polish zloty (by 0.8%).
Chart 9
Changes in the exchange rate of the euro vis-à-vis selected currencies
(percentage changes)
Source: ECB.
Notes: EER-42 is the nominal effective exchange rate of the euro against the currencies of 42 of the euro area’s most important trading partners. A positive (negative) change corresponds to an appreciation (depreciation) of the euro. All changes have been calculated using the foreign exchange rates prevailing on 8 September 2021.
3 Economic activity
The recovery in euro area activity is increasingly advanced. Real GDP rebounded in the second quarter of 2021, but still stands at around 2.5% below its pre-pandemic level of the fourth quarter of 2019. Domestic demand, in particular private consumption, contributed vigorously, benefiting from a progressive lifting of containment measures, while net trade added only slightly to GDP growth. On the production side, value added was mainly supported by a rebound in services, while industry and construction contributed only marginally. The positive outcome for the second quarter marks the start of a rebound in economic activity following the two quarters of contraction that accompanied the reimposition of stronger containment measures following the resurgence of the coronavirus (COVID-19) pandemic over the winter months.
At the start of the second half of the year business and consumer surveys and high-frequency indicators pointed to further strong growth into the third quarter, despite the ongoing pandemic and supply-side bottlenecks. Business surveys continue to indicate a strong recovery in services activity, as further progress with vaccination campaigns has helped contain hospitalisations despite increases in infections, enabling greater normalisation of high-contact activities. By contrast, manufacturing and construction activities continue to be constrained by ongoing supply-side bottlenecks, although confidence remains at high levels.
After an expected strong third quarter, the pace of recovery is anticipated to gradually normalise, as progress on vaccination campaigns should allow for further relaxation of containment measures and supply-side bottlenecks are expected to recede. Over the medium term the recovery in the euro area economy is expected to be increasingly supported by strong global demand alongside increasingly firm domestic demand, as well as by continued support from both monetary and fiscal policy. This assessment is broadly reflected in the baseline scenario of the September 2021 ECB staff macroeconomic projections for the euro area, which envisage annual real GDP growth over the projection horizon at 5.0% in 2021, 4.6% in 2022 and 2.1% in 2023, and a return to pre-pandemic quarterly levels of activity by the end of the year. Compared with the June 2021 Eurosystem staff macroeconomic projections, the outlook for economic activity has been revised upwards for 2021, largely on account of stronger-than-expected outcomes in the first half of the year, while it remains broadly unchanged for 2022 and 2023.
Overall, the risks surrounding the outlook for euro area growth are assessed as broadly balanced. On the one hand, an even faster recovery could be expected if the pandemic-driven increased stock of household savings unwinds more quickly than expected, prospects for global demand improve further or current supply-side bottlenecks ease faster than anticipated. On the other hand, growth could underperform if the pandemic intensifies as a result of the spread of new virus variants or if supply-side disruptions continue to be more persistent and limit production more than anticipated.
Economic activity in the euro area rebounded in the second quarter, growing at 2.2% quarter on quarter and signalling that a strong recovery is underway despite headwinds from supply bottlenecks. After the technical recession around the turn of the year, real GDP returned to growth territory in the second quarter, even though containment measures were in place for much of the period (Chart 10). The second-quarter outcome was stronger than anticipated in the June 2021 Eurosystem staff macroeconomic projections, reflecting a waning sensitivity of economic activity to COVID-19 restrictions, and brought quarterly activity to within 2.5% of the pre-pandemic levels seen at the end of 2019. Second-quarter growth was largely driven by a strong rebound in domestic demand, in particular private consumption, with net trade contributing only modestly and inventories slightly detracting from headline growth.
Chart 10
Euro area real GDP, the composite PMI and the ESI
(left-hand scale: quarter-on-quarter percentage changes; right-hand scale: diffusion index)

Sources: Eurostat and Markit.
Notes: Euro area GDP is shown in quarter-on-quarter growth rates, while the Purchasing Managers’ Index (PMI) and Economic Sentiment Index (ESI) indicators are shown at monthly frequency. The latest observations are for the second quarter of 2021 for GDP and August 2021 for the PMI and the ESI.
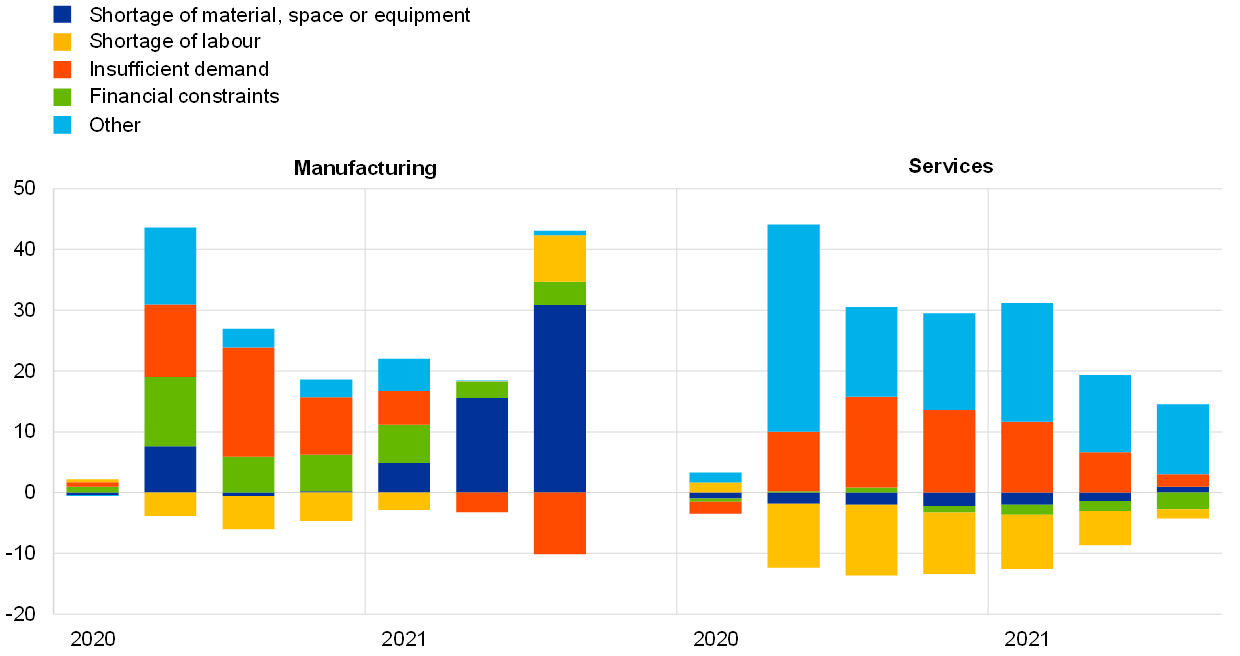
Supply-side bottlenecks are likely to have held back industrial production to a greater degree than services in the second quarter. Value added in the industrial and construction sectors contributed only marginally to second quarter growth owing to ongoing supply-side disruptions (Chart 11), including broad-based shortages of raw materials (including semiconductors, metals and plastics) and continuing transport bottlenecks. However, services activity bounced back strongly, reflecting a progressive relaxation of containment measures, which has bolstered consumer confidence and spending.
Chart 11
Factors limiting production in the euro area
(percentages of respondents, difference relative to long-term average)
Source: European Commission.
Notes: The long-term average is computed for the period between 2003 and 2019. Quarterly survey carried out in the first month of the quarter. The latest observations are for July 2021.
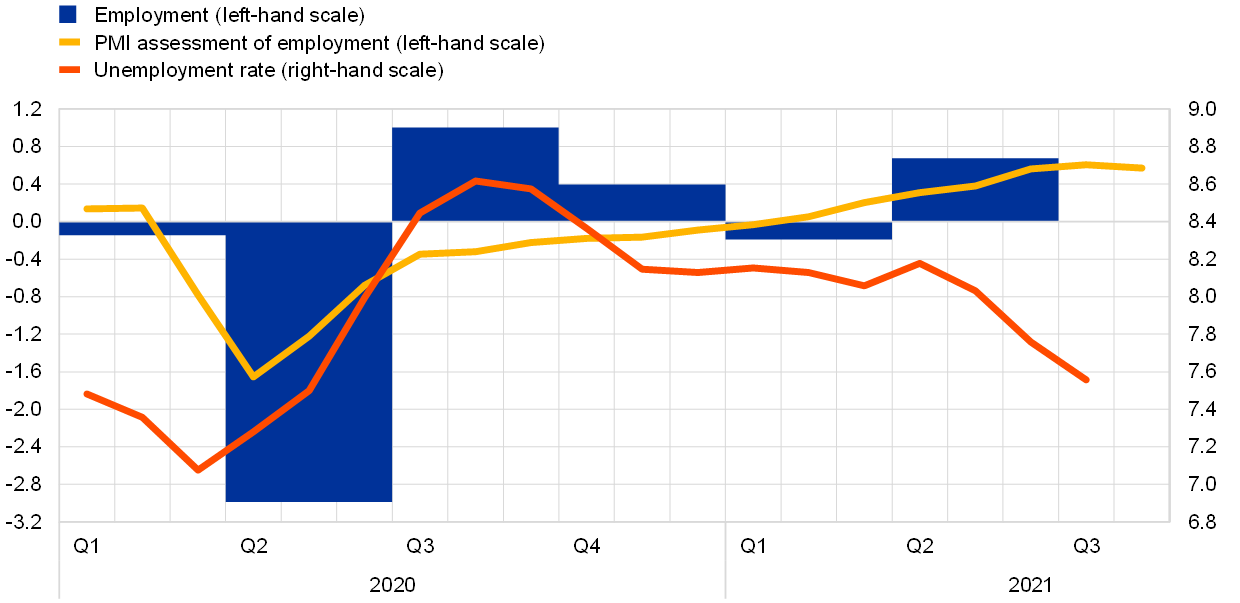
The euro area labour market improved in the second quarter of 2021, while still supported by job retention schemes. Employment and total hours worked increased by 0.7% and by 2.7% quarter on quarter respectively in the second quarter of 2021 (Chart 12). Compared with the pre-pandemic fourth quarter of 2019, employment and total hours worked were down by 1.3% and 4.2% respectively, showing a larger adjustment in hours worked than in employment owing to the employment support provided by the job retention schemes in place.[5] The unemployment rate declined to 7.6% in July, while the number of workers in job retention schemes were estimated at 2.7% of the labour force in the same month, which is a substantial decrease in relation to the average of 6.2% in the first five months of this year, reflecting the easing of restrictions. Nevertheless, the share of workers in job retention schemes is still substantial, highlighting that the adjustment of the labour market is still some way from complete.
Chart 12
Euro area employment, the PMI assessment of employment and the unemployment rate
(left-hand scale: quarter-on-quarter percentage changes; diffusion index; right-hand scale: percentages of the labour force)
Sources: Eurostat, Markit and ECB calculations.
Notes: The PMI employment index and the unemployment rate are shown at a monthly frequency; employment is shown at a quarterly frequency. The PMI is expressed as a deviation from 50 divided by 10. The latest observations are for the second quarter of 2021 for employment, August 2021 for the PMI and July 2021 for the unemployment rate.
Short-term indicators point to continuing improvements in the labour market. The monthly composite PMI employment indicator, encompassing industry and services, decreased slightly to 55.7 in August, from 56.1 in July, but remains well above the threshold level of 50 that indicates an expansion in employment. The PMI employment index has fully recovered since its all-time low in April 2020 and is currently still close to its level in July 2021, the highest level since March 2000.
Consumers remain cautiously optimistic as their financial situation improves despite an environment of lingering uncertainty related to the pandemic. Private consumption rebounded strongly in the second quarter of 2021 (by 3.7% quarter on quarter) and is expected to continue growing at a high rate in the third quarter given the ongoing relaxation of containment measures, positive labour income developments and signs of a normalisation in households’ propensity to save. Consumer confidence remains elevated. After five consecutive months of increases, the European Commission’s consumer confidence indicator declined slightly in July and August, down to -5.3 - albeit remaining above its long-term average of -10.6 since 1990 and its pre-pandemic level of -6.4 in February 2020. While car registrations in June were still 20% below their pre-pandemic level, it is likely that the subdued spending on cars reflects ongoing supply constraints rather than weak consumer demand. This is suggested by the elevated industrial confidence but subdued industrial production in the automotive sector.[6] After two months of positive growth, the volume of retail trade fell in July, by 2.3% month on month, but remains 2.6% above its February 2020 level.
Real household disposable income is estimated to have grown strongly in the second quarter of 2021 and is expected to strengthen further in the third quarter. It is supported by labour compensation, which typically entails a higher propensity to consume than other sources of income. This is corroborated by the monthly information on household bank deposit flows, which points towards some normalisation in the period April-July 2021. Nevertheless, analysis of the drivers of the pandemic-related surge in household savings flows does not suggest a high likelihood that these accumulated savings will be reabsorbed immediately for consumption purposes.[7] This assessment is confirmed by recent survey data from the European Commission suggesting that households expect their major purchases over the next 12 months to be comparable to pre-crisis levels. Furthermore, given the ongoing pandemic-related uncertainty, respondents to the ECB’s August 2021 Consumer Expectations Survey do not expect a return to normal economic and social interactions before spring 2022.
Corporate (non-construction) investment improved in the second quarter of 2021, and short-term indicators point to strong demand for capital goods going forward. Euro area non-construction investment increased by 1.0% quarter on quarter in the second quarter of 2021, following a similar contraction in the previous quarter, but remains 17% below its pre-pandemic level of the last quarter of 2019. Among the largest euro area countries, non-construction investment increased in Germany, France and Italy, while it declined in Spain and remained broadly stable in the Netherlands in the second quarter. Moreover, investment in transport equipment contracted in the euro area for a second consecutive quarter, probably related to input shortages as a result of the ongoing supply-chain disruptions, while the non-transport equipment component remained relatively resilient. Short-term indicators for the third quarter of 2021 suggest a strong demand for capital goods, despite persistent supply-chain bottlenecks: new orders of capital goods are on the rise, with the PMI in July and August remaining clearly in growth territory, while suppliers’ delivery times improved somewhat, but continued to be elevated. As a result, production expectations improved in August. However, firms in the capital goods sector are currently reporting shortages of materials and equipment as a key factor limiting supply in the euro area, while the share of firms reporting demand issues remains small. Labour shortages are currently flagged as being well above their long-term average, but only for a relatively small share of firms in this sector. Recent information in the Bank Lending Survey is also in line with an improving investment outlook.[8] Banks reported an increase in loan demand for fixed investment purposes in the second quarter of 2021 and expected demand for long-term loans (typically used in financing investment) to improve in the third quarter of 2021. While some medium-term risks to the investment outlook remain from potential corporate vulnerabilities,[9] a progressive reduction in supply-side bottlenecks expected over the coming quarters should support investment prospects.
Housing investment continued to increase in the second quarter and is expected to remain buoyant, despite increasing supply-side headwinds. Housing investment increased by 0.9% quarter on quarter in the second quarter to exceed its pre-crisis level of the last quarter of 2019 by 1.2%. Housing investment in the euro area is expected to continue on a positive trend in the second half of 2021, despite a further tightening of supply constraints. While the European Commission’s indicator for recent trends in construction production declined slightly in the first two months of the third quarter, it remained well above its long-run average. The Purchasing Managers’ Index (PMI) for housing activity increased in August compared with the previous month, rising further into positive growth territory. According to the European Commission’s survey data, demand for housing has been robust until recently, as reflected in both the high level of consumers’ short-term intentions to buy or build a house and a further significant increase in companies’ assessments of the overall level of orders. While the expiry of some crisis-related government support measures may lead to some normalisation in housing demand, currently the development of housing investment is particularly affected by supply constraints. These have continued to tighten, with further increases in perceived limits to construction production as a result of shortages of materials and labour in July and August, following already sharp rises in the second quarter. Supply-side bottlenecks are also reflected in the PMI surveys for the construction sector, which show very long supplier delivery times. Overall, these supply constraints are likely to pose some risks to the ongoing strength in housing investment in the near term.
Euro area export growth continued to be moderate in the second quarter of 2021. Euro area exports increased by 2.2% in the second quarter of 2021, affected by sluggish manufacturing exports, as shipping and input-related constraints continued to exert a drag.[10] Nominal data on exports in goods posted a 0.7% month-on-month contraction in June. The decline was across the board, with Turkey, North America and Mexico being the only exceptions among major export destinations. Looking ahead, order-based indicators for goods exports signal a strong, albeit moderating momentum as global activity and trade normalise. Services exports are expected to improve further, with an easing of restrictions on mobility supporting travel services exports. Euro area goods imports and intra-euro area trade, which had displayed marked rates of growth driven by the strong recovery in domestic demand, weakened in June. As total imports increased by 2.3% quarter on quarter, net trade delivered a slightly positive (0.1 percentage point) contribution to GDP in the second quarter of 2021.
Incoming information points to a further improvement in euro area activity in the second half of the year. While survey data have recently moderated from their late-June highs, they remain consistent with continued robust growth in the third quarter of 2021, albeit subject to ongoing and broadening supply constraints, particularly in manufacturing (Chart 11). The composite output PMI increased further, averaging 59.6 over July and August, albeit with a modest levelling off in August, compared with 56.8 in the second quarter. This mainly reflects the further strengthening in services activity, while activity in the manufacturing sector, although still strong, continues to be affected by supply-side bottlenecks. The European Commission’s Economic Sentiment Indicator is also consistent with stronger third-quarter growth, despite a modest decline in August from the historical high seen in July. Consumer confidence remains at elevated levels following the lifting of most restrictions on leisure activities as solid progress with vaccination campaigns has helped contain hospitalisations and deaths despite some resurgences in infection numbers in recent months. Investment intentions continue to improve, and progress with the implementation of Next Generation EU funds and an accommodative monetary policy continues to support the recovery and broader financial stability. However, uncertainty remains high – not least with respect to the spread of new and more contagious variants and persisting constraints on production from ongoing supply-side bottlenecks – and it is not yet clear that all sectors will recover soon or fully from the impact of the pandemic.
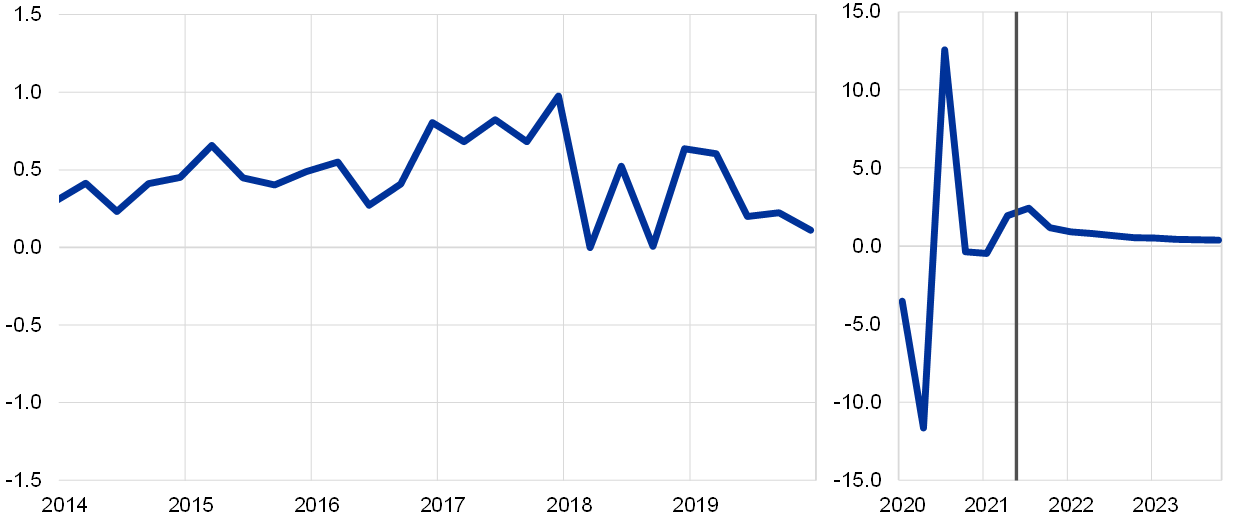
The ongoing COVID-19 pandemic continues to pose challenges to the outlook, yet the recovery remains on track. Notwithstanding modest extensions of localised containment measures and ongoing production bottlenecks in some euro area countries, the growth outlook remains buoyant as a result of a broadening of the rebound in euro area activity across the main sectors, continued progress on vaccination campaigns, a benign labour market, pandemic-related learning effects and strong foreign demand, as well as ongoing support from monetary and fiscal policy. This is reflected in the September 2021 ECB staff macroeconomic projections for the euro area, which foresee annual real GDP growth of 5.0% in 2021, 4.6% in 2022 and 2.1% in 2023 (Chart 13). The 0.4 percentage point upward revision in growth for 2021 largely reflects the stronger-than-expected outcomes in the first two quarters of the year than in the June projections, with some offset to the quarter-on-quarter growth envisaged for the second half of the year. The growth profile for 2022 and 2023 remain broadly unchanged. Euro area activity is projected to return to quarterly pre-pandemic levels by the final quarter of 2021, one quarter earlier than envisaged in the June 2021 projections, driven by a successive firming up of domestic demand, given an assumed continuing relaxation of containment measures over the coming quarters, a resolution of supply-side bottlenecks by early 2022, a further strengthening of the global recovery and ongoing substantial policy support.[11]
Chart 13
Euro area real GDP growth (including projections)
(quarter-on-quarter percentage changes, seasonally and working day-adjusted quarterly data)
Sources: Eurostat and the article entitled “ECB staff macroeconomic projections for the euro area, September 2021”, published on the ECB’s website on 9 September 2021.
Notes: Data are seasonally and working day-adjusted. Historical data may differ from the latest Eurostat publications due to data releases after the cut-off date for the projections. The vertical line indicates the start of the projection horizon. This chart does not show ranges around the projections. This reflects the fact that the standard computation of the ranges (based on historical projection errors) would not capture the elevated uncertainty related to the COVID-19 pandemic. Instead, alternative scenarios based on different assumptions regarding the future evolution of the COVID-19 pandemic, the associated containment measures and the degree of economic scarring are provided in Box 4 of the article entitled “ECB staff macroeconomic projections for the euro area, September 2021”.
4 Prices and costs
According to Eurostat’s flash estimate, euro area annual HICP inflation increased further, to 3.0% in August, up from 2.2% in July and 1.9% in June 2021. Inflation is expected to rise further this autumn but to decline next year. The temporary upswing in inflation mainly reflects the strong increase in oil prices since around the middle of last year, the reversal of the temporary VAT reduction in Germany, delayed summer sales in 2020 and cost pressures that stem from temporary shortages of materials and equipment. In the course of 2022, these factors should ease or will fall out of the year-on-year inflation calculation. Underlying inflation pressures have edged up. As the economy recovers further, underlying inflation is expected to rise over the medium term, supported by monetary policy measures. This increase is expected to be only gradual, since it will take time for the economy to return to operating at full capacity, and therefore wages are expected to grow only moderately. Measures of longer-term inflation expectations have continued to increase but remain some distance from the 2% target. This assessment is reflected in the September 2021 ECB staff macroeconomic projections for the euro area, which foresee annual HICP inflation at 2.2% in 2021, at 1.7% in 2022 and at 1.5% in 2023 and annual HICP inflation excluding energy and food at 1.3% in 2021, 1.4% in 2022 and 1.5% in 2023. Compared with the June 2021 Eurosystem staff macroeconomic projections, the outlook for inflation was revised upwards for both headline HICP inflation and HICP inflation excluding energy and food.
Annual HICP inflation increased in July and August, owing largely to temporary factors. According to Eurostat’s flash estimate, HICP inflation stood at 3.0% in August, up from 2.2% in July and 1.9% in June (Chart 14). An acceleration in energy prices due to positive base effects and strong month-on-month price increases – amounting to an annual rate of change of 15.4% in August – was a major driver of recent inflation increases. Food price dynamics also strengthened, from 0.5% year on year in June to 1.6% in July and further to 2.0% in August. HICP inflation excluding energy and food (HICPX) reached 1.6% in August, after having declined from 0.9% in June to 0.7% in July. The recent volatility in HICPX inflation was mainly shaped by movements in the non-energy industrial goods (NEIG) component, where prices increased sharply in August compared with one year earlier. The share of items for which prices were imputed remained at the low level reached in June, keeping at bay the uncertainty surrounding the signal for underlying price dynamics compared with the early months of the year.[12]
Chart 14
Headline inflation and its components
(annual percentage changes; percentage point contributions)

Sources: Eurostat and ECB calculations.
Notes: The latest observations are for August 2021 (flash estimate).
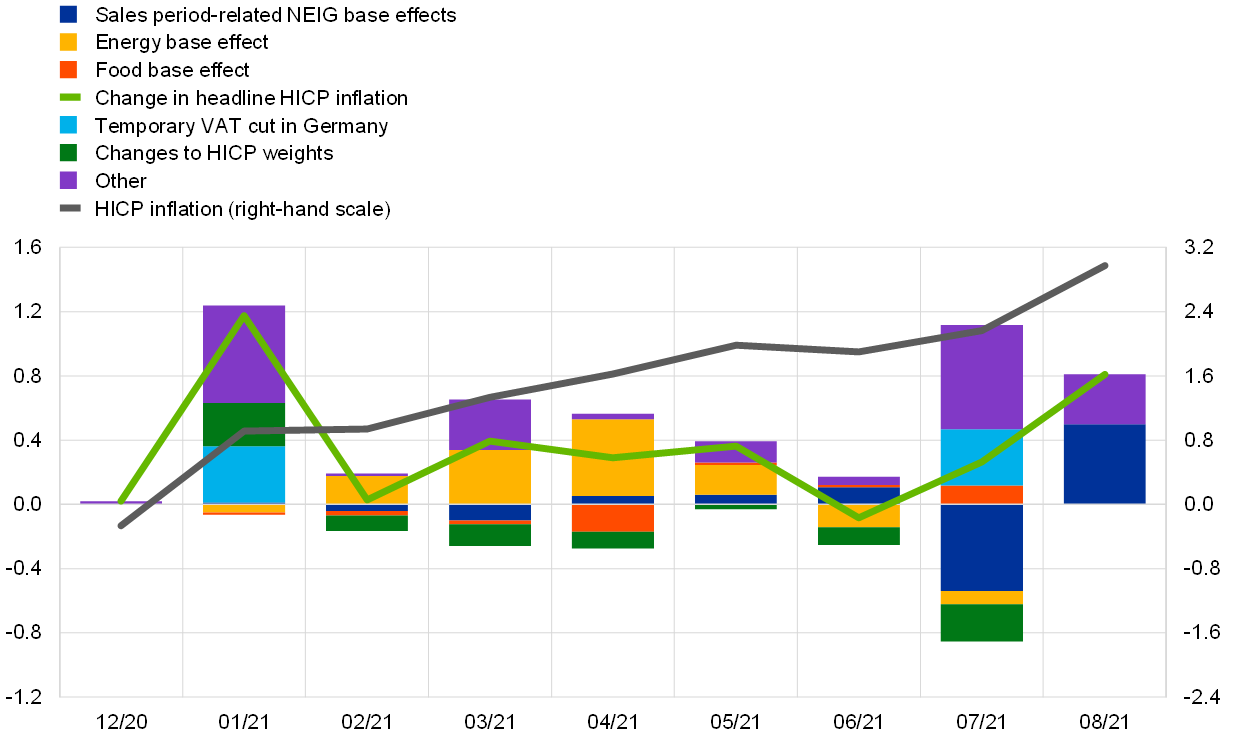
In addition to the upward impact of energy prices, headline inflation has continued to be influenced by other temporary factors (Chart 15). These factors have been shaping the inflation profile in recent months. The reversal in January 2021 of the temporary VAT cut in Germany in the second half of 2020 implies upward base effects for the second half of this year. Changes in the timing and scope of sales periods in shops in some euro area countries had a strong upward impact on the year-on-year rate of change in NEIG prices (2.7% in August, up from 0.7% in July), pushing it well above its 0.6% long-term average. Base effects related to sales periods accounted for around 0.5 percentage points in the increase in NEIG inflation from July to August. That said, recent increases were also partly related to price pressures along the supply chain stemming from delivery and production bottlenecks. Estimates suggest that there was no further impact from the change in the 2021 HICP weights in August (Chart 15), implying that the downward impact on the annual inflation rate in August was of the same magnitude as in July. Net of the effects of changes in HICP weights, headline inflation and HICPX inflation are estimated to have been almost half a percentage point higher in August. HICP weight effects are expected to imply some volatility over the coming months. Most factors currently driving headline inflation can be expected to fade out from annual growth rates in early 2022. This holds true particularly for the VAT impact and the currently very high energy inflation rate of more than 10% since April 2021.
Chart 15
Contributions of base effects and other temporary factors to monthly changes in annual HICP inflation
(percentage point changes and contributions)
Sources: Eurostat, Deutsche Bundesbank, September NIPE and ECB calculations.
Notes: The contribution made by the temporary VAT cut in Germany is based on estimates provided in the Deutsche Bundesbank’s November 2020 Monthly Report. The effects of weights in August are assumed to be equal to the effects in July but these may change with the final HICP release once proper estimates can be calculated. The latest observations are for August 2021.
Most measures of underlying inflation moved upwards recently and, in some cases, stood above the rates observed prior to the coronavirus (COVID-19) pandemic (Chart 16). Except for HICPX, the latest available data point for measures of underlying inflation is July 2021. HICPXX inflation, i.e. HICPX excluding clothing and travel‑related items, increased to 1.6% in July, from 1.4% in June. The model-based Persistent and Common Component of Inflation (PCCI), which is less affected by changes in weights and the temporary VAT cut in Germany, increased to 1.6% in July, from 1.5% in June. The Supercore measure increased in July to 1.0%, from 0.8% in June. The share of items in the HICPX with price changes above 2% increased to 36% in July, thus standing higher than in the pre-pandemic period. However, measures of underlying inflation remain clearly below 2% at the current juncture.[13]
Chart 16
Measures of underlying inflation
(annual percentage changes)

Sources: Eurostat and ECB calculations.
Notes: The contribution made by the temporary VAT cut in Germany is based on estimates provided in the Deutsche Bundesbank’s November 2020 Monthly Report. The latest observations are for August 2021 for the HICPX (flash estimate) and for July 2021 for all other measures.
Pipeline price pressures for NEIG items have continued to increase over recent months. Domestic producer price inflation for sales of non-food consumer goods, which is an indicator of price pressures at the later stages of the supply chain, edged up to 1.9% in July – from 1.4% in June and 1.3% in May – reaching levels well above its long-term average of 0.6%. The corresponding annual rate of import price inflation turned positive, standing at 1.2% in July and 0.1% in June, up by 2.0 percentage points and 0.9 percentage points from its May level, respectively. This may in part reflect some upward pressure from the recent depreciation of the euro effective exchange rate. Earlier in the domestic pricing chain, intermediate goods prices rose at annual rates of 12.6% in July and 10.7% in June, up by 3.3 percentage points and 1.4 percentage points from May, respectively. Import price inflation also rose, from 10.6% in May to 12.5% in June and 13.8% in July. Additional upward pressures on NEIG inflation from recent input cost developments could therefore still be expected in the months ahead. However, the magnitude and timing of the pass-through to final production stages and consumer prices remain uncertain. They will mainly depend on how persistent the global input cost shocks turn out to be over the coming quarters.
Wage growth measures in the euro area are influenced by temporary factors. Annual growth in compensation per employee increased to 8.0% in the second quarter, from 1.9% in the first quarter (Chart 17). This strong increase is driven by the annual growth rate of hours worked per employee, which rose to 12.4% in the second quarter, resulting from pandemic-related base effects. The annual growth in compensation per hour decreased to -3.9% in the second quarter, from 3.1% in the previous quarter, with the increase in hours worked per employee outweighing the increase in compensation per employee. Negotiated wages increased by 1.7% in the second quarter of the year, compared with 1.4% in the first quarter of 2021, mainly driven by pandemic-related one-off payments in individual countries.
Chart 17
Contributions made by components of compensation per employee
(annual percentage changes; percentage point contributions)

Sources: Eurostat and ECB calculations.
Notes: The long-term average growth rate of compensation per employee is computed starting from the first quarter of 1999. The latest observations are for the second quarter of 2021.
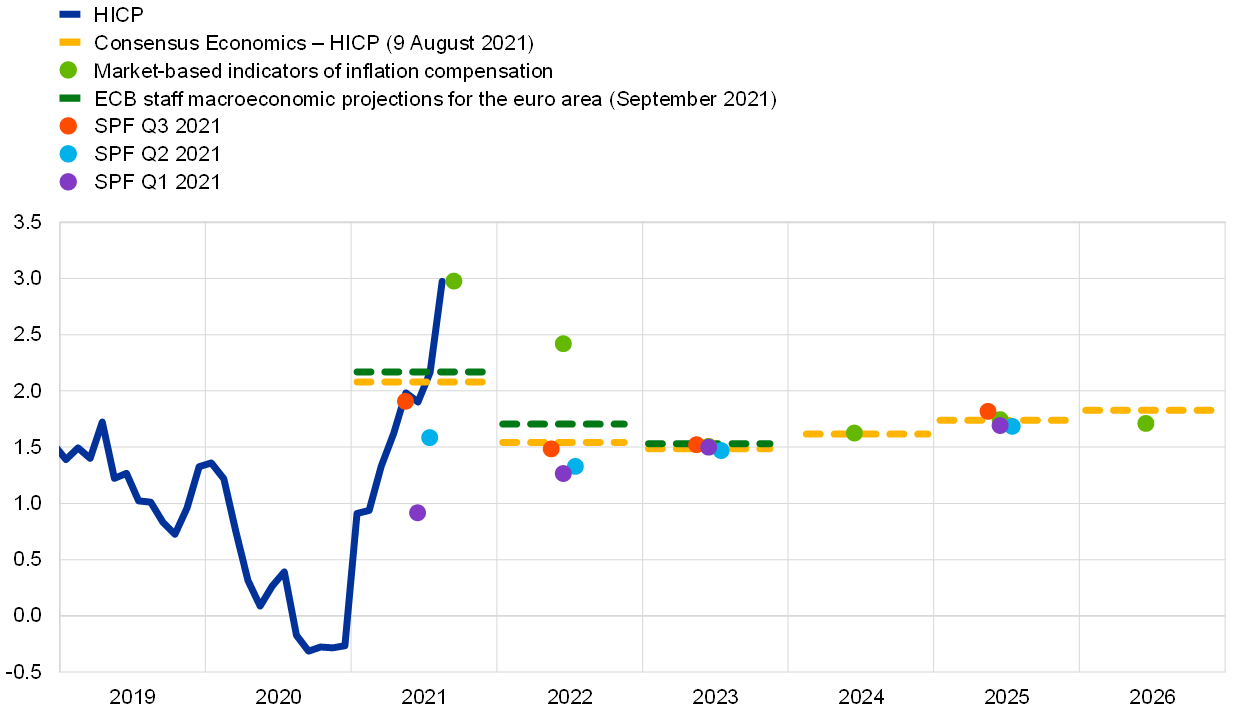
Market-based indicators of longer-term inflation compensation increased, while survey-based measures of inflation expectations reaffirm signs of an inflection point across different time horizons. Longer-term inflation-linked swap (ILS) rates have risen since the middle of July 2021. For instance, the euro area five-year/five-year forward ILS rate increased by around 10 basis points over the review period, to reach 1.7% for the first time in almost three years. A gradual internalisation by market participants of the ECB’s new definition of its inflation target, and of subsequent revisions to forward guidance in this regard, may have contributed to this pick-up in market-based inflation compensation. According to the ECB Survey of Professional Forecasters (SPF) for the third quarter of 2021 and the latest releases from Consensus Economics, survey-based longer-term inflation expectations have been revised upwards compared with the second quarter of the year (Chart 18).
Chart 18
Survey-based indicators of inflation expectations and market-based indicators of inflation compensation
(annual percentage changes)
Sources: Eurostat, Thomson Reuters, Consensus Economics, ECB (SPF) and ECB calculations.
Notes: The market-based indicators of the inflation compensation series are based on the one-year spot inflation rate and the one-year forward rate one year ahead, the one-year forward rate two years ahead, the one-year forward rate three years ahead and the one-year forward rate four years ahead. The latest observations for market-based indicators of inflation compensation are for 8 September 2021. The ECB Survey of Professional Forecasters (SPF) for the third quarter of 2021 was conducted in July 2021. The cut-off date for the ECB staff macroeconomic projections for the euro area was 26 August 2021 (and 16 August 2021 for assumptions).
The September 2021 ECB staff macroeconomic projections foresee headline inflation continuing to increase moderately until the end of this year, before falling back in the first half of 2022, with a gradual strengthening towards the end of the projection horizon. Projections for headline HICP inflation point to an average of 2.2% in the course of 2021, peaking in the fourth quarter of 2021 due to various prominent base effects. Headline inflation is projected to decrease to 1.7% in 2022 and to 1.5% in 2023 (Chart 19). Compared with the June 2021 Eurosystem staff macroeconomic projections, HICP inflation rates have been revised upwards by 0.3 percentage points for 2021, by 0.2 percentage points for 2022 and by 0.1 percentage points for 2023. This reflects higher figures seen in recent data for both inflation and economic activity, as well as increased supply-side pressures stemming from global disruptions to the supply chain. Looking through the temporary surge in inflation in 2021, the inflation profile over the medium term suggests increasing upward price pressures from the recovery in economic activity and demand, while supply-side upward price pressures are expected to wane. HICP inflation excluding energy and food is expected to reach 1.3% in 2021, 1.4% in 2022 and 1.5% in 2023, with upward revisions by 0.2 percentage points in 2021, 0.1 percentage points in 2022 and 0.1 percentage points in 2023 compared with the June 2021 Eurosystem staff macroeconomic projections.
Chart 19
Euro area HICP inflation (including projections)
(annual percentage changes)
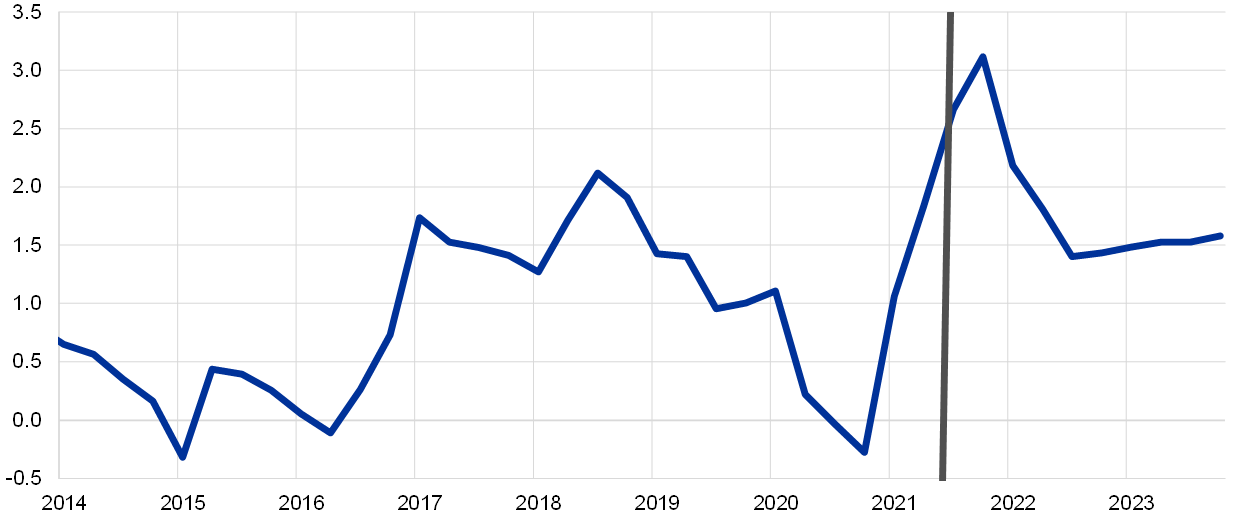
Sources: Eurostat and the article entitled “ECB staff macroeconomic projections for the euro area, September 2021”, published on the ECB’s website on 9 September 2021.
Notes: The vertical line indicates the start of the projection horizon. The latest observations are for the second quarter of 2021 (data) and the fourth quarter of 2023 (projections). The cut-off date for data included in the projections was 26 August 2021 (and 16 August 2021 for assumptions).
5 Money and credit
Money creation in the euro area moderated in July 2021, normalising further after the significant monetary expansion associated with the earlier waves of the coronavirus (COVID-19) pandemic. Domestic credit remained the dominant driver of money creation, with Eurosystem asset purchases being the most prominent contributor. Loan growth to the private sector stabilised close to lower, pre-pandemic, long-term levels, while financing conditions remained very favourable. The total volume of external financing for firms moderated in the second quarter of 2021. Compared with April 2021, the overall cost of firms’ external financing increased somewhat in July 2021, mainly on account of higher cost of equity, with the cost of market-based debt declining slightly and the cost of bank lending remaining broadly unchanged.
Broad money growth moderated in July 2021. The annual growth rate of M3 fell to 7.6% in July, down from 8.3% in June (Chart 20), as it continued to be affected by negative base effects linked to the exceptionally high liquidity needs in the first half of 2020. The quarterly pace of money growth reverted to its longer-term average, with shorter-run dynamics of broad money reflecting a robust pace of money creation on the back of significant policy support. On the components side, the main driver of the high level of M3 growth was the narrow aggregate M1, which includes the most liquid components of M3. The annual growth rate of M1 fell to 11.0% in July, down from 11.8% in June, mainly as a result of slowing growth in overnight deposits made by firms and households. While the contribution of other short-term deposits remained negative in July, marketable instruments continued to make a small contribution to annual M3 growth, given the low level of interest rates and search-for-yield behaviour displayed by investors.
Chart 20
M3, M1 and loans to the private sector
(annual percentage changes; adjusted for seasonal and calendar effects)
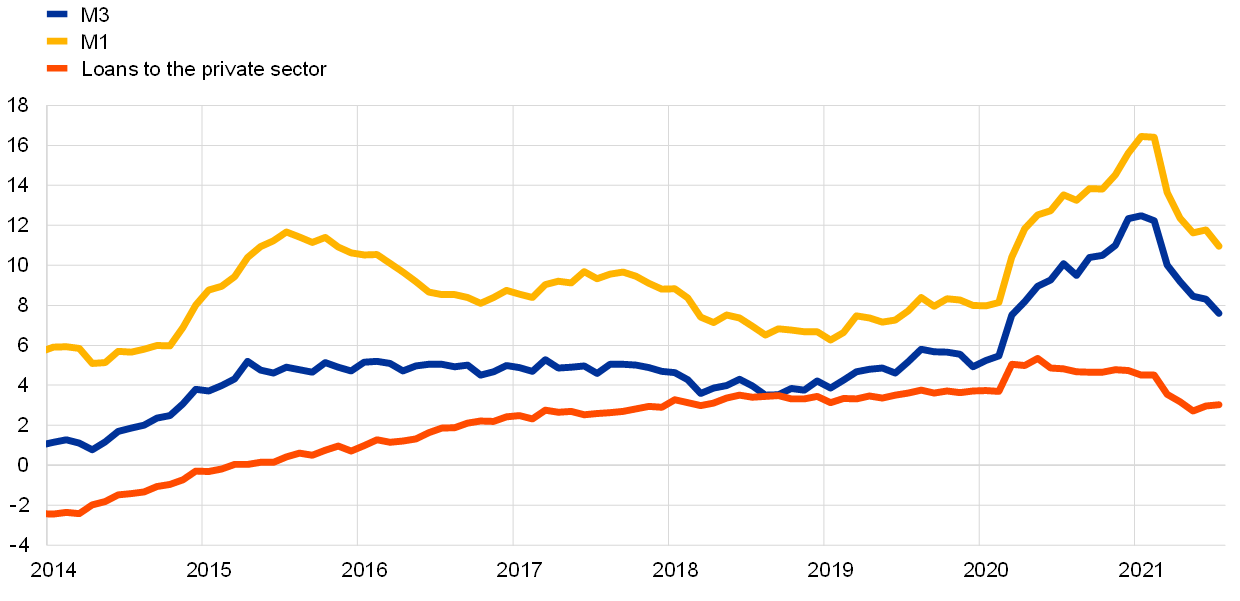
Source: ECB.
Notes: Loans are adjusted for loan sales, securitisation and notional cash pooling. The latest observations are for July 2021.
Growth in overnight deposits moderated further. The annual growth rate of overnight deposits fell to 11.3% in July, down from 12.2% in June, driven mainly by firms and households. Money holders’ strong preference for overnight deposits during the pandemic had largely reflected precautionary motives. Over recent months, amid progress on vaccination and a rebound of economic activity, the accumulation of bank deposits by firms and households has returned to the lower pre-pandemic pace. Growth in deposit holdings by firms has varied across countries, reflecting differences in liquidity needs and national fiscal support measures. Meanwhile, the annual growth rate of currency in circulation, which declined in May, remained broadly stable at 8.9% in July.
Money creation continued to be driven by Eurosystem asset purchases. As in previous months, the largest contribution to M3 growth came from the Eurosystem’s net purchases of government securities under the asset purchase programme (APP) and the pandemic emergency purchase programme (PEPP) (red portion of the bars in Chart 21). Further support for M3 growth came from credit to the private sector (blue portion of the bars). Bank credit to general government made a negative contribution to money creation, owing to sales of government bonds and reduced issuance of government securities (light green portion of the bars), while net external monetary flows had a broadly neutral effect on money creation (yellow portion of the bars). Furthermore, other counterparts continued to dampen broad money growth (dark green portion of the bars), while favourable conditions for targeted longer‑term refinancing operations (TLTROs) continued to support the substitution of bank funding away from longer-term liabilities.
Chart 21
M3 and its counterparts
(annual percentage changes; contributions in percentage points; adjusted for seasonal and calendar effects)
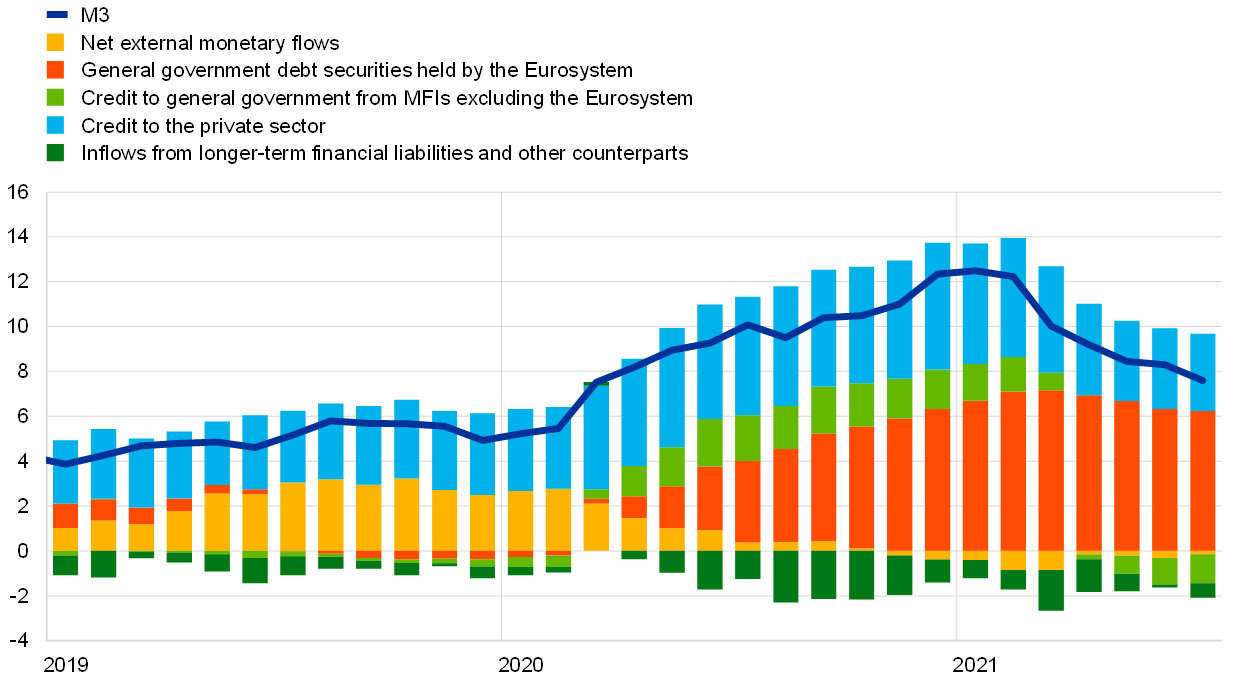
Source: ECB.
Notes: Credit to the private sector includes loans to the private sector by monetary financial institutions (MFIs) and MFIs’ holdings of debt securities issued by the euro area private non-MFI sector. As such, it also covers purchases by the Eurosystem of non-MFI debt securities under the corporate sector purchase programme (CSPP). The latest observations are for July 2021.
Loan growth to the private sector stabilised close to lower, pre-pandemic levels. The annual growth rate of bank loans to the private sector stood at 3.0% in July (Chart 20). Lending to firms and households continued to benefit from favourable financing conditions and the ongoing economic recovery. The annual growth rate of loans to firms weakened slightly to 1.7% in July, down from 1.8% in June, while the growth rate for loans to households increased to 4.2%, up from 4.0% in June, driven by mortgage lending (Chart 22). The somewhat slower growth of lending to firms is mainly due to the fact that firms are still well funded because they borrowed heavily in the first wave of the pandemic. They have high cash holdings and are increasingly retaining earnings, which reduces the need for external funding. Overall, these developments mask considerable differences across countries, which among other things reflects the uneven progress of the economic recovery.
Chart 22
MFI loans in selected euro area countries
(annual percentage changes; standard deviation)
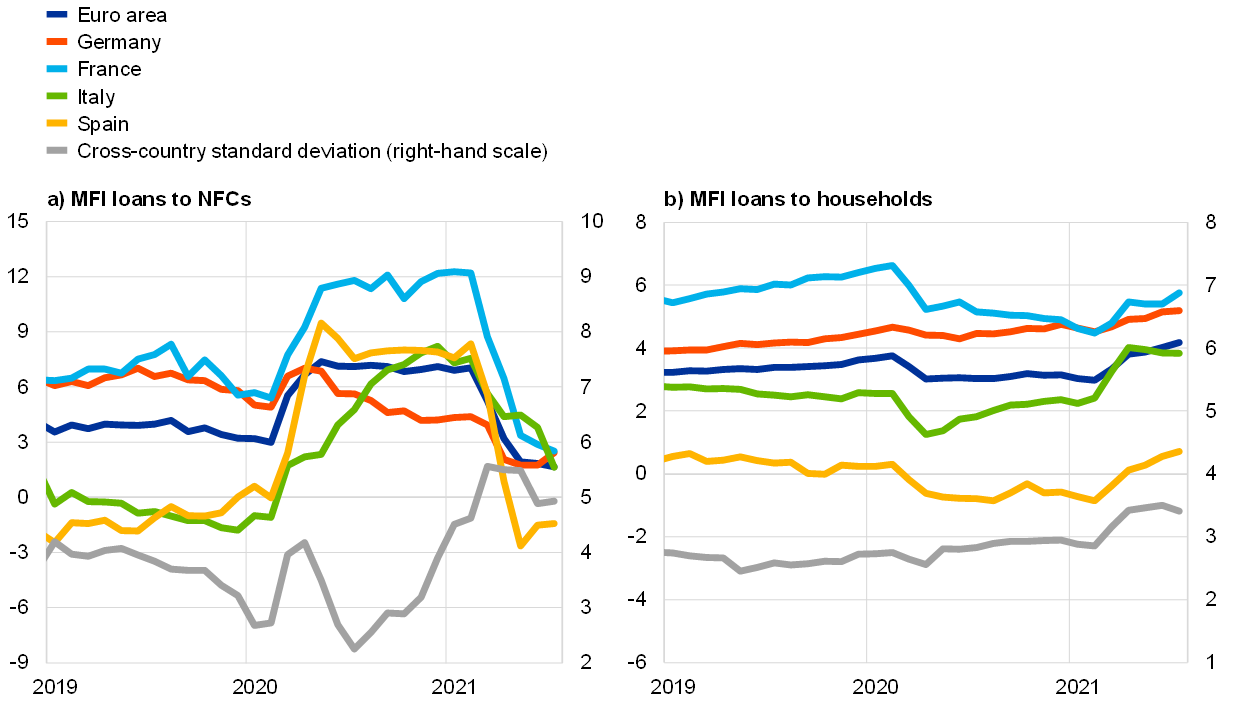
Source: ECB.
Notes: Loans are adjusted for loan sales and securitisation; in the case of non-financial corporations (NFCs), loans are also adjusted for notional cash pooling. The cross-country dispersion is calculated on the basis of minimum and maximum values using a fixed sample of 12 euro area countries. The latest observations are for July 2021.
Debt funding costs for euro area banks remained below pre-pandemic levels, supported by the ECB’s monetary policy measures. The composite cost of debt financing declined further to new lows (Chart 23) on the back of several factors. First, a steepening of the yield curve, which had led to an increase in the cost of bond financing in the first half of 2021, has been reabsorbed. Second, euro area banks have, since the onset of the pandemic, charged negative interest rates on an increasing share of corporate deposits, while the share of negative rates to households has also increased, albeit from relatively small levels owing to their stickiness. Third, available targeted longer-term refinancing operations (TLTRO III), which provide banks with liquidity at very favourable conditions, contributed to a further easing of overall funding conditions. Fourth, the ECB’s APP and PEPP continue to help reduce the divergences in funding conditions across countries, risk classes and maturities to levels observed before the pandemic. The Next Generation EU programme is also supportive, as it should contribute to a stronger and more uniform recovery across the euro area, leading to a compression or credit risk across the euro area. Finally, prices for covered bank bonds are directly supported by the ECB’s third covered bond purchase programme (CBPP3).
Chart 23
Banks’ composite cost of debt financing
(composite cost of deposits and unsecured market-based debt financing; percentages per annum)
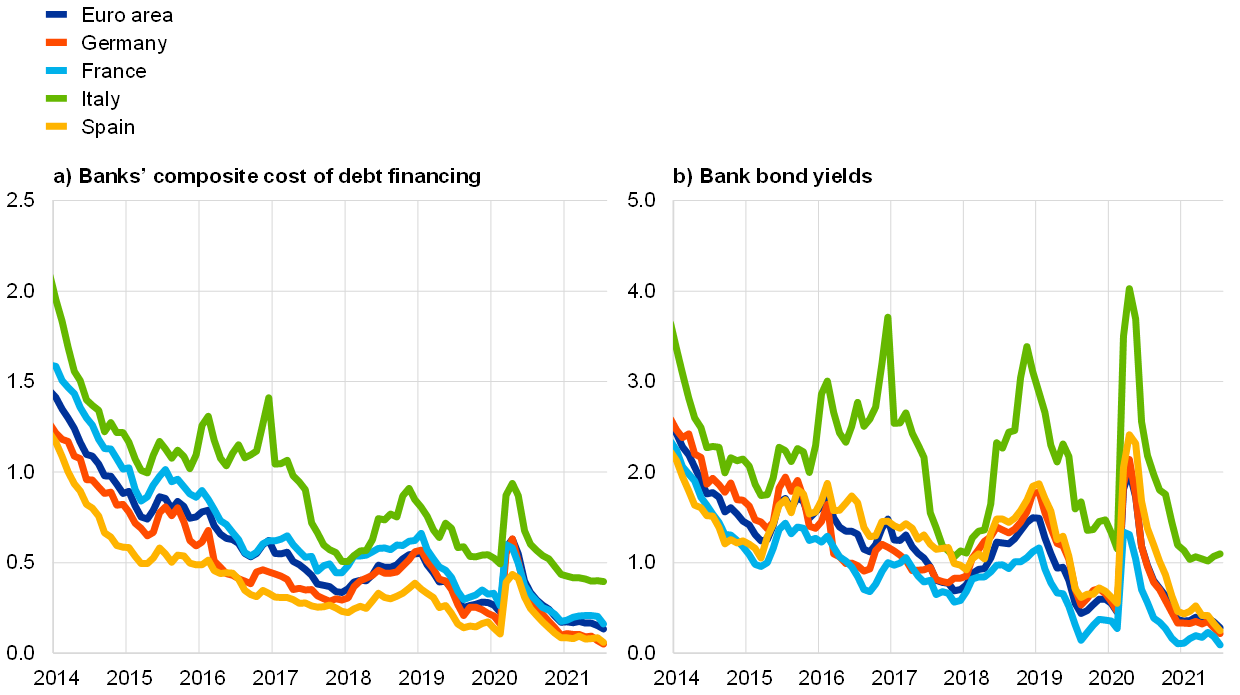
Sources: ECB, Markit iBoxx and ECB calculations.
Notes: The composite cost of deposits is calculated as an average of new business rates on overnight deposits, deposits with an agreed maturity and deposits redeemable at notice, weighted by their corresponding outstanding amounts. Bank bond yields refer to monthly averages of senior-tranche bonds. The latest observations are for July 2021.
Bank lending rates remained close to their historic lows. In July 2021 the composite bank lending rates for loans to non-financial corporations (NFCs) and to households for house purchase remained broadly unchanged at 1.47% and 1.32% respectively (Chart 24). These developments, which mask some differences across the largest euro area countries, maturity buckets and loan sizes, reflect the ongoing impact of the ECB’s monetary policy measures. The spread between bank lending rates on very small loans and on large loans has stabilised further at pre-pandemic levels. Despite the considerable uncertainty regarding the pandemic’s longer-term impact on the economy, policy support measures prevented a broad-based tightening of financing conditions which could have amplified the initial adverse economic impact.
Chart 24
Composite bank lending rates in selected euro area countries
(percentages per annum (three-month moving averages); standard deviation)
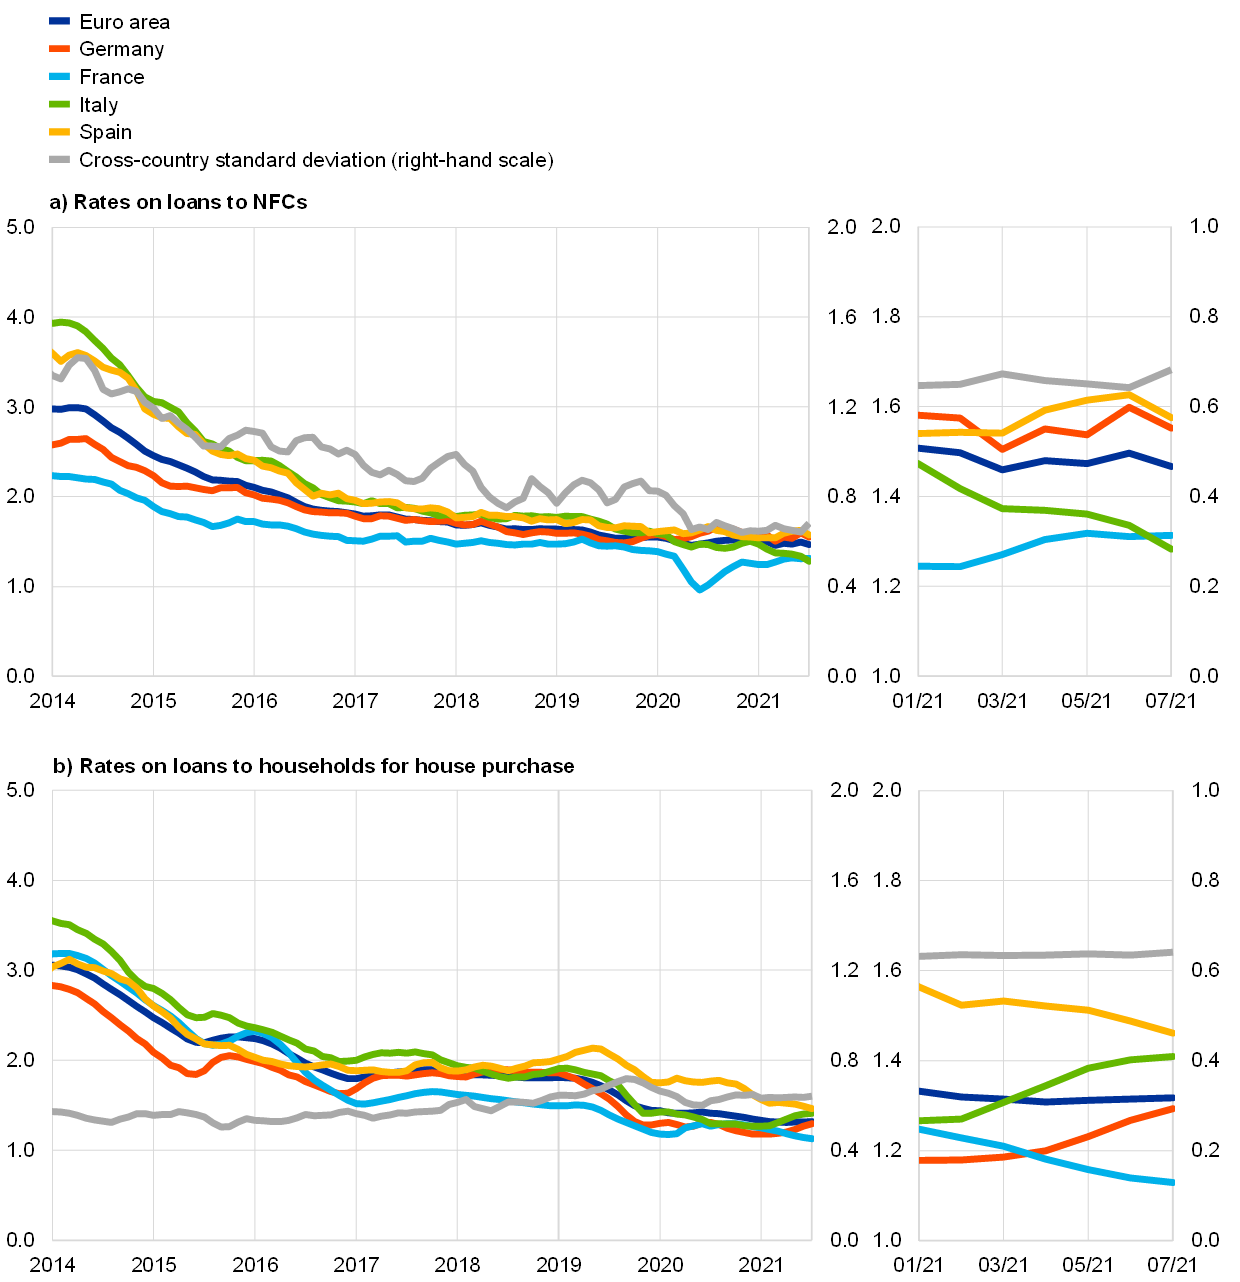
Source: ECB.
Notes: These indicators of the total cost of bank lending are calculated by aggregating short and long-term rates using a 24-month moving average of new business volumes. The cross-country standard deviation is calculated using a fixed sample of 12 euro area countries. The latest observations are for July 2021.
The total volume of external financing for firms moderated in the second quarter of 2021. The annual growth rate of external financing decreased from 4.3% in March to 2.2% in June (Chart 25, panel a), although external financing flows continued to benefit from favourable financing conditions. In the second quarter of 2021, the net issuance of listed shares surged while lower external financing flows mostly stem from the moderation of bank loans to firms. This deceleration appears to reflect benign developments linked to higher cash holdings and retained earnings, sizeable liquidity buffers, attractive conditions for market-based debt and the lower loan intensity of the sectors driving the recovery. Nevertheless, in an environment of abundant cash reserves and sustained policy support, firms have increasingly replaced short-term financing by instruments with longer maturities. This change in maturity supports the view that interest in using external finance for business investment, as opposed to liquidity buffers, has increased.
The total nominal cost of external financing for NFCs (comprising bank lending, debt issuance in the market and equity finance) has increased since April 2021. The cost of external financing stood at 4.4% in July (Chart 25, panel b), around 70 basis points below the peak seen in March 2020 and 35 basis points higher than the historic low recorded in March 2021. The increase observed in July 2021 largely stemmed from the higher cost of equity, which reflected an increase in the equity risk premium that overrode the overall decline in risk-free rates. That decline, in combination with further compression of corporate bond spreads especially in the high-yield segment, resulted in a slight further decrease in the cost of market-based debt, which reached values close to its historic low recorded in January 2021. The overall cost of financing is estimated to have remained virtually unchanged between July and 8 September. While the cost of equity was generally stable during this period, the cost of market-based debt exhibited greater volatility, falling to a historic low in August before returning to its July level on the back of rising risk-free rates.
Chart 25
External financing of euro area NFCs
(annual percentage changes)
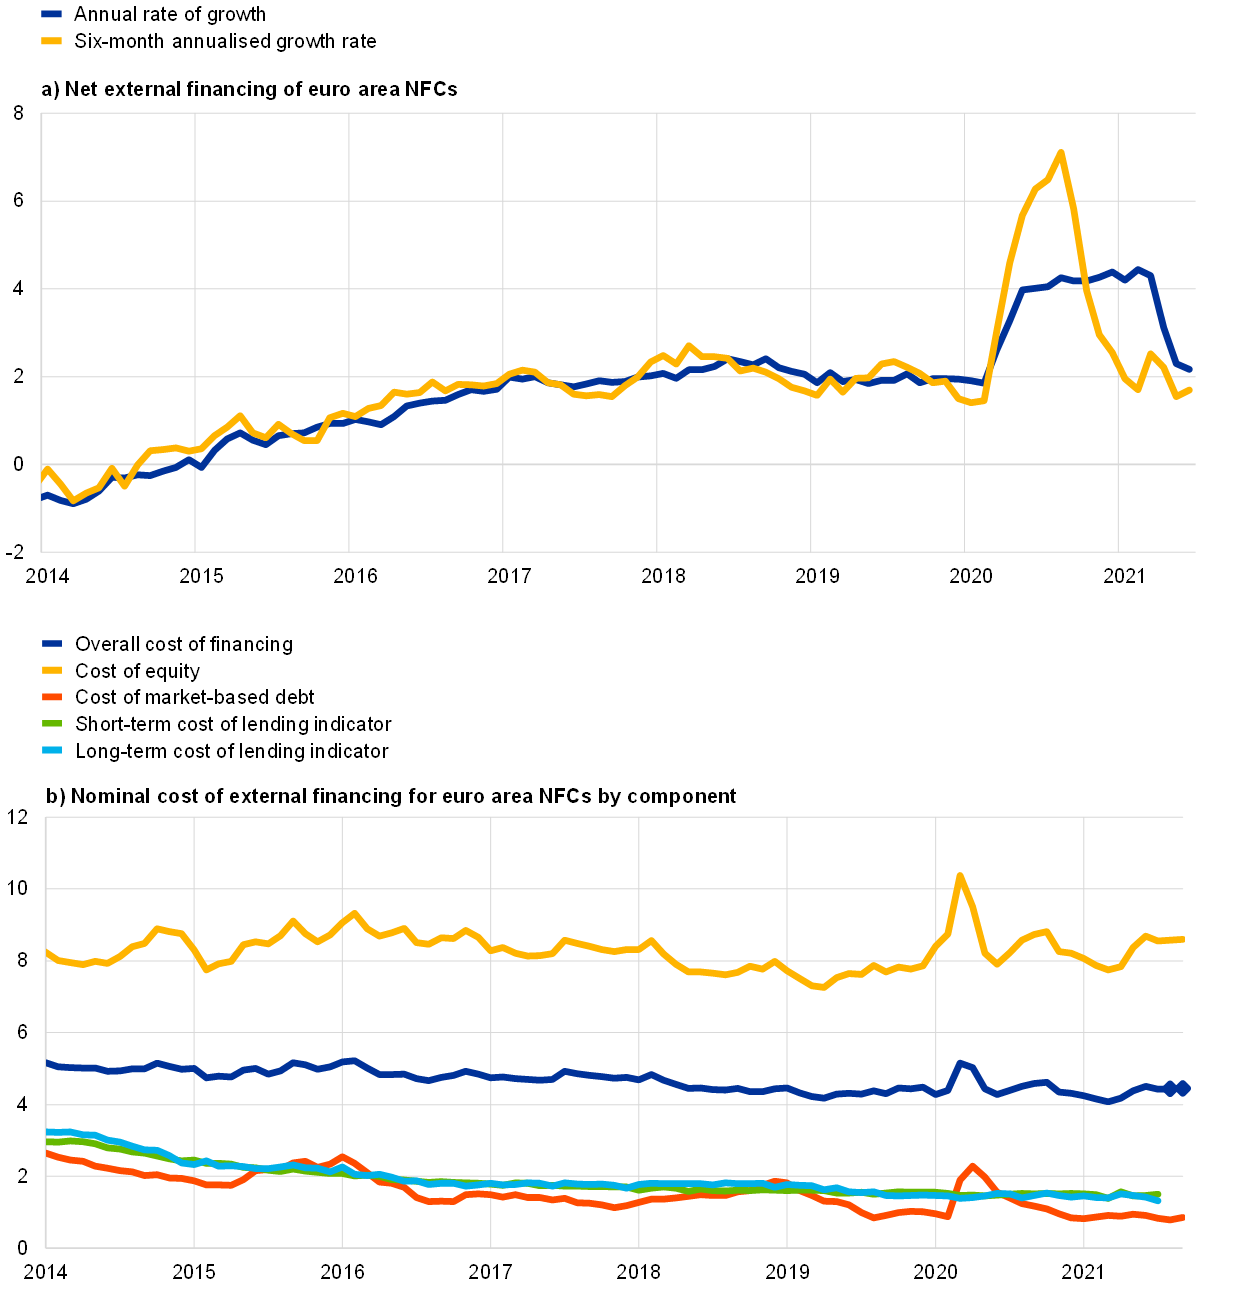
Sources: Eurostat, Dealogic, ECB, Merrill Lynch, Bloomberg, Thomson Reuters and ECB estimates.
Notes: Panel a): net external financing is the sum of MFI loans, net issuance of debt securities and net issuance of listed shares. MFI loans are adjusted for sales, securitisation and cash-pooling activities. Panel b): the overall cost of financing for NFCs is calculated as a weighted average of the cost of bank borrowing, market-based debt and equity, based on their respective outstanding amounts. The dark blue diamonds indicate nowcasts for the overall cost of financing in August and September 2021, assuming that bank lending rates remain unchanged at their July 2021 levels. The latest observations for panel a) are for June 2021. The latest observations for panel b) are for 8 September 2021 for the cost of market-based debt (monthly average of daily data), 3 September 2021 for the cost of equity (weekly data) and July 2021 for the cost of lending (monthly data).
Gross indebtedness of euro area non-financial corporations (NFCs) moderated from high levels in the second quarter of 2021 (Chart 26). The gross debt ratio, in terms of firms’ value added, decreased by 6 percentage points in the second quarter of 2021, on the back of strong growth in value added, reducing the cumulative increase since the end of 2019 to 12.7 percentage points. Overall, the broad-based increase in NFC gross indebtedness since early 2020 is mainly explained by greater recourse to debt financing. Gross debt increased unevenly across firm types and countries, reflecting differences in their exposure to the pandemic and the national policy response. Since firms have accumulated large volumes of liquid assets since the outbreak of the pandemic in March 2020, the net debt ratio has increased much less than the gross debt ratio. The fact that their gross indebtedness remains at an elevated level by historical standards suggests that their sensitivity to adverse shocks may still be high, to the extent that liquidity buffers differ across sectors. At the same time, fiscal policy measures have prevented firms from having a large negative funding shortfall amid strong negative gross savings. Overall, these developments suggest that the resilience of firms and their ability to increase business investment depend largely on an ongoing recovery and continued policy support.
Chart 26
Gross indebtedness of NFCs in selected euro area countries
(percentages of NFC gross value added)

Sources: ECB, Eurostat and ECB estimates.
Notes: Debt is defined as the sum of total loans granted to NFCs net of intra-sectoral lending, debt securities issued and pension liabilities. The blue diamond indicates the nowcast for the second quarter of 2021. Otherwise the latest observations are for the first quarter of 2021.
6 Fiscal developments
After a significant fiscal expansion since the start of the coronavirus (COVID-19) pandemic, only limited additional stimulus measures have been adopted over the last few months as 2022 budgetary plans are still in preparation and the economic recovery seems to be proceeding somewhat faster than anticipated. As a result, the September 2021 ECB staff macroeconomic projections include a fiscal outlook for the euro area that has improved compared with June. While the deficit ratio is projected to remain high in 2021, at 7.1%, after 7.3% in 2020, the subsequent improvement is foreseen to be swift as the pandemic abates and the economic recovery takes hold. The deficit ratio is thus expected to fall to 3.0% in 2022 and 2.1% at the end of the projection horizon in 2023. Mirroring these developments, euro area debt is projected to peak at just below 99% of GDP in 2021 and to decline to about 94% of GDP in 2023. Nonetheless, an ambitious and coordinated fiscal stance remains crucial, as a premature withdrawal of fiscal support would risk weakening the recovery and amplifying the longer-term scarring effects. At the same time, fiscal measures should remain temporary and countercyclical, while ensuring that they are sufficiently targeted in nature to address vulnerabilities effectively and to support a swift recovery in the euro area economy. As a complement to national fiscal measures, the Next Generation EU (NGEU) package is expected to play a key role by contributing to a faster, stronger and more uniform recovery.
According to the September 2021 ECB staff macroeconomic projections, the euro area general government budget balance will improve only marginally in 2021 but should recover strongly as of 2022.[14] The general government deficit ratio for the euro area was 7.3% of GDP in 2020, the largest deficit since the introduction of the euro. It is projected to decline only marginally in 2021 to 7.1% of GDP but then more strongly to 3.0% in 2022 and 2.1% in 2023 (Chart 27). The rise in the budget deficit in 2020 was largely attributable to a deterioration in the cyclically adjusted primary balance on the back of economic support measures in response to the pandemic amounting to around 4.2% of GDP. The crisis and recovery support is now projected to increase to about 4.6% of GDP in 2021. This reflects the fact that governments have prolonged emergency measures, gradually expanded their size and/or adopted new ones to support the recovery, including measures to be funded through the NGEU.[15] The deficit increase last year was also partly the result of a large negative cyclical component, which is expected to start declining, albeit only moderately, in 2021. The more significant improvement in the budget balance from 2022 onwards is projected to be driven by a higher cyclically adjusted primary balance, as a large share of the emergency measures (which are not funded by NGEU grants) will expire. Moreover, the negative contribution from the economic cycle is expected to fade swiftly as of 2022, turning positive in 2023. To a lesser extent, but over the whole projection horizon, the improvement in the budget balance will also be helped by gradually falling contributions from interest payments.
Chart 27
Budget balance and its components
(percentages of GDP)
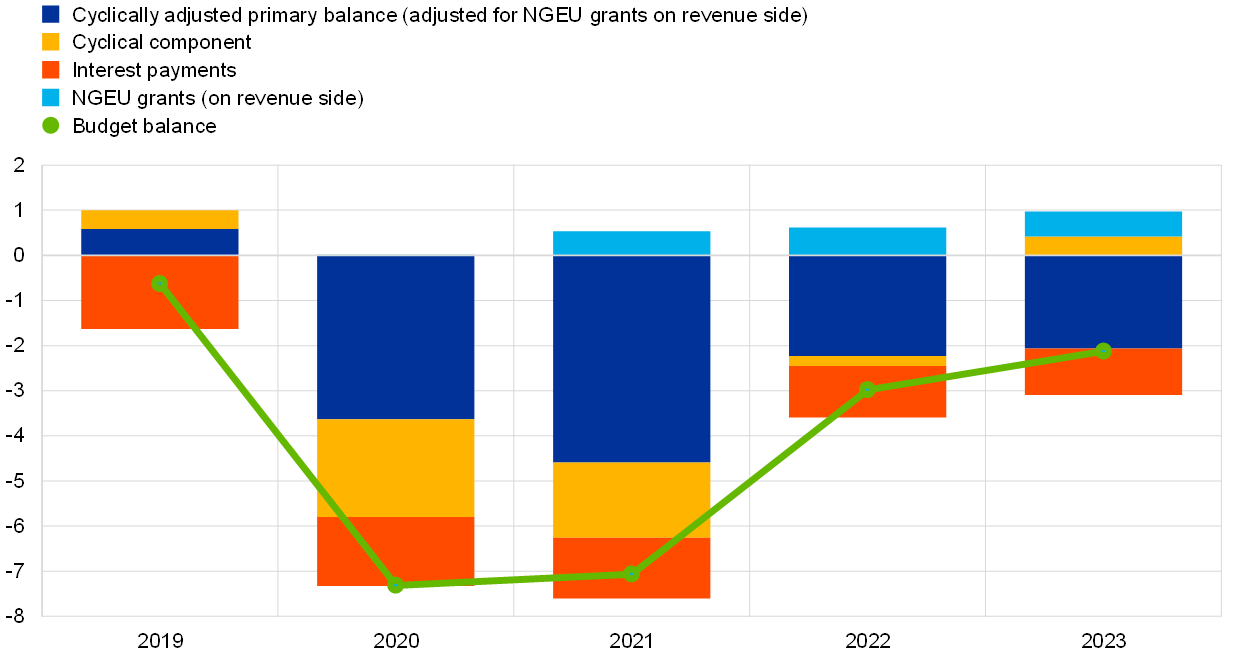
Sources: ECB and September 2021 ECB staff macroeconomic projections.
Note: The data refer to the aggregate general government sector of euro area countries.
The euro area aggregate fiscal stance was highly expansionary in 2020 and is projected to remain expansionary in 2021.[16] From these very high levels of support, a tightening of the fiscal stance is expected to take place in 2022, as the fiscal support fades along with the expiry of pandemic and temporary support measures. In 2023 the fiscal stance is projected to be broadly neutral.[17] This notwithstanding, the level of fiscal support to the economic recovery remains large over the whole projection horizon, which is reflected in the overall primary fiscal balance remaining firmly negative.
In addition to the fiscal support for their economies, euro area countries have provided sizeable loan guarantee envelopes to bolster the liquidity positions of firms. In total, these guarantee envelopes amount to around 19% of GDP for the euro area in 2021. The cumulative take-up of these guarantees over the period 2020-21 is estimated at 5% of GDP, broadly unchanged compared with the June 2021 Eurosystem staff macroeconomic projections. It should be noted that these figures mask significant differences in both the envelope and the take-up rate across countries. The loan guarantees are contingent liabilities for governments and any calls on the guarantees will therefore constitute additional public spending that increases government debt.
The budget balance in 2021 is foreseen to be close to the June 2021 Eurosystem staff macroeconomic projections, while the outlook for 2022 and 2023 has been revised more strongly upwards. Specifically, the euro area general government budget balance as a share of GDP has been revised up by 0.1 percentage points for 2021 and by 0.4 and 0.5 percentage points, respectively, for the subsequent two years. These revisions are mainly due to an improved cyclical component and, to a lesser extent, lower interest payments.
Following a large increase in the euro area aggregate government debt-to-GDP ratio in 2020, it is projected to peak at just below 99% in 2021, before declining gradually to about 94% in 2023. After a 14 percentage point increase in the debt ratio in 2020, in 2021 a still high primary deficit will be only partly compensated by a significant debt-reducing contribution from the interest-growth differential. In 2022 and 2023, however, the debt ratio will start falling as smaller primary deficits are more than offset by favourable contributions from interest-growth differentials and, to a lesser extent, by negative deficit-debt adjustments (Chart 28). As a result, at the end of the projection horizon in 2023, the debt-to-GDP ratio is expected to be almost 10 percentage points above its pre-crisis level. It should, however, be noted that the COVID-19 crisis has had a somewhat smaller adverse impact on the debt path than was generally expected in the initial phase of the crisis.[18]
Chart 28
Drivers of change in euro area government debt
(percentages of GDP, unless otherwise indicated)
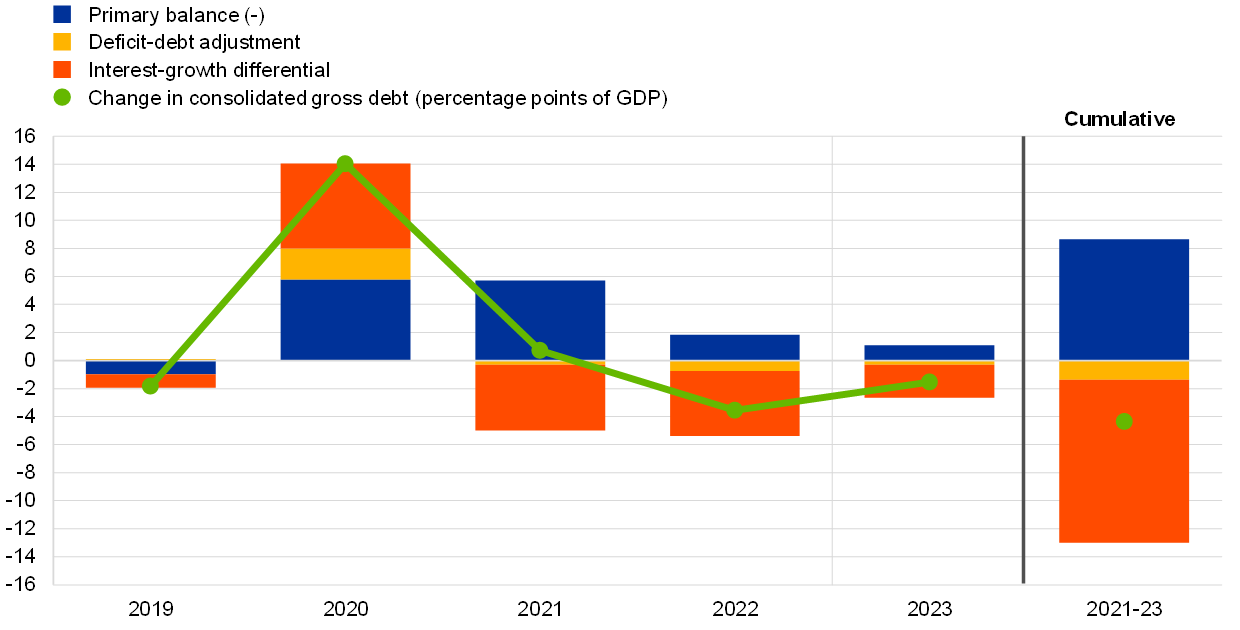
Sources: ECB and September 2021 ECB staff macroeconomic projections.
Note: The data refer to the aggregate general government sector of euro area countries.
National fiscal policies should continue to provide critical, timely and sufficiently targeted support to the firms and households most exposed to the ongoing pandemic. A premature withdrawal of fiscal support would risk weakening the recovery and amplifying the longer-term scarring effects. At the same time, fiscal measures should remain temporary and countercyclical, while ensuring that they are sufficiently targeted in nature to address vulnerabilities effectively and to support a swift recovery in the euro area economy. The gradual reduction of budgetary imbalances, once economic activity has sufficiently recovered, can be amplified by a decisive shift towards a more growth-friendly composition of public finances and structural reforms that raise the growth potential of euro area economies. The NGEU’s Recovery and Resilience Facility can provide important support in this respect, not least by accelerating the green and digital transitions.
Boxes
1 Comparing recent inflation developments in the United States and the euro area
After having declined in 2020, headline inflation has increased strongly in both the United States and the euro area over recent months (Chart A). Base effects related to the recovery of energy prices from last year’s fall have played an important role in this increase ‒ both in the United States and the euro area.[19]
See more2 Liquidity conditions and monetary policy operations from 28 April to 27 July 2021
This box describes the ECB’s monetary policy operations and liquidity developments during the third and fourth reserve maintenance periods of 2021. Together, these two maintenance periods ran from 28 April to 27 July 2021 (the “review period”).
See more3 Non-financial corporate health during the pandemic
This box takes stock of the impact of the coronavirus (COVID-19) pandemic on the health of the euro area non-financial corporate sector. It also assesses the extent to which policy support measures have alleviated corporate financing strains and dampened upward pressure on their vulnerabilities. The analysis is based on quarterly sectoral accounts data for the euro area aggregate. Accordingly, the box provides an aggregate picture of the non-financial corporate sector, without distinguishing between individual countries, economic sectors, industries or firms.
See more4 The impact of supply bottlenecks on trade
Shipping disruptions and input shortages are leading to considerable bottlenecks in global supply chains. During the recovery phase of the coronavirus (COVID-19) pandemic, households increased their purchases of certain products, such as electronics and home improvement equipment, which caused a stronger-than-expected surge in demand, especially in some sectors. This rise in demand coupled with events beyond the reasonable control of suppliers (owing to force majeure), such as coronavirus outbreaks in ports, accidents at plants and adverse weather conditions, led to bottlenecks in the transport sector and caused shortages in specific inputs such as plastics, metals, lumber and semiconductors.[21] As inventories fell at the onset of the pandemic owing to the running-down of stocks and shortages of inputs resulting from closures and conservative inventory policies, companies struggled to keep up with the swift rise in demand and the replenishing of depleted stocks. This demand and supply imbalance is evidenced by the unprecedented lengthening of suppliers’ delivery times, especially in sectors relying on transportation and inputs from sectors experiencing shortages, namely computer and electronic equipment, machinery and equipment, wood products, motor vehicles and chemicals. Overall, in June the global PMI suppliers’ delivery times index dropped to an all-time low (meaning longer delivery times) since records began in 1999.
See more5 EU emissions allowance prices in the context of the ECB’s climate change action plan
In its climate change action plan, the ECB committed to accelerating the development of new models and conducting theoretical and empirical analyses to monitor the implications of climate change and related policies for the economy.[22] As a first step in its detailed roadmap of climate-related actions, the ECB envisages the inclusion of technical assumptions on carbon pricing in Eurosystem/ECB staff projections.[23] Complementing the current technical assumptions in this way will provide the basis for expanding economic models used in the projections. Against this backdrop, this box summarises the genesis and basic features of the EU emissions trading system (ETS), the system setting the carbon price in the EU.
See moreArticles
1 Hours worked in the euro area
This article analyses the evolution of hours worked per worker in the euro area, given their relevance for the labour contribution to the production of goods and services and for the capacity of the labour market to adjust to macroeconomic developments.[24] First, it analyses the factors behind the trend decline in hours worked per worker over the last 25 years. Second, it analyses the importance of hours worked per worker for labour market adjustment during economic expansions and recoveries. The long-term decline in hours worked per worker may affect labour input, depending on its interplay with labour market participation. Cyclical movements in hours worked per worker allow flexibility during downturns, as firms can adjust labour costs by reducing hours instead of employment (labour hoarding) in the event of adverse shocks to the profitability of the firms concerned. The contribution of average hours to the cyclical adjustment affects the measurement of labour market strength and slack. This is an important determinant of the dynamics of wage and price inflation, making it relevant for the conduct of monetary policy.
See more2 TLTRO III and bank lending conditions
Targeted longer-term refinancing operations (TLTROs) play a key role in preserving favourable bank financing conditions for households and firms, thereby contributing to inflation reaching the ECB’s target of 2% in the medium term. The operations are part of a broad set of complementary policy instruments, which include asset purchases, negative interest rates and forward guidance.[25] Since their inception in 2014, TLTROs have supported the transmission of monetary policy by incentivising lending through their targeting feature and by providing a reduction in bank funding cost, which has been instrumental in avoiding a deterioration in lending conditions that would have otherwise occurred. The third series of the TLTROs (TLTRO III) was introduced in early 2019. The initial announcement of TLTRO III in March 2019 reassured markets about the extension of the pre-existing TLTRO II. The operations were intended to stave off “congestion effects” in bank funding markets that would have otherwise materialised because of the need to replace expiring TLTRO II funds. The operations were recalibrated in September 2019 to preserve favourable bank lending conditions, ensure the smooth functioning of the monetary policy transmission mechanism and therefore further support the accommodative stance of monetary policy. From the start of the coronavirus (COVID-19) crisis, the recalibration of this tool was, thanks to its design and the role of the euro area banking system in the monetary policy transmission mechanism, an integral part of the ECB’s policy response to ensure favourable borrowing conditions for firms and households during the pandemic.
See moreStatistics
Statistical annex© European Central Bank, 2021
Postal address 60640 Frankfurt am Main, Germany
Telephone +49 69 1344 0
Website www.ecb.europa.eu
All rights reserved. Reproduction for educational and non-commercial purposes is permitted provided that the source is acknowledged.
This Bulletin was produced under the responsibility of the Executive Board of the ECB. Translations are prepared and published by the national central banks.
The cut-off date for the statistics included in this issue was 8 September 2021.
For specific terminology please refer to the ECB glossary (available in English only).
PDF ISSN 2363-3417, QB-BP-21-006-EN-N
HTML ISSN 2363-3417, QB-BP-21-006-EN-Q
- The American Rescue Plan (ARP), totalling USD 1.9 trillion (8.9% of GDP), includes a renewal of unemployment benefits, additional one-off payments to households and an increase in both local and state spending to finance public health measures and education. The US Administration has also announced two new medium-term fiscal plans, which are also included in the September ECB staff baseline macroeconomic projections, though their impact on economic activity is likely to be more limited than that of the ARP.
- Real US GDP growth has been revised upward for the end of this year and early 2022 following the recent release of Congressional Budget Office projections. This resulted in a less frontloaded profile for government spending (both consumption and investment) than that which had been assumed in the June 2021 projections.
- For further details, see Box 4 of “ECB staff macroeconomic projections for the euro area, September 2021”, published on the ECB’s website on 9 September 2021.
- The methodology for calculating the EONIA changed on 2 October 2019; it is now calculated as the €STR plus a fixed spread of 8.5 basis points. See the box entitled “Goodbye EONIA, welcome €STR!”, Economic Bulletin, Issue 7, ECB, 2019.
- See the article entitled “Hours worked in the euro area” in this issue of the Economic Bulletin.
- See the box entitled “The impact of supply bottlenecks on trade” in this issue of the Economic Bulletin.
- See the recent box entitled “COVID-19 and the increase in household savings: an update”, Economic Bulletin, Issue 5, ECB, 2021.
- See the "July 2021 Euro area Bank Lending Survey”.
- For a broader overview of the financial situation of non-financial firms during the pandemic, see the box entitled “Non-financial corporate health during the pandemic” in this issue of the Economic Bulletin.
- For further details, see the box entitled “The impact of supply bottlenecks on trade” in this issue of the Economic Bulletin.
- See the article entitled “ECB staff macroeconomic projections for the euro area, September 2021”, published on the ECB’s website on 9 September 2021.
- The share of price imputations for the HICP items stands at 3% in July and at 4% in August, compared with 13% in January. The share of price imputations for the HICPX remains low, at 3% in July and 5% in August, compared with 18% in January.
- For further information on these measures of underlying inflation, see Boxes 2 and 3 in the article entitled “Measures of underlying inflation for the euro area”, Economic Bulletin, Issue 4, ECB, 2018.
- See the “ECB staff macroeconomic projections for the euro area, September 2021”, published on the ECB’s website on 9 September 2021.
- NGEU grants amount to around 0.6% of GDP in each year of the projection horizon. Together with a limited amount of loans, they are assumed to finance about 1.5% of GDP of additive stimulus, cumulatively over the period 2021-23. This stimulus is broadly unrevised compared with the June 2021 Eurosystem staff macroeconomic projections.
- The fiscal stance reflects the direction and size of the stimulus from fiscal policies to the economy beyond the automatic reaction of public finances to the business cycle. It is measured here as the change in the cyclically adjusted primary balance ratio net of government support to the financial sector. Given that the higher budget revenues related to NGEU grants from the EU budget do not have a contractionary impact on demand, the cyclically adjusted primary balance is in this context adjusted to exclude those revenues. Note also that the euro area fiscal projections referred to in this section do not include the European supranational deficit and debt related to NGEU transfers. For more details on the concept of the euro area fiscal stance, see the article entitled “The euro area fiscal stance”, Economic Bulletin, Issue 4, ECB, 2016.
- The euro area aggregate fiscal stance is assessed at -4.3 percentage points of GDP in 2020 and is projected to be -1.1, +2.3 and +0.2 percentage points of GDP in 2021, 2022 and 2023, respectively, after adjustment for revenues related to NGEU grants.
- For instance, in the September 2020 ECB staff macroeconomic projections, the debt-to-GDP level at the end of 2022 was projected to stand about 4 percentage points higher than in the current projections.
- See also the box entitled “Recent dynamics in energy inflation: the role of base effects and taxes”, Economic Bulletin, Issue 3, ECB, 2021.
- We would also like to thank A. Consolo and V. Botelho for their contributions on policy support measures.
- See the box entitled “What is driving the recent surge in shipping costs”, Economic Bulletin, Issue 3, ECB, 2021; and the box entitled “The semiconductor shortage and its implication for euro area trade, production and prices”, Economic Bulletin, Issue 4, ECB, 2021.
- See “ECB presents action plan to include climate change considerations in its monetary policy strategy”, press release, ECB, 8 July 2021. Please also see “Climate change and monetary policy in the euro area”, Occasional Paper Series, No 271, ECB, September 2021, which summarises staff input into the Governing Council’s deliberations in the context of the ECB’s monetary policy strategy review.
- See “Detailed roadmap of climate change-related actions”, annex to the ECB press release presenting its action plan to include climate change considerations in its monetary policy strategy, ECB, 8 July 2021.
- Two main data sources for hours worked per worker are used throughout the article. The first is the Eurostat national accounts dataset, which contains information on total employment and total hours worked. Hours worked per worker are obtained by dividing total hours worked by total employment. The second is the European Union Labour Force Survey (EU-LFS). The EU-LFS collects data on “number of hours usually worked per week” and “number of hours actually worked during the reference week”. The number of hours usually worked per week comprises all hours including extra hours (either paid or unpaid) that a person normally works. The number of hours actually worked during the reference week covers all hours including extra hours regardless of whether they were paid or not.
- See Rostagno, M., Altavilla, C., Carboni, G., Lemke, W., Motto, R., Saint Guilhem, A., Yiangou, J., Monetary Policy in Times of Crisis: A Tale of Two Decades of the European Central Bank, Oxford University Press, 2021 and the article entitled “The transmission of the ECB’s recent non-standard monetary policy measures”, Economic Bulletin, Issue 7, ECB, 2015.


