
The performance of the Eurosystem/ECB staff macroeconomic projections since the financial crisis
Published as part of the ECB Economic Bulletin, Issue 8/2019.
This article evaluates the performance of the Eurosystem/ECB staff macroeconomic projections for the euro area in the context of the elevated macroeconomic volatility and uncertainty that has prevailed since the financial crisis. It finds that there has been considerable variability in projection errors over time. With regard to real GDP growth projections, errors that were substantial during the sovereign debt crisis have become more limited in recent years. As for headline inflation, unexpected fluctuations in oil prices – which in the staff macroeconomic projections are assumed to follow the path of oil price futures – played a dominant role in explaining the errors, as was the case during the pre-crisis years. On the other hand, HICP inflation excluding energy and food has been persistently overprojected since 2013. While these projection errors can also partly be attributed to errors in the conditioning technical assumptions, other factors (such as modelling errors, changes in economic relationships or judgement) have also played a key role at different points in time. The forecast performance of the Eurosystem/ECB staff macroeconomic projections has been broadly similar to that of other international institutions and of private sector forecasters, suggesting that projection errors have been mainly driven by common elements. These may include economic shocks unforeseeable to any forecaster and developments that have become more prominent since the financial crisis, including, among other things, structural reforms, changes in the relationship between slack and prices, globalisation and digitalisation. The article is structured as follows: Section 1 explains how the staff macroeconomic projections are constructed/compiled, Section 2 provides an overview of the errors made in projecting real GDP and HICP inflation since 2010,[1] Section 3 reviews some of the sources of the errors, and Section 4 provides a comparison with the forecasting performance of other institutions and private sector forecasters.
1 Introduction
Every quarter, the ECB publishes projections of real GDP growth, inflation and a range of other macroeconomic variables which serve as a key input into the monetary policy decision-making process.[2] In March and September these staff macroeconomic projections are produced by ECB staff, while in June and December they are produced jointly by staff from the ECB and all of the Eurosystem national central banks. The projections are published for the current and the two subsequent calendar years[3] and serve as a coherent reconciliation of all available information based on a wide range of econometric models and on conditioning technical assumptions (such as for oil prices, exchange rates and interest rates), which can also be supplemented by staff judgement. It should be noted that the projections are neither endorsed by the Governing Council nor do they necessarily reflect the views of the Governing Council on the outlook for the euro area. Instead, they reflect the views of Eurosystem/ECB staff. Nevertheless, they serve as a key input into the monetary policy decision-making process and it is important that they provide reliable indications of the most likely course of future economic developments.
Regular evaluations[4] of the performance of the projections serve two main purposes. First, identifying patterns in projection errors and understanding the reasons why such errors were made can help to improve future projections. For example, persistent errors with the same sign may imply that the econometric models used to produce the projections are not capturing some of the structural changes in the economy and that the models or the tools used for the projections may require some adjustments. Second, past projection errors can provide an indication of the degree of uncertainty surrounding the projections at various horizons ahead.[5]
2 Overview of errors in projecting real GDP and HICP inflation
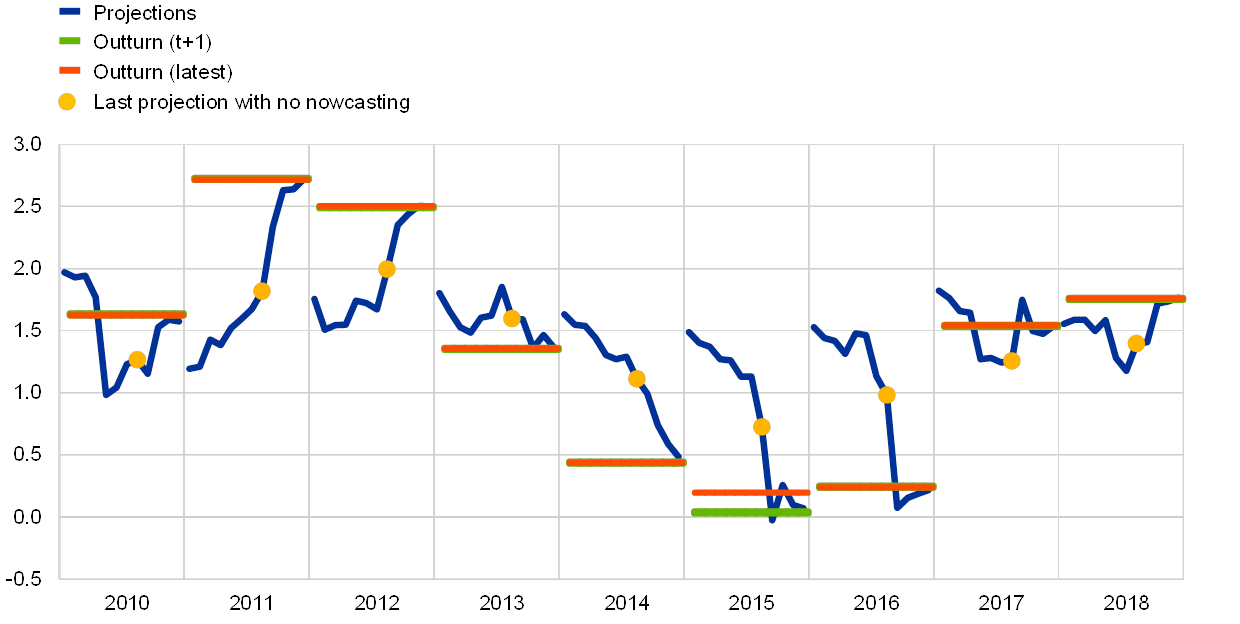
GDP growth was strongly overpredicted during the sovereign debt crisis, but the accuracy of projections has improved in recent years. Chart 1 shows the projections of annual average real GDP growth in each of the quarterly staff macroeconomic projection exercises since 2010, together with their outcomes. For each year, twelve projections are shown, starting with the projection produced in the first quarter two years prior to the reference year and ending with the projection produced in the last quarter of the reference year. The projections produced in the last quarter of the year preceding the reference year are indicated with a dot (e.g. the projections produced in the fourth quarter of 2014 for the year 2015). This is the last projection exercise for which no hard or soft indicators are available for the year being projected.[6] Since economic data, in particular GDP estimates, tend to be revised, Chart 1 shows two outturns: the vintage of the outturns available one year after their initial publication and the latest vintage. As would be expected, in most cases, the projections became successively more accurate as the projection horizon was reduced and as more information became available. An exception is 2010, for which the initial projections produced in 2008 were quite accurate, but were revised downwards heavily with the onset of the financial crisis in 2009 and then revised upwards again as the recovery took hold. The largest errors after 2010 came with the intensification of the sovereign debt crisis between 2012 and 2013, which led to much weaker growth than expected. Over the subsequent years, although the accuracy of the growth projections has been much better, there has been a tendency to underpredict growth, particularly for 2017. This tendency was exacerbated by persistent upward revisions to official data (as illustrated in Chart 1 by the gap between the outturn one year after initial publication and the latest vintage).
Chart 1
Projections and outturns for real GDP growth since 2010
(annual average percentage changes)

Sources: Eurosystem/ECB staff macroeconomic projections and Eurostat.
Notes: Outturn (t+1) refers to the outturn for the year, as available one year after the initial publication. Outturn (latest) refers to currently available data for the year. For each year, twelve projections are shown, starting with those produced in the first quarter of year t-2 up to the fourth quarter of year t. The yellow dots (last projection with no nowcasting) indicate the projection made in the fourth quarter of the previous year, i.e. the last projection for which no hard or soft indicators were available for the year being projected.
Eurosystem/ECB staff projections underpredicted HICP inflation in the early part of the sample and overpredicted it between 2013 and 2016, but HICP inflation projections were broadly accurate in more recent years. Chart 2 shows the projections and outturns for HICP inflation since 2010. The projections made following the financial crisis significantly underestimated inflation, which was expected to fall more significantly in response to the additional economic slack during this period, a feature common across advanced economies at the time.[7] In the ensuing years, particularly between 2014 and 2016, inflation surprised persistently on the downside. In each year, initial projections were around 1.5%, but they were persistently revised downwards, in particular in the light of sharp declines in oil prices, which led to outturns of around 0.2% to 0.5% between 2014 and 2016. More recently, in 2017 and 2018, inflation outturns have been more in line with the projections.
Chart 2
Projections and outturns for HICP inflation since 2010
(annual average percentage changes)
Sources: Eurosystem/ECB staff macroeconomic projections and Eurostat.
Notes: Outturn (t+1) refers to the outturn for the year, as available one year after the initial publication. Outturn (latest) refers to currently available data for the year. For each year, twelve projections are shown, starting with those produced in the first quarter of year t-2 up to the fourth quarter of year t. The yellow dots (last projection with no nowcasting) indicate the projection made in the fourth quarter of the previous year, i.e. the last projection for which no hard or soft indicators were available for the year being projected.
3 Sources of projection errors
This section reviews some of the key factors behind the projection errors for growth and inflation. The Eurosystem/ECB staff macroeconomic projections are conditioned on a number of technical assumptions which can play an important role in explaining the errors that have occurred. The main assumptions are those related to commodity prices (such as oil prices) and financial assumptions (such as interest rates and equity prices), which are based on market expectations, together with assumptions on exchange rates, which are held constant over the projection horizon.[8] Euro area projections are also dependent on the staff assessment of the outlook for the international environment, which can be an additional source of errors. For the purposes of this article, errors are defined as the outcome minus the projection, so a positive error indicates a higher than expected outcome (i.e. an underprediction), while a negative error indicates a lower than expected outcome (i.e. an overprediction).
Errors in the projections for international developments and the technical assumptions explain only a part of the projection errors made for real GDP growth. Chart 3 decomposes the projection errors in the March projections for the following calendar year. Since official GDP data are normally available up to the fourth quarter of the previous year, this corresponds to a two-year projection horizon. Panel a uses elasticities from Eurosystem macroeconomic models to decompose the errors into what can be explained by (i) errors in the conditioning technical assumptions; (ii) errors in the outlook for the international environment; and (iii) all other factors. The decomposition reveals that errors in technical assumptions played a limited role in explaining errors in the GDP growth projections, with the exception of 2015, when a sharp drop in oil prices gave an unexpected boost to growth, and 2018, when the appreciation of the euro exchange rate in the course of 2017 and early 2018 weighed on exports. Errors in international projections (i.e. euro area foreign demand) explain part of the underpredictions of growth for 2010 and 2017, which were years in which euro area exports grew strongly. Global trade was persistently weaker than expected between 2012 and 2016, but the impact on the growth projections was partly offset by other errors with an opposite sign arising from the technical assumptions. The overpredictions of global trade, particularly for emerging market economies, was partly related to a structural shift in the trade intensity of global economic activity. Such structural shifts are difficult to anticipate in real time, but projections since 2016 have been anchored around the view that – over the medium term – global imports will grow at broadly similar rates to global activity.[9] Since that year the projections for global trade have been more accurate. “Other factors” in Chart 3 refers to all other sources of errors, including model misspecification, domestic factors, such as fiscal, structural and monetary policies (beyond the effects captured in the technical assumptions), and judgements introduced by staff. In most cases, the errors in the international projections move in the same direction as the other errors, which may reflect indirect effects beyond direct trade channels. For example, shocks to the global outlook could also have had a negative impact on domestic confidence, leading to lower domestic demand.
Chart 3
Decomposition of errors in the March projections of real GDP growth for the next calendar year
(percentage points)

Source: ECB staff macroeconomic projections.
Notes: Errors are defined as the outturn, as available one year after the initial publication, minus the projection. Technical assumptions refer to the contribution of errors in the conditioning assumptions for oil prices, exchange rates, interest rates and stock prices to the total error. International projections refer to the contribution of errors in the ECB’s projections for euro area foreign demand to the total error. The contributions from errors in the technical assumptions and international environment are calculated using elasticities taken from the macroeconometric models used to produce the Eurosystem staff macroeconomic projections.
Turning to the errors made in the projections for the expenditure components of GDP, there were broad-based overpredictions during the sovereign debt crisis, while recent errors were concentrated in net exports. Panel b of Chart 3 shows a decomposition based on the contributions of the projection errors in the expenditure components to the overall projection error for real GDP growth. In 2012 and 2013 all domestic demand components turned out to be weaker than expected, while the negative surprise on imports was larger than the negative surprise on exports, leading to a more positive than expected contribution from net exports. In the subsequent years, domestic demand components were somewhat stronger than expected, supported by the oil price declines mentioned above and also by successive monetary policy packages which eased financing costs for households and firms. Most recently, the projection errors were dominated by the contribution from net exports, which surprised on the downside in 2016 and on the upside in 2017 and (to a lesser extent) 2018.[10]
As regards inflation, errors in the conditioning technical assumptions, particularly for oil and exchange rates, play a significant role. Chart 4 shows similar decompositions for the projection errors in inflation. As seen in panel a, in general, errors in assumptions explain a larger proportion of the errors in inflation projections than was the case for the growth projections. In particular, large unexpected swings in oil prices played a dominant role in the underpredictions of HICP inflation in 2010-11 and 2017-18 and in the overpredictions in 2015 and 2016. Fluctuations in the exchange rate also contributed to the projection errors. In particular, a large depreciation of the euro in 2014-15 offset part of the downward impact from the lower than expected oil prices in 2015. Apart from the contribution from the technical assumptions, there remains a contribution from other factors which, since 2013, has been persistently negative, albeit rather small over the past two years.
Chart 4
Decomposition of errors in the March projections of HICP inflation for the next calendar year
(percentage points)

Source: ECB staff macroeconomic projections.
Notes: Errors are defined as the outturn, as available one year after the initial publication, minus the projection. Technical assumptions refer to the contribution of errors in the conditioning assumptions for oil prices, exchange rates, interest rates and stock prices to the total error. International projections refer to the contribution of errors in the ECB’s projections for euro area foreign demand to the total error. The contributions from errors in the technical assumptions and international projections are calculated using elasticities taken from the macroeconometric models used to produce the Eurosystem staff macroeconomic projections. Decomposition by HICP sub-component is only available since 2012.
Outcomes of HICP inflation excluding food and energy have surprised persistently on the downside since 2013. Panel b of Chart 4 shows the decomposition of errors in the inflation projections according to the main HICP sub-components and shows that the volatile food and energy components explain the majority of these projection errors, largely driven by the errors in technical assumptions. The projection errors in HICP inflation excluding energy and food, although of a much lower magnitude than those for the volatile components, have shown a persistent negative bias (i.e. overprediction) over the past six years. Errors in technical assumptions may have played some part in generating these errors, such as indirect effects of unexpected declines in oil prices over recent years on non-energy consumer goods and services as well as the appreciation of the euro in 2017 and early 2018. Nevertheless, even after accounting for the errors in technical assumptions, there still remains a persistent overestimation.
A number of explanations have been put forward for the persistently and unexpectedly low underlying inflation over recent years.[11] There may have been an underestimation of the amount of slack in labour and product markets, which may have contributed to lower than expected wage growth and thus reduced cost pressures on prices. Another explanation is related to “pent-up restraints”, meaning that, while declines in prices and wages during the sovereign debt crisis were limited by downward nominal rigidities (contributing to the higher than expected inflation outturns during that period), in the subsequent years, price and wage inflation may have been correspondingly subdued.[12] It may also have been the result of a strengthening of the relationship between slack and prices, i.e. a given level of slack may have resulted in a stronger downward impact on price developments. This may, for example, be a reflection of the role and impact of structural reforms in some countries which were designed to lower nominal rigidities. A further explanation relates to the role of global influences on domestic inflation, which could extend beyond what is captured by the import and commodity prices typically considered in the staff macroeconomic projections. Low inflation might partly reflect increased trade flows, the integration of emerging economies into the world economy and the rise of global value chains shifting parts of production abroad.[13] Within the Eurosystem, a dedicated working group is tasked with improving the models used to produce the projections by looking at the latest advances in forecasting techniques, performing regular analyses of forecast errors and identifying and modelling structural breaks and non-linearities.[14] Eurosystem staff have also tried to address the large contribution of errors in technical assumptions by examining alternative ways of projecting oil prices, rather than using oil futures prices. An approach using a combination of oil price models was found to perform relatively well over some sample periods. However, so far no method has been found which can consistently outperform oil price futures over longer periods.[15]
4 Comparisons with other forecasters
The Eurosystem/ECB staff macroeconomic projections for growth and inflation have performed similarly to those of private sector forecasters and other international institutions. Chart 5 shows the root mean squared forecast error (RMSFE) and the bias (average error) of the projections for the next calendar year produced by Eurosystem/ECB staff compared with the ECB’s Survey of Professional Forecasters (SPF), the European Commission, the International Monetary Fund (IMF) and the Organisation for Economic Co-operation and Development (OECD) – in each case taking the forecasts produced in the second quarter of the year. Different institutions publish at different times during the second quarter, with the Eurosystem staff macroeconomic projections being the last to be published (in June), implying that the latter may have some comparative advantage due to the availability of more recent economic data. In order to adjust for this, the figures shown for the Eurosystem/ECB staff macroeconomic projections are the average RMSFE and bias for the projections published in March and June of each year. Chart 5 shows that the forecast accuracy since 2010 has been rather similar across forecasters and that they share a similar (low) degree of bias. For growth, the RMSFE in the Eurosystem/ECB staff macroeconomic projections was above that of the SPF (indicating a worse performance), but below that of the European Commission and the IMF and similar to that of the OECD. Over this period, the average error for growth was low for all forecasters, albeit slightly negative (indicating overprediction), ranging from 0.0 percentage points for the IMF to -0.16 percentage points for the OECD, with the Eurosystem/ECB staff macroeconomic projections at -0.08 percentage points.
Chart 5
Comparison of errors in Eurosystem/ECB staff macroeconomic projections for the next calendar year with those of the private sector and other institutions
(percentage points)
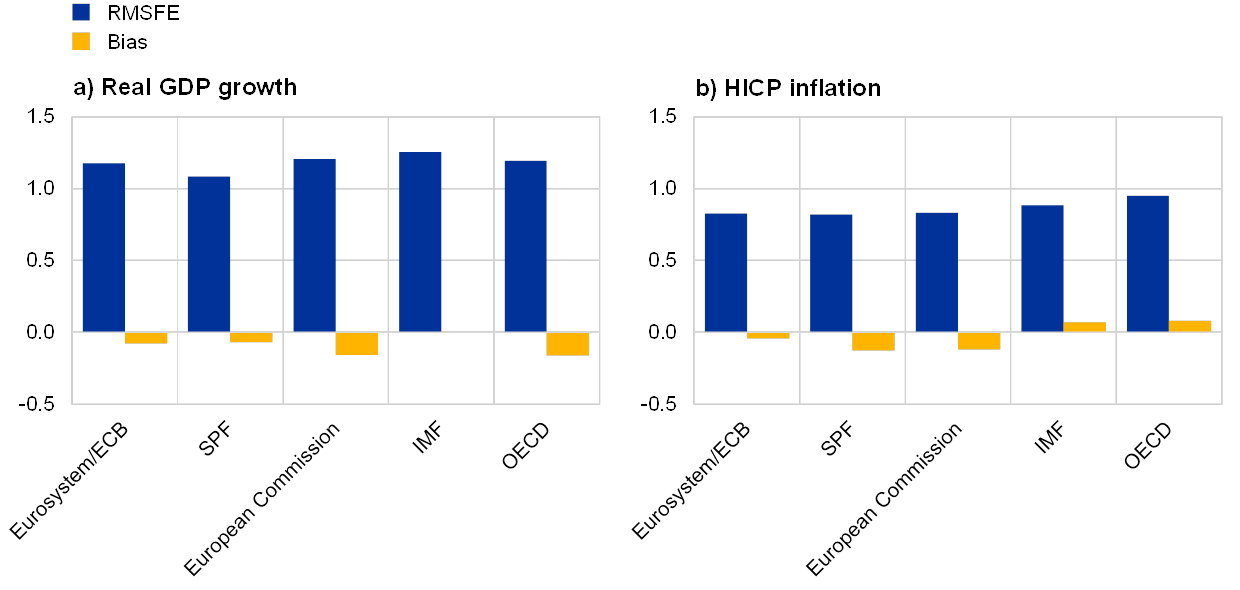
Sources: Eurosystem/ECB staff macroeconomic projections, SPF, European Commission, IMF and OECD.
Notes: The charts refer to the period 2010-18. Errors are defined as the outturn available one year after the initial publication minus the projection. Eurosystem/ECB staff macroeconomic projections refer to the average RMSFE and bias from the March and June projections for the next calendar year. For the other forecasters, the statistics refer to forecasts published in the second quarter for the next calendar year.
For inflation, the RMSFE of the Eurosystem/ECB staff macroeconomic projections was equal to that of the SPF and below those of the other forecasters, implying a better performance for the Eurosystem/ECB staff macroeconomic projections. The average error of the Eurosystem/ECB staff macroeconomic projections was the closest to zero (-0.04 percentage points), indicating the lowest bias, while the largest bias was for the European Commission and the SPF (-0.12 percentage points).[16] Nevertheless, as can be seen in Chart 6, all institutions and the private sector made inflation forecast errors consistently in the same direction over the period between 2010 and 2018, albeit at different magnitudes. That is to say, all forecasters underpredicted HICP inflation between 2010 and 2012 and in 2017 and 2018 (positive forecast errors), but inflation surprised everyone on the downside between 2013 and 2016 (negative errors). This could suggest that the source of the error was common to all forecasters, which could include fundamental economic shocks that were unforeseeable and/or changes in economic relationships, but is unlikely to be related to errors in judgement. Panel c of Chart 6 also shows that the persistent overprediction of HICP inflation excluding food and energy in Eurosystem/ECB staff projections over recent years was a feature they had in common with the forecasts produced by other institutions. The performance of the Eurosystem/ECB staff macroeconomic projections for GDP and inflation over a much longer sample was studied in a recent ECB working paper and the results are discussed in Box 1.
Chart 6
Comparison of errors in Eurosystem/ECB staff macroeconomic projections for the next calendar year with those of the private sector and other institutions
(percentage points)

Sources: Eurosystem/ECB staff macroeconomic projections, SPF, European Commission, IMF and OECD.
Notes: Errors are defined as the outturn available one year after the initial publication minus the projection. Eurosystem/ECB staff macroeconomic projections refer to the average error in the March and June projections for the next calendar year. For the other forecasters, the statistics refer to forecasts published in the second quarter for the next calendar year. For the European Commission, HICP inflation excluding energy and food refers to HICP inflation excluding energy and unprocessed food.
Box 1 Performance of the Eurosystem/ECB staff macroeconomic projections over a longer time-span
A recent ECB working paper[17] investigated more thoroughly the forecasting performance of Eurosystem/ECB staff since almost the start of monetary union. A long sample at a quarterly frequency allows for a more thorough evaluation of the forecasting performance, using tests and statistical criteria that are often employed in the literature of forecast evaluation. Such exercises have been performed by other institutions such as the European Commission, the IMF and the Bank of England.
One of the main issues addressed in the working paper is whether the Eurosystem/ECB staff macroeconomic projections are biased, i.e. whether there is a persistent tendency to make errors in one direction. The paper concludes that Eurosystem/ECB staff inflation projections are unbiased. This conclusion does not contradict the finding of persistent forecast errors in one direction discussed above when evaluating the more recent period. An analysis of a longer sample, with more information and using statistical tools, suggests that this more recent period of persistent overprediction is relatively limited. Interestingly, GDP growth projections appear to have been more biased than HICP inflation projections, and the authors conclude that this bias (overprediction) is persistent and significant at a two-year horizon, such that one cannot conclude that GDP projections are unbiased. The authors also looked at the degree of bias in a time-varying context. Chart A shows the estimated bias over rolling windows of 25 quarters at two different forecasting horizons, four quarters-ahead (h=4) and eight quarters-ahead (h=8), with the green and red lines representing confidence intervals around the estimates. Chart A shows a clear pattern in the HICP inflation projections: the bias has been steadily decreasing over time, from a persistent underprediction in the first few years of monetary union and up to the financial crisis to a persistent overprediction in more recent years. These “cancel out” when analysing the whole sample, thereby leading to the aforementioned conclusion of a general lack of bias. On the other hand, GDP projections appear to have been persistently biased in one direction (overprediction).[18]
Chart A
Time-varying bias estimates in the forecasts of euro area GDP growth and HICP inflation four quarters-ahead (h=4) and eight quarters-ahead (h=8)
(percentage points)
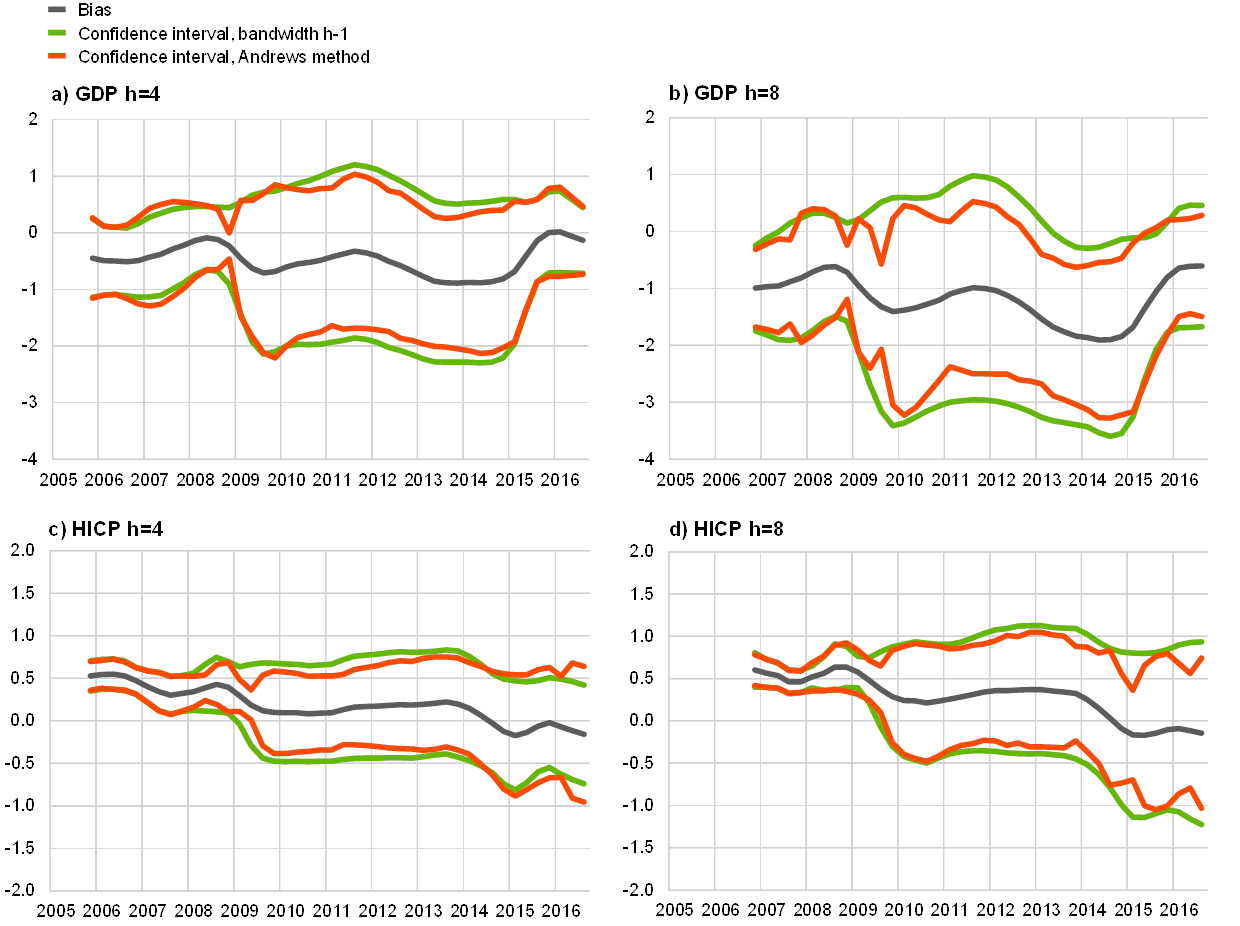
Source: Kontogeorgos and Lambrias (2019).
Notes: Average error (bias, grey line) in the projections of annual percentage changes of real GDP and HICP over rolling windows of 25 quarters. A positive bias indicates underprediction and a negative bias overprediction. The green and red lines represent confidence intervals estimated using different methods, i.e. by setting the bandwidth equal to h-1 (green line) or optimally chosen using the Andrews method (red line) (See Andrews, D.W.K., “Heteroskedasticity and Autocorrelation Consistent Covariance Matrix Estimation”, Econometrica, Vol. 59, No 3, May 1991, pp. 817-858).
5 Conclusions
Overall, the article suggests that the Eurosystem/ECB staff macroeconomic projections have performed well over recent years and in line with projections of other institutions. At the same time, continuous efforts are needed to improve the projections by (i) exploring alternative methods that could increase the accuracy of the technical assumptions; (ii) ensuring that the economic models used for the projections follow the latest advances in forecasting techniques; and, importantly, (c) better evaluating or anticipating fundamental changes in economic relationships resulting, for example, from the impact of structural reforms, globalisation and digitalisation. In order to address these issues, a dedicated group of experts within the Eurosystem regularly reviews the performance of the staff projections and refines the tools used to produce the projections.
- This article focuses on the post-financial crisis period, starting in 2010. The staff macroeconomic projections for the year 2009, which was, as for most other forecasters, a severe outlier in the forecasting record, have been analysed elsewhere in detail. See, for example, Kenny, G. and Morgan, J., “Some lessons from the financial crisis for the economic analysis”, Occasional Paper Series, No 130, ECB, October 2011.
- For further information on the staff macroeconomic projections, see A guide to the Eurosystem/ECB staff macroeconomic projection exercises, ECB, July 2016.
- Since 2017 the projection horizon has been extended in the month of December so that the projections published in that month include the current year and the three subsequent calendar years.
- For a previous analysis of the forecast performance of Eurosystem staff macroeconomic projections, see the article entitled “An assessment of Eurosystem staff macroeconomic projections”, Monthly Bulletin, ECB, May 2013, and, more recently, Kontogeorgos, G. and Lambrias, K., “An analysis of the Eurosystem/ECB projections”, Working Paper Series, No 2291, ECB, June 2019, which provides a comprehensive assessment of the staff macroeconomic projections over a longer time-span (from 1999 to 2018) using a battery of formal statistical tests.
- In addition to point estimates, the ECB publishes projection ranges for the outlook for real GDP growth and inflation. These ranges are constructed on the basis of past projection errors. For further details, see “New procedure for constructing Eurosystem and ECB staff projection ranges”, ECB, December 2009.
- The projections after this point in time are produced with increasing amounts of data on economic developments for the year in question (including short-term indicators allowing the use of nowcasting tools and quarterly GDP information). As would be expected, the inclusion of more information typically helps to improve considerably the accuracy of the projections.
- See, for example, “The Dog That Didn’t Bark: Has Inflation Been Muzzled or Was It Just Sleeping?”, World Economic Outlook, IMF, April 2013, Chapter 3.
- For further details on how the staff projections are constructed, see A guide to the Eurosystem/ECB staff macroeconomic projection exercises, op. cit.
- Trade/income elasticity had fallen in the post-crisis period, amid compositional changes in trade patterns and a declining impetus from the longer-term structural factors that previously drove the rapid expansion of global trade, such as trade liberalisation, the expansion of global value chains and reductions in tariffs and transportation costs. See, for example, IRC Trade Task Force, “Understanding the weakness in global trade – What is the new normal?”, Occasional Paper Series, No 178, ECB, September 2016.
- Note that there is no direct correspondence between the contribution of the errors in the international projections in the model-based decomposition and the contribution of errors in net exports. The former has an impact not only on net exports, but also on other components, notably investment, while the latter is also affected by changes in export market shares and by developments in imports. In recent years, errors in euro area investment and import projections have been affected by partly offsetting developments in Irish imports, which are related to the activities of multinational enterprises and complicate the interpretation of projection errors for these components of GDP.
- For an overview, see the article entitled “Drivers of underlying inflation in the euro area over time: a Phillips curve perspective”, Economic Bulletin, Issue 4, ECB, 2019.
- See Praet, P., “Price stability: a sinking will-o’-the-wisp?”, intervention at the IMF Spring Meetings Seminar, Washington, D.C., April 2015.
- See “Domestic and global drivers of inflation in the euro area”, Economic Bulletin, Issue 4, ECB, 2017, and Nickel, C., “The role of foreign slack in domestic inflation in the Eurozone”, VOX, CEPR Policy Portal, July 2017.
- Within this context, a Eurosystem expert group studied the causes of low inflation; see Ciccarelli, M. and Osbat, C. (eds.), “Low inflation in the euro area: Causes and consequences”, Occasional Paper Series, No 181, ECB, January 2017. A second expert group studied the causes of low wage growth; see Nickel, C., Bobeica, E., Koester, G., Lis, E. and Porqueddu, M. (eds.), “Understanding low wage growth in the euro area and European countries”, Occasional Paper Series, No 232, ECB, September 2019.
- For further details, see the article entitled “Forecasting the price of oil”, Economic Bulletin, Issue 4, ECB, 2015.
- A recent note suggests that market-implied inflation expectations performed similarly to the SPF at horizons similar to those analysed here (one to two years), but argues that markets may have been quicker in adjusting long-term inflation expectations, leading to better forecasting performance over longer horizons in recent years. See Kirker, M. and de-Muizon, M., “The post-crisis performance of inflation expectations and forecasts”, Deutsche Bank Research, September 2019.
- Kontogeorgos, G. and Lambrias, K., op. cit.
- Even though in a time-varying context, as in Chart A, the bias does not appear to be statistically significant, it is when examined over the entire sample.