
Euro area balance of payments in February 2011 and international investment position at the end of the fourth quarter of 2010
In February 2011 the seasonally adjusted current account of the euro area recorded a deficit of EUR 7.2 billion. In the financial account, combined direct and portfolio investment recorded net inflows of EUR 71 billion (non-seasonally adjusted).
At the end of the fourth quarter of 2010 the international investment position of the euro area recorded net liabilities of EUR 1.2 trillion vis-à-vis the rest of the world (approximately 13% of euro area GDP). This represented a reduction of EUR 187 billion in comparison with the revised data for the end of the third quarter of 2010.
Balance of payments in February 2011
The seasonally adjusted current account of the euro area recorded a deficit of EUR 7.2 billion in February 2011 (see Table 1). This reflected deficits for current transfers (EUR 8.0 billion) and goods (EUR 2.3 billion), which were partially offset by a surplus for services (EUR 3.3 billion). The income account was close to balance.
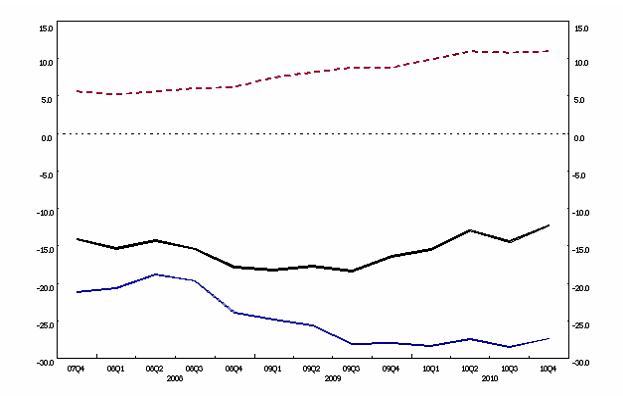
The 12-month cumulated seasonally adjusted current account recorded a deficit of EUR 49.6 billion in February 2011 (around 0.5% of euro area GDP; see Table 1 and Chart 1), compared with a deficit of EUR 15.9 billion a year earlier. This increase resulted from a decrease in the surplus for goods (from EUR 44.4 billion to EUR 7.8 billion) and a switch in the balance for income from a surplus (EUR 1.0 billion) to a deficit (EUR 3.6 billion), which were partly offset by an increase in the surplus for services (from EUR 33.8 billion to EUR 42.1 billion).
Chart 1. Euro area balance of payments: 12-month cumulated transactions
(as a percentage of GDP)
—— current account balance ------ net direct investment —— net portfolio investment

Source: ECB
In the financial account (see Table 2), combined direct and portfolio investment recorded net inflows of EUR 71 billion in February 2011 as a result of net inflows for portfolio investment (EUR 91 billion) that were only partly offset by net outflows for direct investment (EUR 20 billion).
The net outflows for direct investment resulted from net outflows for other capital (mostly inter-company loans) (EUR 26 billion), which were partly offset by net inflows for equity capital and reinvested earnings (EUR 6 billion).
The net inflows for portfolio investment were mainly accounted for by net purchases by foreigners of both euro area debt instruments (EUR 57 billion) and euro area equity (EUR 32 billion).
The financial derivatives account recorded net outflows of EUR 2 billion.
Other investment recorded net outflows of EUR 67 billion, reflecting net outflows for MFIs excluding the Eurosystem (EUR 59 billion) and other sectors (EUR 16 billion), which were to a certain extent offset by net inflows for general government (EUR 6 billion) and the Eurosystem (EUR 2 billion).
The Eurosystem’s stock of reserve assets increased from EUR 562 billion to EUR 577 billion in February 2011, mainly owing to an increase in the market price of gold that was partly offset by transactions (excluding valuation effects) amounting to EUR 1 billion.
In the 12-month period to February 2011 combined direct and portfolio investment recorded cumulated net inflows of EUR 108 billion, compared with net inflows of EUR 191 billion in the preceding 12-month period. This decrease was mainly the result of lower net inflows for portfolio investment (down from EUR 283 billion to EUR 187 billion), which in turn mainly reflected lower net purchases of euro area debt securities by non-resident investors, in particular money market instruments (down from EUR 126 billion to EUR 26 billion).
International investment position at the end of the fourth quarter of 2010
At the end of the fourth quarter of 2010 the international investment position of the euro area recorded net liabilities of EUR 1.2 trillion vis-à-vis the rest of the world (approximately 13% of euro area GDP; see Chart 2). This represented a reduction of EUR 187 billion in comparison with the revised data for the end of the third quarter of 2010 (see Table 3).
The change in the net international investment position was largely a result of a lower net liability position both for portfolio investment (down from EUR 2,635 billion to EUR 2,549 billion) and for other investment (down from EUR 222 billion to EUR 164 billion), and an increase in reserve assets (up from EUR 552 billion to EUR 591 billion). While the changes in the net position for other investment were primarily driven by transactions, the changes in the net positions for portfolio investment and direct investment as well as for reserve assets were mainly driven by “other changes” (predominantly revaluations on account of exchange rate and asset price changes).
At the end of the fourth quarter of 2010 the gross external debt of the euro area amounted to EUR 10.8 trillion (approximately 118% of euro area GDP), which represented a decrease of EUR 150 billion in relation to the revised data for the end of the previous quarter.
Chart 2. Net euro area international investment position
(as a percentage of GDP; outstanding amounts at end of period)
—— total ------ direct investment—— portfolio investment
Source: ECB
Data revisions
This press release incorporates revisions to the balance of payments for the period from January 2008 to January 2011, and to the international investment position for the end of the first, second and third quarters of 2010.
The revisions to the balance of payments in January 2011 did not significantly change the previously published data.
The current account deficit in 2009 and 2010 was revised downwards (from EUR 50.1 billion to EUR 25.7 billion and from EUR 57.3 billion to EUR 36.7 billion respectively), mainly owing to revisions in income. In the financial account, revisions primarily affected direct investment in 2009 with net outflows increasing from EUR 75 billion to EUR 109 billion. The revisions to the international investment position for the end of the third quarter of 2010 led to higher net liability positions (up from EUR 1,228 billion to EUR 1,377 billion) on account of higher net liability positions for other investment and portfolio investment.
Additional information on the euro area balance of payments and international investment position
In this press release, the seasonally adjusted current account refers to working day and seasonally adjusted data. Data for the financial account are not working day or seasonally adjusted.
In line with the agreed allocation of responsibilities, the European Central Bank compiles and disseminates monthly and quarterly balance of payments statistics for the euro area, whereas the European Commission (Eurostat; see new releases for “Euro-indicators”) focuses on quarterly and annual aggregates for the European Union. These data comply with international standards, particularly those set out in the IMF’s Balance of Payments Manual (fifth edition). The aggregates for the euro area and the European Union are compiled consistently on the basis of transactions and positions vis-à-vis residents of countries outside the euro area and the European Union respectively.
A complete set of updated euro area balance of payments statistics (including a quarterly geographical breakdown for the main counterparts) and international investment position statistics is available in the “Statistics” section of the ECB’s website under the headings “Data services”/“Latest monetary, financial markets and balance of payments statistics”. These data, as well as historical euro area balance of payments time series, can be downloaded from the ECB’s Statistical Data Warehouse (SDW). Data up to February 2011 will also be published in the May 2011 issues of the ECB’s Monthly Bulletin and Statistics Pocket Book. Detailed methodological notes are available on the ECB’s website. The next press release on the euro area monthly balance of payments will be published on 20 May 2011.
Annexes
Table 1: Current account of the euro area
Table 2: Monthly balance of payments of the euro area
Table 3: Quarterly international investment position of the euro area
European Central Bank
Directorate General Communications
- Sonnemannstrasse 20
- 60314 Frankfurt am Main, Germany
- +49 69 1344 7455
- media@ecb.europa.eu
Reproduction is permitted provided that the source is acknowledged.
Media contacts