
Euro area balance of payments in April 2010
In April 2010 the seasonally adjusted current account of the euro area recorded a deficit of EUR 5.1 billion. In the financial account, combined direct and portfolio investment recorded net inflows of EUR 19 billion (non-seasonally adjusted).
Current account
The seasonally adjusted current account of the euro area recorded a deficit of EUR 5.1 billion in April 2010 (see Table 1). This reflected deficits in current transfers (EUR 7.3 billion) and income (EUR 2.7 billion), which were only partly offset by surpluses in services (EUR 3.6 billion) and goods (EUR 1.3 billion).
The 12-month cumulated seasonally adjusted current account recorded a deficit of EUR 32.3 billion in April 2010 (around 0.4% of euro area GDP – see Table 1), compared with a deficit of EUR 153.8 billion a year earlier. The reduction in the current account deficit was due to a shift in goods from deficit (EUR 23.0 billion) to surplus (EUR 48.9 billion), to decreases in the deficits in income (from EUR 65.1 billion to EUR 31.8 billion) and current transfers (from EUR 100.2 billion to EUR 85.2 billion), and to an increase in the surplus in services (from EUR 34.5 billion to EUR 35.9 billion).
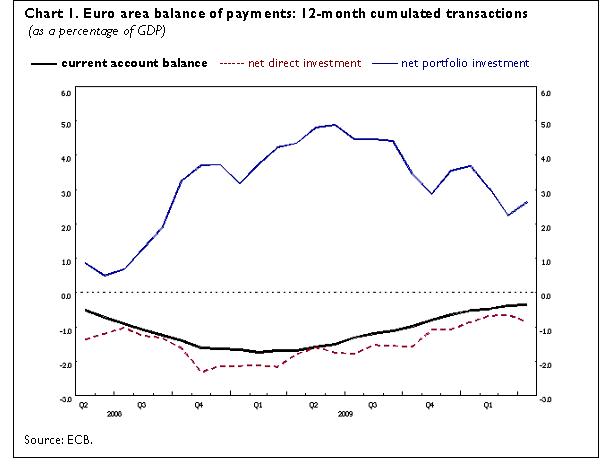
Financial account
In the financial account (see Table 2), combined direct and portfolio investment recorded net inflows of EUR 19 billion in April 2010, as the net inflows in portfolio investment (EUR 30 billion) significantly exceeded the net outflows in direct investment (EUR 11 billion).
The net outflows in direct investment resulted from net outflows in other capital (mostly inter-company loans) (EUR 15 billion). In particular, euro area companies increased their outstanding loans to foreign affiliates (by EUR 14.0 billion). These net outflows were partly offset by net inflows in equity capital and reinvested earnings (EUR 4 billion).
The net inflows in portfolio investment were accounted for by mainly net inflows in debt instruments (EUR 38 billion), predominantly reflecting net purchases of euro area bonds and notes by non-residents, which were to some extent offset by net outflows in equity (EUR 8 billion). The latter were related to net purchases of foreign securities by euro area residents, combined with net sales of euro area securities by non-residents.
The financial derivatives account was close to balance.
O ther investment recorded net outflows of EUR 10 billion, reflecting net outflows in other sectors (EUR 27 billion) and general government (EUR 4 billion), which were partly counterbalanced by net inflows in MFIs excluding the Eurosystem (EUR 20 billion) and in the Eurosystem (EUR 1 billion).
The Eurosystem’s stock of reserve assets was EUR 522 billion at the end of April 2010. Transactions (excluding valuation effects) were balanced in April 2010.
In the 12-month period to April 2010, combined direct and portfolio investment recorded cumulated net inflows of EUR 161 billion, compared with net inflows of EUR 233 billion in the preceding 12-month period. This decrease was the result of lower net inflows in portfolio investment (down from EUR 397 billion to EUR 238 billion), which were partly offset by lower net outflows in direct investment (down from EUR 165 billion to EUR 77 billion). The decrease in net inflows in portfolio investment was due mainly to lower net inflows in debt instruments (down from EUR 512 billion to EUR 103 billion) that were partly counterbalanced by a shift from net outflows (EUR 114 billion) to net inflows (EUR 134 billion) in equity.
Data revisions
This press release incorporates revisions to the data for March 2010. These revisions have not significantly altered the figures published previously.
Additional information on the euro area balance of payments and international investment position
In this press release, the seasonally adjusted current account refers to working day and seasonally adjusted data. Data for the financial account are non-working day and non-seasonally adjusted.
In line with the agreed allocation of responsibilities, the European Central Bank compiles and disseminates monthly and quarterly balance of payments statistics for the euro area, whereas the European Commission (Eurostat; see “Euro-indicators” new releases) focuses on quarterly and annual aggregates for the European Union. These data comply with international standards, particularly those set out in the IMF’s Balance of Payments Manual (fifth edition). The aggregates for the euro area and the European Union are compiled consistently on the basis of transactions and positions with residents of countries outside the euro area and the European Union respectively.
A complete set of updated euro area balance of payments (including a quarterly geographical breakdown by main counterparts) and international investment position statistics is available in the “Statistics” section of the ECB’s website under the headings “Data services”/“Latest monetary, financial markets and balance of payments statistics”. These data, as well as historical euro area balance of payments time series, can be downloaded from the ECB’s Statistical Data Warehouse (SDW). Data up to April 2010 will also be published in the July 2010 issues of the ECB’s Monthly Bulletin and Statistics Pocket Book. Detailed methodological notes are available on the ECB’s website. The next press release on the euro area monthly balance of payments will be published on 19 July 2010, including quarterly international investment position.
Annexes
Table 1: Current account of the euro area
Table 2: Monthly balance of payments of the euro area
European Central Bank
Directorate General Communications
- Sonnemannstrasse 20
- 60314 Frankfurt am Main, Germany
- +49 69 1344 7455
- media@ecb.europa.eu
Reproduction is permitted provided that the source is acknowledged.
Media contacts